Hydrogeologic Characteristics and Hydrologic Changes in the ...
Hydrogeologic Characteristics and Hydrologic Changes in the ...
Hydrogeologic Characteristics and Hydrologic Changes in the ...

Create successful ePaper yourself
Turn your PDF publications into a flip-book with our unique Google optimized e-Paper software.
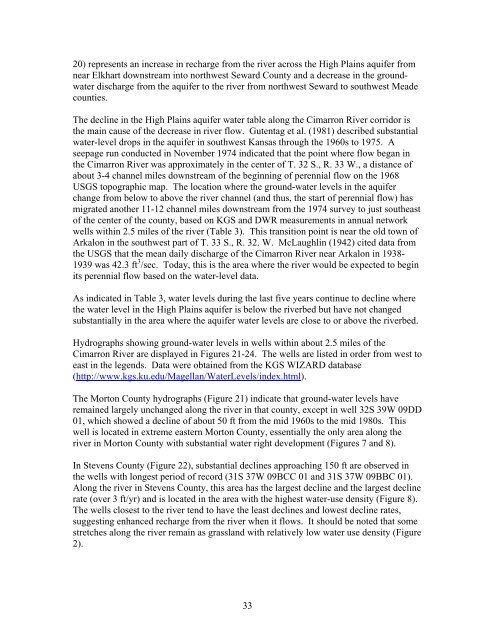
20) represents an <strong>in</strong>crease <strong>in</strong> recharge from <strong>the</strong> river across <strong>the</strong> High Pla<strong>in</strong>s aquifer from<br />
near Elkhart downstream <strong>in</strong>to northwest Seward County <strong>and</strong> a decrease <strong>in</strong> <strong>the</strong> groundwater<br />
discharge from <strong>the</strong> aquifer to <strong>the</strong> river from northwest Seward to southwest Meade<br />
counties.<br />
The decl<strong>in</strong>e <strong>in</strong> <strong>the</strong> High Pla<strong>in</strong>s aquifer water table along <strong>the</strong> Cimarron River corridor is<br />
<strong>the</strong> ma<strong>in</strong> cause of <strong>the</strong> decrease <strong>in</strong> river flow. Gutentag et al. (1981) described substantial<br />
water-level drops <strong>in</strong> <strong>the</strong> aquifer <strong>in</strong> southwest Kansas through <strong>the</strong> 1960s to 1975. A<br />
seepage run conducted <strong>in</strong> November 1974 <strong>in</strong>dicated that <strong>the</strong> po<strong>in</strong>t where flow began <strong>in</strong><br />
<strong>the</strong> Cimarron River was approximately <strong>in</strong> <strong>the</strong> center of T. 32 S., R. 33 W., a distance of<br />
about 3-4 channel miles downstream of <strong>the</strong> beg<strong>in</strong>n<strong>in</strong>g of perennial flow on <strong>the</strong> 1968<br />
USGS topographic map. The location where <strong>the</strong> ground-water levels <strong>in</strong> <strong>the</strong> aquifer<br />
change from below to above <strong>the</strong> river channel (<strong>and</strong> thus, <strong>the</strong> start of perennial flow) has<br />
migrated ano<strong>the</strong>r 11-12 channel miles downstream from <strong>the</strong> 1974 survey to just sou<strong>the</strong>ast<br />
of <strong>the</strong> center of <strong>the</strong> county, based on KGS <strong>and</strong> DWR measurements <strong>in</strong> annual network<br />
wells with<strong>in</strong> 2.5 miles of <strong>the</strong> river (Table 3). This transition po<strong>in</strong>t is near <strong>the</strong> old town of<br />
Arkalon <strong>in</strong> <strong>the</strong> southwest part of T. 33 S., R. 32. W. McLaughl<strong>in</strong> (1942) cited data from<br />
<strong>the</strong> USGS that <strong>the</strong> mean daily discharge of <strong>the</strong> Cimarron River near Arkalon <strong>in</strong> 1938-<br />
1939 was 42.3 ft 3 /sec. Today, this is <strong>the</strong> area where <strong>the</strong> river would be expected to beg<strong>in</strong><br />
its perennial flow based on <strong>the</strong> water-level data.<br />
As <strong>in</strong>dicated <strong>in</strong> Table 3, water levels dur<strong>in</strong>g <strong>the</strong> last five years cont<strong>in</strong>ue to decl<strong>in</strong>e where<br />
<strong>the</strong> water level <strong>in</strong> <strong>the</strong> High Pla<strong>in</strong>s aquifer is below <strong>the</strong> riverbed but have not changed<br />
substantially <strong>in</strong> <strong>the</strong> area where <strong>the</strong> aquifer water levels are close to or above <strong>the</strong> riverbed.<br />
Hydrographs show<strong>in</strong>g ground-water levels <strong>in</strong> wells with<strong>in</strong> about 2.5 miles of <strong>the</strong><br />
Cimarron River are displayed <strong>in</strong> Figures 21-24. The wells are listed <strong>in</strong> order from west to<br />
east <strong>in</strong> <strong>the</strong> legends. Data were obta<strong>in</strong>ed from <strong>the</strong> KGS WIZARD database<br />
(http://www.kgs.ku.edu/Magellan/WaterLevels/<strong>in</strong>dex.html).<br />
The Morton County hydrographs (Figure 21) <strong>in</strong>dicate that ground-water levels have<br />
rema<strong>in</strong>ed largely unchanged along <strong>the</strong> river <strong>in</strong> that county, except <strong>in</strong> well 32S 39W 09DD<br />
01, which showed a decl<strong>in</strong>e of about 50 ft from <strong>the</strong> mid 1960s to <strong>the</strong> mid 1980s. This<br />
well is located <strong>in</strong> extreme eastern Morton County, essentially <strong>the</strong> only area along <strong>the</strong><br />
river <strong>in</strong> Morton County with substantial water right development (Figures 7 <strong>and</strong> 8).<br />
In Stevens County (Figure 22), substantial decl<strong>in</strong>es approach<strong>in</strong>g 150 ft are observed <strong>in</strong><br />
<strong>the</strong> wells with longest period of record (31S 37W 09BCC 01 <strong>and</strong> 31S 37W 09BBC 01).<br />
Along <strong>the</strong> river <strong>in</strong> Stevens County, this area has <strong>the</strong> largest decl<strong>in</strong>e <strong>and</strong> <strong>the</strong> largest decl<strong>in</strong>e<br />
rate (over 3 ft/yr) <strong>and</strong> is located <strong>in</strong> <strong>the</strong> area with <strong>the</strong> highest water-use density (Figure 8).<br />
The wells closest to <strong>the</strong> river tend to have <strong>the</strong> least decl<strong>in</strong>es <strong>and</strong> lowest decl<strong>in</strong>e rates,<br />
suggest<strong>in</strong>g enhanced recharge from <strong>the</strong> river when it flows. It should be noted that some<br />
stretches along <strong>the</strong> river rema<strong>in</strong> as grassl<strong>and</strong> with relatively low water use density (Figure<br />
2).<br />
33