Hydrogeologic Characteristics and Hydrologic Changes in the ...
Hydrogeologic Characteristics and Hydrologic Changes in the ...
Hydrogeologic Characteristics and Hydrologic Changes in the ...

Create successful ePaper yourself
Turn your PDF publications into a flip-book with our unique Google optimized e-Paper software.
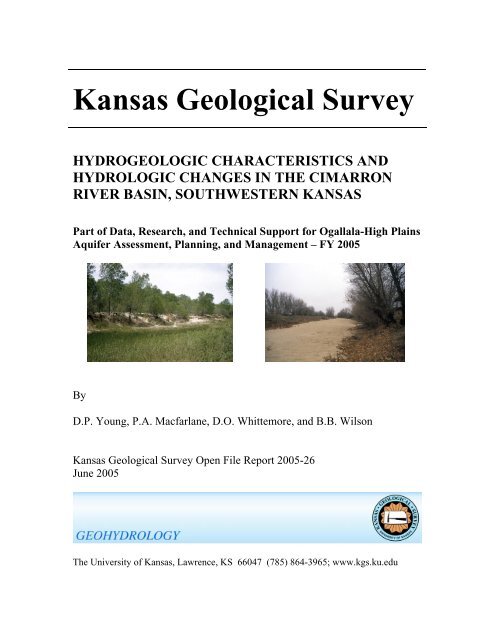
Kansas Geological Survey<br />
HYDROGEOLOGIC CHARACTERISTICS AND<br />
HYDROLOGIC CHANGES IN THE CIMARRON<br />
RIVER BASIN, SOUTHWESTERN KANSAS<br />
Part of Data, Research, <strong>and</strong> Technical Support for Ogallala-High Pla<strong>in</strong>s<br />
Aquifer Assessment, Plann<strong>in</strong>g, <strong>and</strong> Management – FY 2005<br />
By<br />
D.P. Young, P.A. Macfarlane, D.O. Whittemore, <strong>and</strong> B.B. Wilson<br />
Kansas Geological Survey Open File Report 2005-26<br />
June 2005<br />
The University of Kansas, Lawrence, KS 66047 (785) 864-3965; www.kgs.ku.edu
KANSAS GEOLOGICAL SURVEY<br />
OPEN-FILE REPORTS<br />
>>>>>>>>>>>NOT FOR RESALE
<strong>Hydrogeologic</strong> <strong>Characteristics</strong> <strong>and</strong> <strong>Hydrologic</strong> <strong>Changes</strong> <strong>in</strong> <strong>the</strong><br />
Cimarron River Bas<strong>in</strong>, Southwestern Kansas<br />
Part of Data, Research, <strong>and</strong> Technical Support for Ogallala-High Pla<strong>in</strong>s Aquifer<br />
Assessment, Plann<strong>in</strong>g, <strong>and</strong> Management – FY 2005<br />
D.P. Young, P.A. Macfarlane, D.O. Whittemore, <strong>and</strong> B.B. Wilson<br />
Kansas Geological Survey Open File Report 2005-26
Contents<br />
Introduction....................................................................................................................... 1<br />
Bas<strong>in</strong> Description.............................................................................................................. 1<br />
Shallow Subsurface Stratigraphy...................................................................................... 5<br />
Regional <strong>and</strong> Local Geologic Structure............................................................................ 8<br />
Aquifer <strong>and</strong> Conf<strong>in</strong><strong>in</strong>g Units ............................................................................................ 9<br />
Predevelopment <strong>Hydrologic</strong> Conditions......................................................................... 12<br />
Current <strong>Hydrologic</strong> Conditions....................................................................................... 14<br />
Cross Sections <strong>and</strong> Hydrographs Illustrat<strong>in</strong>g <strong>Hydrogeologic</strong> <strong>Characteristics</strong> <strong>and</strong><br />
<strong>Hydrologic</strong> <strong>Changes</strong>.................................................................................................. 15<br />
Lithologic Cross Section Along <strong>the</strong> Cimarron River.......................................... 15<br />
Ground-Water Level Cross Sections <strong>and</strong> Hydrographs...................................... 25<br />
Conclusions..................................................................................................................... 38<br />
Acknowledgments........................................................................................................... 39<br />
References....................................................................................................................... 39<br />
i
List of Figures<br />
Figure 1.<br />
Base map of southwest Kansas show<strong>in</strong>g political <strong>and</strong> bas<strong>in</strong><br />
boundaries, highways, rivers <strong>and</strong> streams, <strong>the</strong> High Pla<strong>in</strong>s<br />
aquifer extent, <strong>and</strong> <strong>the</strong> Bear Creek <strong>and</strong> Crooked Creek-Fowler<br />
fault zones. ................................................................................................2<br />
Figure 2. L<strong>and</strong> use/l<strong>and</strong> cover. .................................................................................3<br />
Figure 3. Surface geology. .......................................................................................4<br />
Figure 4. Bedrock geology <strong>in</strong> <strong>the</strong> Cimarron River bas<strong>in</strong>. ........................................7<br />
Figure 5. Current ground-water table contours. .......................................................11<br />
Figure 6. Predevelopment ground-water table contours. .........................................13<br />
Figure 7.<br />
Po<strong>in</strong>ts of diversion (water rights)..............................................................16<br />
Figure 8. Water-use density (from Wilson et al., 2002)...........................................17<br />
Figure 9. Change <strong>in</strong> saturated thickness, predevelopment to 1999-2001<br />
(modified from Woods <strong>and</strong> Sophocleous, 2002). .....................................18<br />
Figure 10.<br />
Locations of cross sections, rivers <strong>and</strong> streams, river bas<strong>in</strong>, county,<br />
<strong>and</strong> GMD boundaries, extent of <strong>the</strong> High Pla<strong>in</strong>s aquifer, <strong>and</strong> <strong>the</strong><br />
Crooked Creek-Fowler <strong>and</strong> Bear Creek fault zones. ................................19<br />
Figure 11. Material identification color codes. ..........................................................20<br />
Figure 12. Lithologic cross section along <strong>the</strong> Cimarron River. .................................23<br />
Figure 13.<br />
Figure 14.<br />
Figure 15.<br />
Figure 16.<br />
Hydraulic conductivity of <strong>the</strong> High Pla<strong>in</strong>s aquifer (data from<br />
Cederstr<strong>and</strong> <strong>and</strong> Becker, 1998).................................................................24<br />
Cimarron River Section show<strong>in</strong>g profiles of l<strong>and</strong> surface,<br />
predevelopment ground-water table, 2004 ground-water table, <strong>and</strong><br />
bedrock elevations. ..................................................................................26<br />
Section A-A’ show<strong>in</strong>g profiles of l<strong>and</strong> surface, predevelopment<br />
ground-water table, 2004 ground-water table, <strong>and</strong> bedrock elevations....27<br />
Section B-B’ show<strong>in</strong>g profiles of l<strong>and</strong> surface, predevelopment<br />
ground-water table, 2004 ground-water table, <strong>and</strong> bedrock elevations....28<br />
ii
Figure 17.<br />
Figure 18.<br />
Figure 19.<br />
Figure 20.<br />
Figure 21.<br />
Figure 22.<br />
Figure 23.<br />
Figure 24.<br />
Figure 25.<br />
Section C-C’ show<strong>in</strong>g profiles of l<strong>and</strong> surface, predevelopment<br />
ground-water table, 2004 ground-water table, <strong>and</strong> bedrock elevations....29<br />
Section D-D’ show<strong>in</strong>g profiles of l<strong>and</strong> surface, predevelopment<br />
ground-water table, 2004 ground-water table, <strong>and</strong> bedrock elevations....30<br />
Cimarron River flows (USGS data)..........................................................32<br />
Difference between flows north of Forgan <strong>and</strong> flows near<br />
Elkhart (USGS data). ................................................................................32<br />
Hydrographs for wells with<strong>in</strong> about 2.5 miles o f <strong>the</strong> Cimarron<br />
River <strong>in</strong> Morton County............................................................................35<br />
Hydrographs for wells with<strong>in</strong> about 2.5 miles of <strong>the</strong><br />
Cimarron River <strong>in</strong> Stevens County...........................................................35<br />
Hydrographs for wells with<strong>in</strong> about 2.5 miles of <strong>the</strong> Cimarron River<br />
<strong>in</strong> Grant <strong>and</strong> Haskell counties...................................................................36<br />
Hydrographs for wells with<strong>in</strong> about 2.5 miles of <strong>the</strong> Cimarron River<br />
<strong>in</strong> Seward <strong>and</strong> Meade counties. ................................................................36<br />
Ground-water level <strong>in</strong> well 35S 30W 10CDA 01 compared to<br />
mean annual flow <strong>in</strong> <strong>the</strong> Cimarron River north of Forgan, Oklahoma<br />
(KGS <strong>and</strong> USGS data). .............................................................................37<br />
iii
List of Tables<br />
Table 1.<br />
Table 2.<br />
Table 3.<br />
Regional <strong>and</strong> local aquifers <strong>in</strong> southwestern Kansas <strong>in</strong> relation to<br />
subsurface stratigraphy (adapted from Macfarlane, 2000). ......................6<br />
Location of wells <strong>and</strong> test holes used <strong>in</strong> <strong>the</strong> lithologic cross<br />
section along <strong>the</strong> Cimarron River. ............................................................21<br />
Elevation of water levels <strong>in</strong> DWR-KGS annual network wells <strong>and</strong><br />
a USGS multi-level well with<strong>in</strong> 2.8 miles of <strong>the</strong> Cimarron River<br />
relative to <strong>the</strong> river channel elevation <strong>in</strong> Seward <strong>and</strong> southwestern<br />
Meade counties. ........................................................................................34<br />
iv
INTRODUCTION<br />
The Cimarron River bas<strong>in</strong> lies with<strong>in</strong> <strong>the</strong> High Pla<strong>in</strong>s <strong>and</strong> Pla<strong>in</strong>s Border sections of <strong>the</strong><br />
Great Pla<strong>in</strong>s physiographic prov<strong>in</strong>ce (Fenneman, 1931). The bas<strong>in</strong> covers all or portions<br />
of Morton, Stevens, Seward, Meade, Clark, Comanche, Kiowa, Ford, Gray, Haskell,<br />
Grant, Stanton, Hamilton, <strong>and</strong> Kearny counties <strong>in</strong> southwest Kansas <strong>and</strong> is approximately<br />
6,800 mi 2 <strong>in</strong> size.<br />
Ground-water table decl<strong>in</strong>es <strong>in</strong> <strong>the</strong> High Pla<strong>in</strong>s aquifer caused by high-volume,<br />
consumptive pump<strong>in</strong>g of ground water for irrigation have occurred <strong>in</strong> <strong>the</strong> bas<strong>in</strong>. The<br />
water-level decl<strong>in</strong>es have decreased or elim<strong>in</strong>ated ground-water discharge to <strong>the</strong><br />
perennial stretches of <strong>the</strong> Cimarron River, <strong>the</strong>reby decreas<strong>in</strong>g flow to or shorten<strong>in</strong>g <strong>the</strong><br />
length of <strong>the</strong> perennial reaches. The primary area of perennial stretch shorten<strong>in</strong>g has<br />
occurred <strong>in</strong> northwest Seward County <strong>and</strong> <strong>the</strong> ma<strong>in</strong> location of current decrease <strong>in</strong><br />
perennial streamflow is <strong>in</strong> sou<strong>the</strong>ast Seward County <strong>and</strong> southwest Meade County.<br />
Knowledge of <strong>the</strong> lithologic characteristics of <strong>the</strong> High Pla<strong>in</strong>s aquifer is necessary for<br />
underst<strong>and</strong><strong>in</strong>g stream/aquifer <strong>in</strong>teractions <strong>and</strong> water-level changes <strong>in</strong> <strong>the</strong> bas<strong>in</strong>. This<br />
report focuses on <strong>the</strong> hydrogeology <strong>and</strong> hydrologic changes <strong>in</strong> <strong>the</strong> portion of <strong>the</strong> bas<strong>in</strong><br />
where <strong>the</strong> High Pla<strong>in</strong>s aquifer is present below <strong>the</strong> surface, <strong>and</strong> particularly along <strong>the</strong><br />
Cimarron River (Figure 1). A companion report by Whittemore et al. (2005) exam<strong>in</strong>es<br />
water quality <strong>in</strong> Seward <strong>and</strong> Meade counties.<br />
BASIN DESCRIPTION<br />
The climate of <strong>the</strong> region is semiarid. Mean annual precipitation ranges from about 16<br />
<strong>in</strong>ches <strong>in</strong> <strong>the</strong> west to 20 <strong>in</strong>ches <strong>in</strong> <strong>the</strong> east (Meade County). About 75% of annual<br />
precipitation normally falls dur<strong>in</strong>g <strong>the</strong> grow<strong>in</strong>g season. Due to <strong>the</strong> summer heat, low<br />
humidity, <strong>and</strong> high w<strong>in</strong>ds, most precipitation returns rapidly to <strong>the</strong> atmosphere through<br />
evaporation <strong>and</strong> transpiration (Gutentag et al., 1981). As illustrated <strong>in</strong> Figure 2, cropl<strong>and</strong><br />
is <strong>the</strong> dom<strong>in</strong>ant l<strong>and</strong> use/l<strong>and</strong> cover <strong>in</strong> <strong>the</strong> bas<strong>in</strong>; some grassl<strong>and</strong> rema<strong>in</strong>s, particularly<br />
along <strong>the</strong> rivers <strong>and</strong> on s<strong>and</strong> dunes. Irrigation with ground water is common <strong>in</strong> <strong>the</strong> bas<strong>in</strong>.<br />
Quaternary deposits are extensively exposed at <strong>the</strong> surface <strong>and</strong> <strong>in</strong>clude both eolian<br />
deposits (dune s<strong>and</strong> <strong>and</strong> loess) <strong>and</strong> alluvial deposits of silt, clay, s<strong>and</strong>, <strong>and</strong> gravel (Figure<br />
3). The generally flat eastward-slop<strong>in</strong>g terra<strong>in</strong> is characteristic of <strong>the</strong> High Pla<strong>in</strong>s surface<br />
<strong>and</strong> is <strong>in</strong>terrupted by <strong>the</strong> dra<strong>in</strong>age network <strong>and</strong> by subsidence along <strong>the</strong> traces of <strong>the</strong> Bear<br />
Creek <strong>and</strong> <strong>the</strong> Crooked Creek-Fowler fault zones. The prevail<strong>in</strong>g eastward regional slope<br />
of <strong>the</strong> l<strong>and</strong> surface is approximately 12 ft/mi. The flat-to-roll<strong>in</strong>g terra<strong>in</strong> comb<strong>in</strong>ed with<br />
<strong>the</strong> semiarid climate results <strong>in</strong> m<strong>in</strong>imal surface runoff (Sophocleous, 2004). Exceptions<br />
occur along portions of <strong>the</strong> Cimarron River where <strong>the</strong> river has <strong>in</strong>cised a steep valley <strong>in</strong>to<br />
unconsolidated Cenozoic deposits. For example, <strong>in</strong> sou<strong>the</strong>astern Seward County <strong>the</strong> l<strong>and</strong>surface<br />
elevation drops 200 ft or more from <strong>the</strong> upl<strong>and</strong> to <strong>the</strong> river.<br />
1
2<br />
Figure 1. Base map of southwest Kansas show<strong>in</strong>g political <strong>and</strong> bas<strong>in</strong> boundaries, highways, rivers <strong>and</strong> streams, <strong>the</strong> High Pla<strong>in</strong>s aquifer extent,<br />
<strong>and</strong> <strong>the</strong> Bear Creek <strong>and</strong> Crooked Creek-Fowler fault zones. The study area for this report is <strong>the</strong> portion <strong>in</strong> <strong>the</strong> Cimarron River bas<strong>in</strong>.
3<br />
Figure 2. L<strong>and</strong> use/l<strong>and</strong> cover.
4<br />
Figure 3. Surface geology.
The North Fork is <strong>the</strong> major tributary of <strong>the</strong> Cimarron River <strong>in</strong> <strong>the</strong> study area. From <strong>the</strong><br />
Kansas-Colorado border to southwestern Meade County, <strong>the</strong> ma<strong>in</strong> stem of <strong>the</strong> Cimarron<br />
has a gradient of about 11 ft/mi. Today streamflow is <strong>in</strong>termittent along most of <strong>the</strong> river<br />
<strong>in</strong> southwestern Kansas.<br />
Tertiary <strong>and</strong> Quaternary deposits underlie most of <strong>the</strong> study area <strong>and</strong> range <strong>in</strong> thickness<br />
up to more than 500 feet (Woods <strong>and</strong> Sophocleous, 2002). The Pliocene <strong>and</strong><br />
undifferentiated Pleistocene deposits are hydraulically connected <strong>and</strong> lithologically<br />
similar. The saturated parts of <strong>the</strong> Ogallala Formation of Pliocene age, <strong>the</strong><br />
undifferentiated Pleistocene deposits, <strong>and</strong> <strong>the</strong> Quaternary alluvium <strong>in</strong> <strong>the</strong> major stream<br />
corridors compose <strong>the</strong> High Pla<strong>in</strong>s aquifer <strong>in</strong> <strong>the</strong> study area.<br />
SHALLOW SUBSURFACE STRATIGRAPHY<br />
Bedrock units rang<strong>in</strong>g <strong>in</strong> age from Permian to Cretaceous underlie Tertiary <strong>and</strong><br />
Quaternary unconsolidated deposits (Table 1). For <strong>the</strong> most part <strong>the</strong> High Pla<strong>in</strong>s aquifer<br />
overlies Lower Cretaceous bedrock <strong>in</strong> <strong>the</strong> north <strong>and</strong> Permian bedrock <strong>in</strong> <strong>the</strong> sou<strong>the</strong>rn<br />
portion of <strong>the</strong> Cimarron River bas<strong>in</strong> (Figure 4). The uppermost Permian bedrock units <strong>in</strong><br />
<strong>the</strong> Cimarron River bas<strong>in</strong> are <strong>the</strong> Flower-pot Shale, <strong>the</strong> Bla<strong>in</strong>e, Dog Creek, <strong>and</strong><br />
Whitehorse formations, <strong>the</strong> Day Creek Dolomite, <strong>and</strong> <strong>the</strong> Big Bas<strong>in</strong> Formation (Table 1).<br />
Of <strong>the</strong> Permian units, Gutentag et al. (1981) <strong>in</strong>dicate that only <strong>the</strong> Big Bas<strong>in</strong> <strong>and</strong><br />
Whitehorse formations <strong>and</strong> <strong>the</strong> Day Creek Dolomite subcrop beneath <strong>the</strong> High Pla<strong>in</strong>s<br />
aquifer <strong>in</strong> <strong>the</strong> bas<strong>in</strong>. This sequence of Permian-age strata consists primarily of red shales<br />
<strong>and</strong> siltstones <strong>in</strong>terbedded with s<strong>and</strong>stones <strong>and</strong> m<strong>in</strong>or evaporites.<br />
Below, <strong>the</strong> older Permian units are <strong>the</strong> Cedar Hills S<strong>and</strong>stone, <strong>the</strong> Salt Pla<strong>in</strong> Formation,<br />
<strong>the</strong> Harper S<strong>and</strong>stone, <strong>and</strong> <strong>the</strong> Stone Corral Formation of <strong>the</strong> Nippewalla Group, <strong>and</strong> <strong>the</strong><br />
N<strong>in</strong>nescah Shale <strong>and</strong> Well<strong>in</strong>gton Formation of <strong>the</strong> Sumner Group. Taken as a group<br />
<strong>the</strong>se units consist of shales <strong>and</strong> siltstones, s<strong>and</strong>stone, gypsum, anhydrite, <strong>and</strong> dolomite<br />
(Sw<strong>in</strong>eford, 1955). In <strong>the</strong> sou<strong>the</strong>rn Kansas outcrop area, Sw<strong>in</strong>eford estimated that<br />
gypsum/anhydrite makes up more than 60% of <strong>the</strong> Bla<strong>in</strong>e <strong>and</strong> less than 1% of <strong>the</strong><br />
Flower-pot <strong>and</strong> <strong>the</strong> Dog Creek shale. Sw<strong>in</strong>eford estimated that halite makes up<br />
approximately 20% <strong>and</strong> gypsum/anhydrite 2% of <strong>the</strong> Well<strong>in</strong>gton Formation <strong>in</strong> <strong>the</strong><br />
subsurface. Merriam (1963) mapped bedded salts <strong>in</strong> <strong>the</strong> subsurface Whitehorse<br />
Formation, Flower-pot Shale, <strong>and</strong> Well<strong>in</strong>gton Formation <strong>in</strong> sou<strong>the</strong>rn Kansas, <strong>in</strong>clud<strong>in</strong>g<br />
saliferous anhydrite or shale <strong>in</strong> <strong>the</strong> Stone Corral <strong>in</strong> Meade, Seward, Haskell, Grant, <strong>and</strong><br />
Stevens counties. The total thickness of evaporites <strong>in</strong> Kansas is greatest <strong>in</strong> eastern<br />
Meade, Clark, <strong>and</strong> most of Comanche counties <strong>and</strong> exceeds 1,000 ft. Near <strong>the</strong> upper end<br />
of Cimarron River bas<strong>in</strong> <strong>in</strong> Stanton <strong>and</strong> sou<strong>the</strong>rn Hamilton counties, <strong>the</strong> Cedar Hills<br />
S<strong>and</strong>stone is salt-cemented (Holdoway, 1978).<br />
Younger Triassic, Jurassic, <strong>and</strong> basal Cretaceous units consist<strong>in</strong>g of <strong>in</strong>terbedded shales,<br />
mudstones, <strong>and</strong> s<strong>and</strong>stones subcrop or are present <strong>in</strong> isolated outcrops <strong>in</strong> <strong>the</strong> nor<strong>the</strong>rn half<br />
of <strong>the</strong> Cimarron bas<strong>in</strong> <strong>and</strong> near <strong>the</strong> Kansas-Colorado border (Figure 4). These <strong>in</strong>clude<br />
<strong>the</strong> Dockum Group, <strong>the</strong> Morrison Formation, <strong>the</strong> Cheyenne S<strong>and</strong>stone, <strong>the</strong> Kiowa <strong>and</strong><br />
Dakota Formations, <strong>and</strong> <strong>the</strong> Graneros Shale. At <strong>the</strong> upper end of <strong>the</strong> bas<strong>in</strong> <strong>in</strong> southwest<br />
5
Table 1. Regional <strong>and</strong> local aquifers <strong>in</strong> southwestern Kansas <strong>in</strong> relation to subsurface<br />
stratigraphy (adapted from Macfarlane, 2000).<br />
6
7<br />
Figure 4. Bedrock geology <strong>in</strong> <strong>the</strong> Cimarron River bas<strong>in</strong>.
Kearny <strong>and</strong> sou<strong>the</strong>rn Hamilton counties <strong>and</strong> to <strong>the</strong> east <strong>in</strong> Gray County, <strong>the</strong> youngest<br />
bedrock units are <strong>the</strong> Cretaceous chalks <strong>and</strong> marls of <strong>the</strong> Carlile Shale <strong>and</strong> <strong>the</strong> Greenhorn<br />
Limestone. None of <strong>the</strong>se units is known to conta<strong>in</strong> significant amounts of evaporites.<br />
The undifferentiated Quaternary <strong>and</strong> Tertiary Ogallala Formation sediments that compose<br />
<strong>the</strong> High Pla<strong>in</strong>s aquifer consist of clay, silt, s<strong>and</strong>, <strong>and</strong> gravel. Aquifer characteristics are<br />
described <strong>in</strong> more detail <strong>in</strong> follow<strong>in</strong>g sections of this report. The unconsolidated<br />
sediments were deposited largely by eastward flow<strong>in</strong>g streams. W<strong>in</strong>d-blown deposits of<br />
dune s<strong>and</strong> <strong>and</strong> loess mantle much of <strong>the</strong> surface, except along <strong>the</strong> major river/stream<br />
valleys (Figure 3). The total thickness of <strong>the</strong>se unconsolidated deposits ranges up to<br />
more than 500 ft <strong>in</strong> parts of Seward, Stevens, <strong>and</strong> Haskell counties.<br />
The bedrock surface between <strong>the</strong> Bear Creek <strong>and</strong> Crooked Creek-Fowler faults generally<br />
slopes at about 13.5 ft/mi to <strong>the</strong> east-sou<strong>the</strong>ast from southwest Stanton County to <strong>the</strong><br />
town of Meade <strong>in</strong> Meade County (Stullken et al., 1985). Local relief may be as much as<br />
250 ft across <strong>the</strong> fault zones, which are <strong>the</strong> result of dissolution <strong>and</strong> subsidence<br />
(discussed more <strong>in</strong> <strong>the</strong> follow<strong>in</strong>g section).<br />
REGIONAL AND LOCAL GEOLOGIC STRUCTURE<br />
In this part of southwest Kansas, <strong>the</strong> bedrock units are tilted to <strong>the</strong> east <strong>and</strong> nor<strong>the</strong>ast<br />
away from <strong>the</strong> Sierra Gr<strong>and</strong>e uplift <strong>in</strong> Baca County, sou<strong>the</strong>ast Colorado (Gutentag et al.,<br />
1981; Macfarlane, 1993). Gutentag et al. (1981) show <strong>the</strong> dip of <strong>the</strong> Permian units near<br />
<strong>the</strong> bedrock surface steepen<strong>in</strong>g <strong>in</strong> Morton <strong>and</strong> Stanton counties from approximately 9<br />
ft/mi to more than 35 ft/mi near <strong>the</strong> Sierra Gr<strong>and</strong>e uplift <strong>in</strong> sou<strong>the</strong>astern Colorado.<br />
The regional geologic structure has been modified by widespread <strong>and</strong> cont<strong>in</strong>u<strong>in</strong>g<br />
evaporite dissolution <strong>in</strong> <strong>the</strong> bedrock <strong>and</strong> collapse of overly<strong>in</strong>g units from local to regional<br />
scale. Substantial thicknesses of bedded salt <strong>and</strong> gypsum are present <strong>in</strong> <strong>the</strong> bedrock units<br />
with<strong>in</strong> <strong>the</strong> upper 1,000 ft of <strong>the</strong> subsurface <strong>in</strong> <strong>the</strong> Nippewalla Group (Merriam, 1963) <strong>in</strong><br />
southwest Kansas (Frye, 1950).<br />
The Bear Creek (<strong>in</strong> Hamilton, Kearny, Stanton, <strong>and</strong> Grant counties) <strong>and</strong> <strong>the</strong> Crooked<br />
Creek-Fowler (<strong>in</strong> Meade <strong>and</strong> Ford counties) fault zones, shown on Figure 1, def<strong>in</strong>e an<br />
area <strong>in</strong> southwest Kansas where circulat<strong>in</strong>g ground waters have dissolved out <strong>and</strong><br />
removed halite <strong>and</strong> o<strong>the</strong>r evaporite m<strong>in</strong>erals from <strong>the</strong> Bla<strong>in</strong>e Formation, Flower-pot<br />
Shale, <strong>and</strong> Stone Corral Formation (Frye, 1950; Walters, 1978; Gutentag et al., 1981).<br />
Vertical displacement is as much as 250 ft along <strong>the</strong> Bear Creek <strong>and</strong> Crooked Creek-<br />
Fowler faults. The Crooked Creek-Fowler fault was <strong>in</strong>itially mapped as two faults <strong>in</strong><br />
Meade County (Frye <strong>and</strong> Schoff, 1942; Merriam, 1963). Later, Gutentag et al. (1981)<br />
argued that s<strong>in</strong>ce both faults are part of <strong>the</strong> same zone of dissolution <strong>and</strong> collapse, <strong>the</strong>ir<br />
names should be comb<strong>in</strong>ed to <strong>in</strong>dicate <strong>the</strong>ir genetic relationship. Sp<strong>in</strong>azola <strong>and</strong> Dealy<br />
(1983) used geophysical logs to extend <strong>the</strong> Crooked Creek-Fowler fault <strong>in</strong>to sou<strong>the</strong>rn<br />
Ford County. They attributed fault<strong>in</strong>g <strong>and</strong> subsidence features <strong>in</strong> Ford County to<br />
dissolution of gypsum <strong>in</strong> <strong>the</strong> Bla<strong>in</strong>e.<br />
8
L<strong>in</strong>es of s<strong>in</strong>kholes, partially filled s<strong>in</strong>kholes, <strong>and</strong> altered dra<strong>in</strong>age patterns def<strong>in</strong>e <strong>the</strong><br />
traces of <strong>the</strong> Bear Creek <strong>and</strong> <strong>the</strong> Crooked Creek-Fowler faults at <strong>the</strong> surface. Smith<br />
(1940, p. 137) described <strong>the</strong> north branch of Bear Creek where it <strong>in</strong>tersects <strong>the</strong> trace of<br />
<strong>the</strong> Bear Creek fault as “marked by a series of depressions, presumably of solutional<br />
orig<strong>in</strong>, <strong>and</strong> localized by <strong>the</strong> fault.” He cont<strong>in</strong>ues: “A short en echelon fault at <strong>the</strong><br />
northwest is suggested by a l<strong>in</strong>ear tributary valley, also marked by depressions, one of<br />
which was formed <strong>in</strong> historic times [1929],…” Smith noted that when <strong>the</strong>re was<br />
streamflow <strong>in</strong> this reach of Bear Creek it was lost to <strong>the</strong> s<strong>in</strong>kholes. McLaughl<strong>in</strong> (1946)<br />
described <strong>the</strong> north branch of Bear Creek <strong>in</strong> northwestern Grant County as a series of<br />
s<strong>in</strong>kholes with short <strong>in</strong>termittent stream segments ra<strong>the</strong>r than one cont<strong>in</strong>uous stream. He<br />
hypo<strong>the</strong>sized that <strong>the</strong> s<strong>in</strong>ks <strong>in</strong> <strong>the</strong> Stanton area probably began to form as fold<strong>in</strong>g <strong>and</strong><br />
fault<strong>in</strong>g progressed <strong>and</strong> believed this process to be cont<strong>in</strong>u<strong>in</strong>g.<br />
In Meade County, Smith (1940) described <strong>the</strong> Meade salt s<strong>in</strong>k which developed <strong>in</strong> 1879<br />
<strong>and</strong> is located just to <strong>the</strong> east of <strong>the</strong> Crooked Creek-Fowler fault. An unusual change <strong>in</strong><br />
<strong>the</strong> flow direction of Crooked Creek occurs where <strong>the</strong> dra<strong>in</strong>age crosses <strong>the</strong> trace of <strong>the</strong><br />
fault zone north of Fowler <strong>in</strong> southwestern Ford County. As a result <strong>the</strong> stream flows<br />
parallel to <strong>the</strong> trace of <strong>the</strong> fault zone through nor<strong>the</strong>astern <strong>and</strong> central Meade County<br />
before it returns to a more sou<strong>the</strong>astward course. Smith also describes <strong>the</strong> Jones Ranch<br />
bas<strong>in</strong>, located eight miles sou<strong>the</strong>ast of Meade, as an isolated, subcircular structural<br />
depression related to dissolution of Permian evaporites <strong>and</strong> collapse of overly<strong>in</strong>g units.<br />
More recently, Macfarlane <strong>and</strong> Wilson (<strong>in</strong> review) concluded that it is more likely that<br />
<strong>the</strong> Crooked Creek <strong>and</strong> Bear creek faults are not cont<strong>in</strong>uous, but ra<strong>the</strong>r area dissolution<br />
zones characterized by subsidence features <strong>and</strong> local small-scale fault<strong>in</strong>g.<br />
AQUIFER AND CONFINING UNITS<br />
The Kansas aquifer nomenclature has recently been revised by Macfarlane (2000) <strong>and</strong> is<br />
used here to identify <strong>the</strong> aquifer units <strong>in</strong> <strong>the</strong> Cimarron River bas<strong>in</strong>. Accord<strong>in</strong>gly, aquitard<br />
(conf<strong>in</strong><strong>in</strong>g) units are unnamed. The hydrostratigraphic units of <strong>the</strong> Cimarron river bas<strong>in</strong><br />
(Table 1) are:<br />
• <strong>the</strong> High Pla<strong>in</strong>s aquifer,<br />
• an aquitard consist<strong>in</strong>g of <strong>the</strong> Greenhorn Limestone <strong>and</strong> <strong>the</strong> Graneros<br />
Shale,<br />
• <strong>the</strong> upper <strong>and</strong> lower Dakota aquifers of <strong>the</strong> Dakota aquifer system<br />
separated by an aquitard of Kiowa Formation shale,<br />
• <strong>the</strong> Morrison-Dockum aquifer,<br />
• an aquitard consist<strong>in</strong>g of <strong>the</strong> Big Bas<strong>in</strong> Formation,<br />
• <strong>the</strong> Day Creek aquifer,<br />
• an aquitard consist<strong>in</strong>g of <strong>the</strong> Whitehorse, Dog Creek <strong>and</strong> Bla<strong>in</strong>e<br />
formations, <strong>and</strong> <strong>the</strong> Flower-pot Shale, <strong>and</strong><br />
• <strong>the</strong> Cedar Hills-upper Salt Pla<strong>in</strong> aquifer.<br />
9
The High Pla<strong>in</strong>s aquifer consists of <strong>the</strong> Tertiary Ogallala Formation <strong>and</strong> hydraulically<br />
connected Quaternary deposits, <strong>in</strong>clud<strong>in</strong>g <strong>the</strong> alluvium <strong>in</strong> <strong>the</strong> Cimarron River <strong>and</strong><br />
hydraulically connected terrace deposits, dune s<strong>and</strong>s, <strong>and</strong> valley-fill deposits where<br />
saturated. The sediments are composed of a heterogeneous assortment of s<strong>and</strong>, gravel,<br />
silt, <strong>and</strong> clay deposited by streams that flowed eastward from <strong>the</strong> Rocky Mounta<strong>in</strong>s. This<br />
sequence overlies an eroded bedrock surface of Permian to Cretaceous age. The Ogallala<br />
Formation makes up <strong>the</strong> ma<strong>in</strong> part of <strong>the</strong> aquifer <strong>in</strong> western Kansas. Because of <strong>the</strong><br />
similarity <strong>in</strong> <strong>the</strong>ir composition, <strong>the</strong> Tertiary sediments are difficult to dist<strong>in</strong>guish from <strong>the</strong><br />
younger Quaternary sediments.<br />
The High Pla<strong>in</strong>s aquifer varies widely <strong>in</strong> type of material, thickness, <strong>and</strong> layer cont<strong>in</strong>uity.<br />
Individual beds generally are not cont<strong>in</strong>uous <strong>and</strong> with<strong>in</strong> short distances may grade<br />
laterally or vertically <strong>in</strong>to material of different composition. Hydraulic conductivity <strong>and</strong><br />
specific yield depend on sediment types, <strong>and</strong> vary widely both vertically <strong>and</strong> laterally.<br />
Some cemented layers, referred to as mortar beds <strong>and</strong> caliche, occur. Although <strong>the</strong><br />
aquifer is generally unconf<strong>in</strong>ed, conf<strong>in</strong>ed <strong>and</strong> semi-conf<strong>in</strong>ed conditions may occur<br />
locally. Gutentag et al. (1981, p. 60) <strong>in</strong>dicated that ground-water pump<strong>in</strong>g has reduced<br />
<strong>the</strong> conf<strong>in</strong>ement <strong>in</strong> some of <strong>the</strong> deeper zones of <strong>the</strong> aquifer.<br />
Unconsolidated sediment thickness varies greatly due mostly to <strong>the</strong> uneven bedrock<br />
surface. Saturated thickness ranges up to more than 500 ft (Woods <strong>and</strong> Sophocleous,<br />
2002). The greatest thicknesses are found between <strong>the</strong> Bear Creek <strong>and</strong> Crooked Creek-<br />
Fowler faults, which are shown on Figure 1. Thickness may change by as much as 250 ft<br />
across <strong>the</strong> fault zones, which are a result of subsidence associated with <strong>the</strong> dissolution of<br />
Permian evaporites. Saturated thickness is greatest <strong>in</strong> sou<strong>the</strong>rn Stevens <strong>and</strong> Seward<br />
counties. Thick clays are present <strong>in</strong> <strong>the</strong> deeper portion of <strong>the</strong> aquifer <strong>in</strong> sou<strong>the</strong>rn Seward<br />
County.<br />
Regional ground-water flow is from west to east <strong>in</strong> response to <strong>the</strong> hydraulic gradient or<br />
slope of <strong>the</strong> water table. Based on average values of hydraulic gradient <strong>and</strong> aquifer<br />
characteristics, <strong>the</strong> velocity of water mov<strong>in</strong>g through <strong>the</strong> aquifer is about 1 ft/day, which<br />
is typical of s<strong>and</strong> <strong>and</strong> gravel aquifers (Gutentag et al., 1984). Figure 5 shows <strong>the</strong> watertable<br />
contours based on <strong>the</strong> average of water-level measurements taken <strong>in</strong> 2003 <strong>and</strong> 2004;<br />
ground-water flow is perpendicular to <strong>the</strong> contours. Depth to water is variable <strong>and</strong><br />
exceeds 300 feet <strong>in</strong> a large portion of Haskell County <strong>and</strong> <strong>in</strong> portions of Grant <strong>and</strong><br />
Stanton counties (Woods <strong>and</strong> Sophocleous, 2001).<br />
In Meade County, <strong>the</strong> High Pla<strong>in</strong>s aquifer is subdivided <strong>in</strong>to a conf<strong>in</strong>ed part <strong>in</strong> <strong>the</strong> Meade<br />
Artesian bas<strong>in</strong> on <strong>the</strong> west down-dropped side of <strong>the</strong> Crooked Creek-Fowler fault zone<br />
<strong>and</strong> an unconf<strong>in</strong>ed (water table) part that is present throughout <strong>the</strong> rema<strong>in</strong>der of its extent<br />
<strong>in</strong> <strong>the</strong> county (Frye, 1942). Accord<strong>in</strong>g to Frye, water levels <strong>in</strong> wells penetrat<strong>in</strong>g <strong>the</strong><br />
conf<strong>in</strong>ed aquifer were more than 10 above l<strong>and</strong> surface <strong>in</strong> two wells <strong>in</strong> 1939. A separate<br />
alluvial aquifer is dist<strong>in</strong>guished <strong>in</strong> Crooked Creek valley because widespread clay layers<br />
separate <strong>the</strong> alluvial aquifer from <strong>the</strong> High Pla<strong>in</strong>s aquifer. Geohydrologic characteristics<br />
of <strong>the</strong> High Pla<strong>in</strong>s aquifer are discussed <strong>in</strong> more detail <strong>in</strong> <strong>the</strong> follow<strong>in</strong>g sections of this<br />
report.<br />
10
11<br />
Figure 5. Current ground-water table contours.
Ground-water flow with<strong>in</strong> <strong>the</strong> bedrock aquifers is eastward across <strong>the</strong> Cimarron River<br />
bas<strong>in</strong> (Kume <strong>and</strong> Sp<strong>in</strong>azola, 1985; Macfarlane, 1993). Macfarlane showed that prior to<br />
development regional topographic slope, local topographic relief, <strong>and</strong> <strong>the</strong> properties <strong>and</strong><br />
<strong>the</strong> arrangement of <strong>the</strong> aquifer/aquitard units <strong>in</strong> sou<strong>the</strong>astern Colorado <strong>and</strong> western <strong>and</strong><br />
central Kansas primarily <strong>in</strong>fluenced regional ground-water flow.<br />
The upper <strong>and</strong> lower Dakota aquifers consist of s<strong>and</strong>stone units <strong>in</strong> <strong>the</strong> Dakota, Kiowa,<br />
<strong>and</strong> Cheyenne S<strong>and</strong>stone formations. Over most of <strong>the</strong> nor<strong>the</strong>rn half of <strong>the</strong> Cimarron<br />
River bas<strong>in</strong>, <strong>the</strong> Dakota <strong>and</strong> <strong>the</strong> High Pla<strong>in</strong>s aquifers are hydraulically connected except<br />
where <strong>the</strong> aquitard of younger Cretaceous rocks overlies <strong>the</strong> upper Dakota aquifer or<br />
where erosion has removed <strong>the</strong> overly<strong>in</strong>g Dakota Formation <strong>and</strong> Kiowa Formation shale<br />
overlies <strong>the</strong> lower Dakota aquifer. The Morrison-Dockum aquifer consists of s<strong>and</strong>stones<br />
<strong>in</strong> <strong>the</strong> Morrison Formation <strong>and</strong> <strong>in</strong> <strong>the</strong> Dockum Group. In Stanton, Hamilton, Kearny,<br />
Grant, <strong>and</strong> Morton counties, <strong>the</strong> s<strong>and</strong>stone aquifers <strong>in</strong> <strong>the</strong> Morrison-Dockum <strong>and</strong> <strong>in</strong> <strong>the</strong><br />
overly<strong>in</strong>g lower Dakota are hydraulically connected.<br />
In <strong>the</strong> sou<strong>the</strong>rn half of <strong>the</strong> river bas<strong>in</strong>, <strong>the</strong> High Pla<strong>in</strong>s aquifer overlies Permian bedrock<br />
units (Figure 4). These units consist primarily of low permeability red shales <strong>and</strong><br />
siltstones with <strong>in</strong>terbedded evaporites <strong>and</strong> permeable s<strong>and</strong>stones. The Permian strata<br />
above <strong>the</strong> Cedar Hills S<strong>and</strong>stone-upper Salt Pla<strong>in</strong> aquifer are considered a regional<br />
aquitard for <strong>the</strong> most part because <strong>the</strong>y do not yield significant amounts of water to wells.<br />
However, some geologic units are more permeable locally or regionally <strong>and</strong> are<br />
considered as local or regional aquifers. In central Morton County highly permeable<br />
zones exist <strong>in</strong> locally cavernous anhydrite <strong>and</strong> gypsum beds <strong>in</strong>terbedded with shale <strong>in</strong> <strong>the</strong><br />
Permian Day Creek Dolomite (Gutentag et al., 1981). Wells tapp<strong>in</strong>g <strong>the</strong>se zones <strong>in</strong> <strong>the</strong><br />
vic<strong>in</strong>ity of Richfield typically flowed at <strong>the</strong> surface with <strong>in</strong>itial well yields rang<strong>in</strong>g up to<br />
1,000 gallons per m<strong>in</strong>ute (McLaughl<strong>in</strong>, 1942). Deeper <strong>in</strong> <strong>the</strong> subsurface is <strong>the</strong> Cedar<br />
Hills S<strong>and</strong>stone-upper Salt Pla<strong>in</strong> aquifer. This regional aquifer consists of s<strong>and</strong>stones<br />
belong<strong>in</strong>g to <strong>the</strong> Cedar Hills S<strong>and</strong>stone <strong>and</strong> <strong>the</strong> underly<strong>in</strong>g Salt Pla<strong>in</strong> Formation. The<br />
Cedar Hills conta<strong>in</strong>s natural salt water from halite dissolution <strong>and</strong> <strong>in</strong>jected br<strong>in</strong>es from oil<br />
<strong>and</strong> gas operations <strong>in</strong> <strong>the</strong> Hugoton gas field.<br />
PREDEVELOPMENT HYDROLOGIC CONDITIONS<br />
Historically, <strong>the</strong> High Pla<strong>in</strong>s aquifer was <strong>in</strong> a state of approximate equilibrium where<br />
recharge to <strong>the</strong> aquifer equaled discharge. Recharge was from precipitation, underflow<br />
from <strong>the</strong> west, <strong>and</strong> seepage from streams above <strong>and</strong> from bedrock below. Most of <strong>the</strong><br />
natural discharge was to surface waters – spr<strong>in</strong>gs, seeps, <strong>and</strong> streams – but also <strong>in</strong>cluded<br />
underflow to <strong>the</strong> east <strong>and</strong> evapotranspiration where <strong>the</strong> water table was shallow.<br />
Perennial flow <strong>in</strong> <strong>the</strong> Cimarron River historically began <strong>in</strong> northwestern Seward County<br />
<strong>and</strong> cont<strong>in</strong>ued eastward. Perennial flow also occurred <strong>in</strong> parts of southwestern to southcentral<br />
Grant County, as <strong>in</strong>dicated by McLaughl<strong>in</strong> (1946). With<strong>in</strong> <strong>the</strong> bas<strong>in</strong>, a<br />
predevelopment contour map of <strong>the</strong> water table elevation of <strong>the</strong> High Pla<strong>in</strong>s aquifer<br />
(Figure 6) <strong>in</strong>dicates that <strong>the</strong> eastward slop<strong>in</strong>g water table is not much affected by <strong>the</strong><br />
12
13<br />
Figure 6. Predevelopment ground-water table contours.
Cimarron River <strong>and</strong> <strong>the</strong> North Fork of <strong>the</strong> Cimarron <strong>in</strong> Morton, Stanton, Grant, <strong>and</strong><br />
Stevens counties. However, to <strong>the</strong> east, <strong>the</strong> elevation contours bend toward <strong>the</strong> Cimarron<br />
River, <strong>in</strong>dicat<strong>in</strong>g discharge from <strong>the</strong> High Pla<strong>in</strong>s aquifer to <strong>the</strong> stream. The flex<strong>in</strong>g of <strong>the</strong><br />
contours towards <strong>the</strong> stream is most pronounced near <strong>the</strong> sou<strong>the</strong>astern edge of Seward<br />
County.<br />
Us<strong>in</strong>g stream elevations <strong>and</strong> water levels <strong>in</strong> nearby wells, McLaughl<strong>in</strong> (1946)<br />
demonstrated that <strong>the</strong> Cimarron was a naturally ga<strong>in</strong><strong>in</strong>g stream throughout most of its<br />
sou<strong>the</strong>astward course through Seward County. He reported that <strong>in</strong> 1942-43 streamflow<br />
losses occurred between <strong>the</strong> Elkhart bridge <strong>and</strong> <strong>the</strong> Satanta gag<strong>in</strong>g stations but<br />
streamflow ga<strong>in</strong>s occurred from a gage north of Liberal to <strong>the</strong> gage south of Pla<strong>in</strong>s <strong>in</strong><br />
Meade County near <strong>the</strong> Kansas-Oklahoma state l<strong>in</strong>e. Byrne <strong>and</strong> McLaughl<strong>in</strong> (1948)<br />
noted streamflow occurr<strong>in</strong>g on a regular basis <strong>in</strong> <strong>the</strong> sou<strong>the</strong>astern half of <strong>the</strong> river's<br />
ma<strong>in</strong>stem through Seward County. Gutentag et al. (1981) reported steadily <strong>in</strong>creas<strong>in</strong>g<br />
river flows beg<strong>in</strong>n<strong>in</strong>g approximately 50 miles upstream of <strong>the</strong> Kansas-Oklahoma border<br />
<strong>in</strong> November, 1974.<br />
In <strong>the</strong> Crooked Creek dra<strong>in</strong>age, <strong>the</strong> contours of <strong>the</strong> predevelopment water-table surface of<br />
<strong>the</strong> High Pla<strong>in</strong>s aquifer (Figure 6) do not suggest significant streamflow ga<strong>in</strong>s <strong>in</strong> <strong>the</strong><br />
upper stream reach <strong>in</strong> Haskell County <strong>and</strong> near <strong>the</strong> Ford-Meade county l<strong>in</strong>e. The lower<br />
reach of Crooked Creek from <strong>the</strong> Ford-Meade county l<strong>in</strong>e down through Meade County<br />
is parallel to <strong>the</strong> predevelopment water table. Along this reach low permeability clay<br />
layers subdivide <strong>the</strong> High Pla<strong>in</strong>s aquifer <strong>in</strong>to a deep conf<strong>in</strong>ed aquifer west of Crooked<br />
Creek <strong>and</strong> <strong>the</strong> Crooked Creek-Fowler fault <strong>and</strong> a shallow water table aquifer east of<br />
Crooked Creek. Frye (1941) reported seepage of ground water from <strong>the</strong> shallow aquifer<br />
<strong>in</strong>to fields north of Fowler with<strong>in</strong> <strong>the</strong> valley. From 1939 water-level measurements, he<br />
showed <strong>the</strong> potentiometric surface of <strong>the</strong> conf<strong>in</strong>ed aquifer to have been higher than <strong>the</strong><br />
creek level <strong>and</strong> <strong>the</strong> water table of <strong>the</strong> shallow aquifer. This <strong>in</strong>dicates that <strong>the</strong> High Pla<strong>in</strong>s<br />
aquifer naturally discharged to Crooked Creek at least <strong>in</strong> <strong>the</strong> vic<strong>in</strong>ity of Meade, Kansas.<br />
CURRENT HYDROLOGIC CONDITIONS<br />
Whereas most of <strong>the</strong> natural discharge from <strong>the</strong> High Pla<strong>in</strong>s aquifer was to surface<br />
waters, today withdrawals by wells far exceed all o<strong>the</strong>r discharges from <strong>the</strong> aquifer.<br />
Development of water resources <strong>in</strong> <strong>the</strong> High Pla<strong>in</strong>s aquifer <strong>in</strong> <strong>the</strong> Cimarron River bas<strong>in</strong><br />
began sometime prior to 1900 <strong>in</strong> <strong>the</strong> Meade Artesian bas<strong>in</strong> (Johnson, 1901). Frye (1941)<br />
reported slight reductions of fluid pressure (less than 10 ft) <strong>in</strong> most of <strong>the</strong> flow<strong>in</strong>g wells<br />
tapp<strong>in</strong>g <strong>the</strong> conf<strong>in</strong>ed High Pla<strong>in</strong>s aquifer between <strong>the</strong> 1923 <strong>and</strong> 1939. Frye (1942, p. 49)<br />
noted that approximately 1,000 flow<strong>in</strong>g wells had been drilled <strong>in</strong> <strong>the</strong> Meade artesian<br />
bas<strong>in</strong> s<strong>in</strong>ce 1886, but only a few hundred were operable <strong>in</strong> 1942. Large-scale<br />
development did not beg<strong>in</strong> until <strong>the</strong> 1960s <strong>and</strong> 1970s <strong>in</strong> <strong>the</strong> upper parts of <strong>the</strong> bas<strong>in</strong>.<br />
Gutentag et al. (1981, p. 62) noted that a comparison of well locations <strong>and</strong> water-level<br />
decl<strong>in</strong>es suggests <strong>the</strong> cause <strong>and</strong> effect relationship between well density <strong>and</strong> water-level<br />
changes. The areas of greatest well density generally correspond to <strong>the</strong> areas of greatest<br />
withdrawals <strong>and</strong> water-level decl<strong>in</strong>es. Irrigation development was deplet<strong>in</strong>g ground<br />
14
water <strong>in</strong> storage (ground-water m<strong>in</strong><strong>in</strong>g). They also noted that areas with decl<strong>in</strong>es of 40<br />
percent or more had already experienced a large reduction <strong>in</strong> well yields <strong>and</strong> a large<br />
<strong>in</strong>crease <strong>in</strong> <strong>the</strong> cost of pump<strong>in</strong>g. A comparison of current maps -- Water Rights (Figure<br />
7), Water-Use Density (Figure 8), <strong>and</strong> Change <strong>in</strong> Saturated Thickness (Figure 9) --<br />
illustrates that <strong>the</strong> correlation among well density, water-use density, <strong>and</strong> water-level<br />
decl<strong>in</strong>es cont<strong>in</strong>ues today. Water-level decl<strong>in</strong>es up to <strong>and</strong> exceed<strong>in</strong>g 200 ft have occurred<br />
<strong>in</strong> large areas of Grant, Haskell, <strong>and</strong> eastern Stanton counties <strong>and</strong> <strong>in</strong> nor<strong>the</strong>rn Stevens<br />
County. This equates to more than a 40 percent decl<strong>in</strong>e <strong>in</strong> saturated thickness <strong>in</strong> much of<br />
this area.<br />
The water-level decl<strong>in</strong>es have reduced <strong>the</strong> discharge of ground water to <strong>the</strong> Cimarron<br />
River, result<strong>in</strong>g <strong>in</strong> decreased streamflow. Fur<strong>the</strong>r, <strong>the</strong> po<strong>in</strong>t at which perennial flow<br />
beg<strong>in</strong>s <strong>in</strong> <strong>the</strong> Cimarron River has migrated downstream roughly 15 miles. The follow<strong>in</strong>g<br />
section conta<strong>in</strong>s a more detailed presentation <strong>and</strong> discussion of changes <strong>in</strong> hydrologic<br />
conditions.<br />
CROSS SECTIONS AND HYDROGRAPHS ILLUSTRATING HYDROGEOLOGIC<br />
CHARACTERISTICS AND HYDROLOGIC CHANGES<br />
A number of new hydrogeologic cross sections <strong>and</strong> hydrographs were produced for this<br />
report. Figure 10 shows locations of <strong>the</strong> cross sections, rivers <strong>and</strong> streams, river bas<strong>in</strong>,<br />
county, <strong>and</strong> GMD boundaries, extent of <strong>the</strong> High Pla<strong>in</strong>s aquifer, <strong>and</strong> <strong>the</strong> Crooked Creek-<br />
Fowler <strong>and</strong> Bear Creek fault zones.<br />
Lithologic Cross Section Along <strong>the</strong> Cimarron River<br />
A color-coded lithologic cross section along <strong>the</strong> Cimarron River was produced us<strong>in</strong>g<br />
methods of Young et al. (2000). The coarser, more permeable, sediments are lighter <strong>and</strong><br />
<strong>the</strong> f<strong>in</strong>e-gra<strong>in</strong>ed sediments are darker <strong>in</strong> color. The range of colors correspond<strong>in</strong>g to <strong>the</strong><br />
different texture classifications (permeability) of <strong>the</strong> sediment materials is shown <strong>in</strong><br />
Figure 11. An attempt was made to use only logs from locations <strong>in</strong> <strong>the</strong> Cimarron River<br />
valley alluvium. However, <strong>the</strong> alluvium is so narrow that too few logs were available to<br />
produce mean<strong>in</strong>gful sections. Therefore, some locations were just outside of <strong>the</strong> valley,<br />
though most or all were with<strong>in</strong> about a mile of <strong>the</strong> river. Well locations are listed <strong>in</strong><br />
Table 2.<br />
Published logs of wells <strong>and</strong> test holes were used where available. The ma<strong>in</strong> source of<br />
lithologic <strong>in</strong>formation was Water Well Completion Records (WWC-5s) submitted to <strong>the</strong><br />
Kansas Department of Health <strong>and</strong> Environment (KDHE) <strong>and</strong> filed at <strong>the</strong> Kansas<br />
Geological Survey (KGS). Accuracy of locations (<strong>and</strong> <strong>the</strong>refore elevations) is always an<br />
issue when us<strong>in</strong>g <strong>the</strong> WWC-5s. Because of <strong>the</strong> relatively steep slopes of <strong>the</strong> valley walls,<br />
surface elevations were at times difficult to estimate with confidence. Elevations were<br />
<strong>in</strong>itially assigned us<strong>in</strong>g Digital Elevation Models (DEMs) of <strong>the</strong> USGS National<br />
Elevation Dataset (http://gisdata.usgs.gov/NED/ ), but many elevations were reassigned<br />
us<strong>in</strong>g 1:24,000 scale topographic maps. One advantage of us<strong>in</strong>g published logs of test<br />
15
16<br />
Figure 7. Po<strong>in</strong>ts of diversion (water rights).
17<br />
Figure 8. Water-use density (from Wilson et al., 2002).
18<br />
Figure 9. Change <strong>in</strong> saturated thickness, predevelopment to 1999-2001 (modified from Woods <strong>and</strong> Sophocleous, 2002).
19<br />
Figure 10. Locations of cross sections, rivers <strong>and</strong> streams, river bas<strong>in</strong>, county, <strong>and</strong> GMD boundaries, extent of <strong>the</strong> High Pla<strong>in</strong>s aquifer, <strong>and</strong> <strong>the</strong><br />
Crooked Creek-Fowler <strong>and</strong> Bear Creek fault zones.
20<br />
Figure 11. Material identification color codes.
Table 2. Locations of wells <strong>and</strong> test holes used <strong>in</strong> <strong>the</strong> lithologic cross section along <strong>the</strong> Cimarron River.<br />
MORTON 34S 43W 20 DD HASKELL 30S 34W 32 B<br />
34S 43W 16 C SEWARD 31S 34W 05 DB<br />
34S 43W 21 AA<br />
31S 34W 04 BBA<br />
34S 43W 22 DBB<br />
31S 34W 08 D<br />
34S 43W 12 D<br />
31S 34W 16 CDB<br />
34S 42W 07 BB<br />
31S 34W 21 CBA<br />
33S 42W 33 CBD<br />
31S 34W 28 BBA<br />
33S 42W 33 ADD<br />
31S 34W 27 CAA<br />
34S 42W 02 B<br />
31S 34W 35 CD<br />
33S 41W 31 ACC<br />
31S 34W 36 D<br />
33S 41W 21 CCC<br />
32S 33W 06 BA<br />
33S 41W 28 DDD<br />
32S 33W 18 ACA<br />
33S 41W 13 DAB<br />
32S 33W 20 ACB<br />
33S 40W 17 BDD<br />
32S 33W 20 DDB<br />
33S 40W 16 B<br />
32S 33W 28 A<br />
33S 40W 09 CDC<br />
32S 33W 28 CDB<br />
33S 40W 03 ABD<br />
32S 33W 27 BCC<br />
32S 40W 36 AB<br />
32S 33W 34 AB<br />
32S 39W 30 CCA<br />
32S 33W 36 BBB<br />
32S 39W 20 CCC<br />
33S 32W 06 BBA<br />
STEVENS 32S 39W 27 ACD 33S 33W 01 DCD<br />
32S 39W 14 ADC<br />
33S 32W 07 B<br />
32S 39W 14 AAA<br />
33S 32W 18 AD<br />
32S 39W 13 BBC<br />
33S 32W 17 C<br />
32S 39W 12 AAC<br />
33S 32W 21 BBB<br />
32S 38W 06 BDB<br />
33S 32W 27 AB<br />
31S 38W 31 BAC<br />
33S 32W 26 AAA<br />
31S 38W 29 B<br />
33S 32W 25 BA<br />
31S 38W 21 ABA<br />
34S 31W 06 AAA<br />
31S 38W 01 ADB<br />
34S 31W 08 AA<br />
GRANT 30S 37W 30 DD 34S 31W 09 DC<br />
30S 37W 32 AA<br />
34S 31W 23 DDD<br />
30S 37W 33 D<br />
34S 31W 36 ADA<br />
30S 37W 27 BCD MEADE 34S 30W 31 CA<br />
30S 37W 27 DDD<br />
35S 30W 06 AA<br />
30S 37W 26 CDB 35S 30W 05<br />
30S 37W 23 DB<br />
35S 30W 17 AA<br />
30S 37W 25 AC<br />
35S 30W 09 CAC<br />
30S 36W 20 B<br />
35S 30W 16 DA<br />
30S 36W 17 DB<br />
35S 29W 07 CAC<br />
30S 36W 17 D<br />
35S 29W 09 CAD<br />
30S 36W 23<br />
35S 29W 11 BB<br />
30S 36W 24 CCC<br />
35S 29W 13 AD<br />
30S 35W 33 AA<br />
35S 28W 18 CBA<br />
30S 35W 34 CCC<br />
30S 35W 26 B<br />
30S 35W 24 ACC<br />
30S 35W 24 DAA<br />
21
holes is that <strong>the</strong> surface elevation was commonly surveyed or previously estimated from<br />
USGS topographic maps.<br />
An attempt was made to trace <strong>the</strong> base of <strong>the</strong> aquifer by us<strong>in</strong>g only logs that <strong>in</strong>tercept <strong>the</strong><br />
bedrock surface, but because of <strong>the</strong> scarcity of logs, logs that did not go to bedrock were<br />
<strong>in</strong>cluded. Fur<strong>the</strong>r, because of <strong>the</strong> complexity of <strong>the</strong> geology <strong>and</strong> that fact that true<br />
bedrock <strong>in</strong> <strong>the</strong> area is (<strong>in</strong> reality, <strong>and</strong> especially from <strong>the</strong> logs) commonly difficult to<br />
dist<strong>in</strong>guish from <strong>the</strong> Cenozoic deposits, <strong>the</strong> deepest logs give only an approximation of<br />
<strong>the</strong> bedrock surface. Bedrock surface profiles are <strong>in</strong>cluded <strong>in</strong> <strong>the</strong> water-level cross<br />
sections <strong>in</strong> <strong>the</strong> follow<strong>in</strong>g subsection.<br />
Most notable <strong>in</strong> <strong>the</strong> lithologic section (Figure 12) is <strong>the</strong> west-to-east transition from an<br />
abundance of f<strong>in</strong>e-gra<strong>in</strong>ed deposits to primarily coarser-gra<strong>in</strong>ed materials <strong>in</strong> extreme<br />
eastern Grant County. West of <strong>the</strong>re, an alternat<strong>in</strong>g sequence of f<strong>in</strong>e- <strong>and</strong> coarse-gra<strong>in</strong>ed<br />
deposits with few substantial beds of coarse deposits dom<strong>in</strong>ates <strong>the</strong> section, except <strong>in</strong> <strong>the</strong><br />
vic<strong>in</strong>ity where <strong>the</strong> river crosses <strong>the</strong> Stevens-Grant County l<strong>in</strong>e, where relatively thick<br />
s<strong>and</strong> <strong>and</strong> gravel beds are present. This relatively permeable portion of <strong>the</strong> aquifer is<br />
reflected by high water use <strong>in</strong> <strong>the</strong> water-use density maps (Wilson et al., 2002), of which<br />
Figure 8 is an example. Beneath <strong>the</strong> river valley <strong>in</strong> Seward County, <strong>the</strong> aquifer conta<strong>in</strong>s<br />
primarily thick beds of productive s<strong>and</strong> <strong>and</strong> gravel with th<strong>in</strong>ner <strong>in</strong>terlayers <strong>and</strong> lenses of<br />
silt <strong>and</strong> clay. The lithologic variations along <strong>the</strong> river are reflected <strong>in</strong> <strong>the</strong> map of<br />
hydraulic conductivity (Figure 13), which shows mostly lower-permeability sediments <strong>in</strong><br />
<strong>the</strong> west (except for a local area of higher-permeability sediments where <strong>the</strong> river crosses<br />
<strong>the</strong> Stevens-Grant County l<strong>in</strong>e), <strong>and</strong> generally higher-permeability sediments <strong>in</strong> <strong>the</strong> east<br />
(<strong>in</strong> Seward <strong>and</strong> Meade counties).<br />
The shallow alluvial aquifer appears variable <strong>in</strong> thickness <strong>and</strong> composition. However, <strong>in</strong><br />
reality it is probably more cont<strong>in</strong>uous than it appears <strong>in</strong> <strong>the</strong> section. First, many of <strong>the</strong><br />
wells with logs are located far enough from <strong>the</strong> river so that no little or no alluvium is<br />
present. Topographic maps <strong>in</strong>dicate s<strong>and</strong> (<strong>and</strong> presumably gravel) along much of <strong>the</strong><br />
river’s course. Also, very few of <strong>the</strong> logs were located <strong>in</strong> <strong>the</strong> base of <strong>the</strong> valley; most had<br />
surface elevations tens of feet above river level. Therefore many of <strong>the</strong> logs conta<strong>in</strong> tens<br />
of feet of terrace deposits above <strong>the</strong> recent alluvium. Thus, <strong>the</strong> alluvial aquifer is<br />
expected to be more cont<strong>in</strong>uous than it appears on <strong>the</strong> section, but is commonly only a<br />
few tens of feet thick.<br />
In <strong>the</strong> western part of <strong>the</strong> section (Morton <strong>and</strong> Stevens counties), <strong>the</strong> alluvial aquifer is<br />
for <strong>the</strong> most part dist<strong>in</strong>guishable from <strong>the</strong> deeper High Pla<strong>in</strong>s aquifer. The coarser<br />
gra<strong>in</strong>ed alluvium overlies a substantial thickness of f<strong>in</strong>e-gra<strong>in</strong>ed silts <strong>and</strong> clays. In fact<br />
<strong>the</strong> logs show mostly f<strong>in</strong>e-gra<strong>in</strong>ed deposits, with some coarser beds at <strong>the</strong> base of <strong>the</strong><br />
aquifer. The alluvium is perhaps thickest <strong>and</strong> most permeable <strong>in</strong> Morton County, at <strong>the</strong><br />
western extent of <strong>the</strong> High Pla<strong>in</strong>s aquifer where <strong>the</strong> bedrock surface is shallow. In Grant<br />
County <strong>the</strong> cont<strong>in</strong>uity <strong>and</strong> character of <strong>the</strong> alluvium becomes less discernible. Here <strong>the</strong><br />
ma<strong>in</strong> aquifer appears most heterogeneous, consist<strong>in</strong>g of alternat<strong>in</strong>g layers of f<strong>in</strong>e- <strong>and</strong><br />
coarse-gra<strong>in</strong>ed sediment. There is probably not a good hydraulic connection between <strong>the</strong><br />
22
23<br />
Figure 12. Lithologic cross section along <strong>the</strong> Cimarron River.
24<br />
Figure 13. Hydraulic conductivity of <strong>the</strong> High Pla<strong>in</strong>s aquifer (data from Cederstr<strong>and</strong> <strong>and</strong> Becker, 1998).
shallow alluvium <strong>and</strong> <strong>the</strong> deeper aquifer along <strong>the</strong> course of <strong>the</strong> river <strong>in</strong> most of Grant<br />
County.<br />
While a permeable zone <strong>in</strong> <strong>the</strong> High Pla<strong>in</strong>s aquifer is evident <strong>in</strong> a small area where <strong>the</strong><br />
river crosses from Stevens to Grant County, sou<strong>the</strong>astern Grant County marks <strong>the</strong> ma<strong>in</strong><br />
transition to primarily coarse-gra<strong>in</strong>ed deposits. Interest<strong>in</strong>gly, perennial flow <strong>in</strong> <strong>the</strong> river<br />
historically began a short distance downgradient of where <strong>the</strong> transition from f<strong>in</strong>e- to<br />
coarse-gra<strong>in</strong>ed materials occurs. If (semi)conf<strong>in</strong>ed conditions existed, <strong>the</strong> lithology<br />
change might have allowed greater discharge of ground water to occur. The coarse<br />
deposits predom<strong>in</strong>ate beneath <strong>the</strong> river valley through most of Seward County, <strong>and</strong> <strong>the</strong><br />
shallow alluvium is generally not dist<strong>in</strong>guishable from <strong>the</strong> ma<strong>in</strong> aquifer (based on <strong>the</strong>se<br />
readily-available logs). Clay layers appear th<strong>in</strong> <strong>and</strong> of variable cont<strong>in</strong>uity; none<strong>the</strong>less,<br />
<strong>the</strong>y may retard <strong>the</strong> vertical movement of water. The deepest logs show very little basal<br />
s<strong>and</strong>s <strong>and</strong> gravels. Thus, <strong>the</strong> most productive part of <strong>the</strong> aquifer appears to be above <strong>the</strong><br />
depth to which most of <strong>the</strong> wells were drilled, roughly 200 ft. The drillers commonly<br />
stopped when <strong>the</strong>y encountered a substantial thickness of clayey material at depth or only<br />
<strong>in</strong>stalled production wells to <strong>the</strong> top of <strong>the</strong> clay after drill<strong>in</strong>g test holes.<br />
From sou<strong>the</strong>astern Seward County <strong>in</strong>to southwestern Meade County, <strong>the</strong> aquifer aga<strong>in</strong><br />
becomes more heterogeneous. A test hole <strong>in</strong> extreme southwestern Meade County (NE,<br />
SW Sec. 31, T. 34 S, R. 30 W) encountered noth<strong>in</strong>g but f<strong>in</strong>e-gra<strong>in</strong>ed materials <strong>and</strong><br />
caliche down to more than 200 ft. The geology becomes complex <strong>in</strong> this area <strong>and</strong> <strong>the</strong><br />
valley becomes very narrow. Frye (1942) attributed <strong>the</strong> constriction to resistant Laverne<br />
beds that dip below <strong>the</strong> river. The test hole referred to above probably encountered a<br />
lacustr<strong>in</strong>e deposit related to local dissolution <strong>and</strong> subsidence. Both Smith (1940) <strong>and</strong><br />
Frye (1942) suggest that such lacustr<strong>in</strong>e deposits located a short distance from <strong>the</strong> river<br />
are related to solution <strong>and</strong> collapse of <strong>the</strong> underly<strong>in</strong>g bedrock prior to deposition.<br />
Macfarlane <strong>and</strong> Wilson (<strong>in</strong> review) mapped several areally extensive closed depressions<br />
<strong>in</strong> <strong>the</strong> bedrock surface <strong>in</strong> sou<strong>the</strong>rn Seward County. East of <strong>the</strong> aforementioned test hole,<br />
<strong>the</strong> aquifer conta<strong>in</strong>s mostly permeable sediments. The aquifer th<strong>in</strong>s abruptly <strong>in</strong> Meade<br />
County approach<strong>in</strong>g <strong>the</strong> Crooked Creek-Fowler fault, <strong>the</strong> eastern extent of <strong>the</strong> High<br />
Pla<strong>in</strong>s aquifer.<br />
Ground-Water Level Cross Sections <strong>and</strong> Hydrographs<br />
The Cimarron River Section <strong>and</strong> Sections A-A’, B-B’, C-C’ <strong>and</strong> D-D’ (hereafter referred<br />
to as A, B, C, <strong>and</strong> D; Figures 14 thru 18) <strong>in</strong>clude profiles of l<strong>and</strong> surface, predevelopment<br />
ground-water table, 2004 ground-water table, <strong>and</strong> bedrock elevations. Locations of <strong>the</strong><br />
sections are shown <strong>in</strong> Figure 10. Water table <strong>and</strong> bedrock data were obta<strong>in</strong>ed from <strong>the</strong><br />
KGS section-level database available at http://www.kgs.ku.edu/HighPla<strong>in</strong>s/data.htm.<br />
The USGS National Elevation Dataset (http://gisdata.usgs.gov/NED/, 30 m resolution)<br />
was used for l<strong>and</strong> surface elevation because section-level database (1 mile resolution)<br />
was too coarse.<br />
The Cimarron River cross section (Figure 14) resembles <strong>the</strong> river cross section produced<br />
by McLaughl<strong>in</strong> (1946, p. 49), but shows greater detail. The surface gradient along <strong>the</strong><br />
25
26<br />
Figure 14. Cimarron River Section show<strong>in</strong>g profiles of l<strong>and</strong> surface, predevelopment ground-water table, 2004 ground-water table, <strong>and</strong> bedrock<br />
elevations. Ground-water table elevations are <strong>in</strong>dicative of conditions near but upl<strong>and</strong> of <strong>the</strong> river.
27<br />
Figure 15. Section A-A’ show<strong>in</strong>g profiles of l<strong>and</strong> surface, predevelopment ground-water table, 2004 ground-water table, <strong>and</strong> bedrock elevations.
28<br />
Figure 16. Section B-B’ show<strong>in</strong>g profiles of l<strong>and</strong> surface, predevelopment ground-water table, 2004 ground-water table, <strong>and</strong> bedrock elevations.
29<br />
Figure 17. Section C-C’ show<strong>in</strong>g profiles of l<strong>and</strong> surface, predevelopment ground-water table, 2004 ground-water table, <strong>and</strong> bedrock elevations.
30<br />
Figure 18. Section D-D’ show<strong>in</strong>g profiles of l<strong>and</strong> surface, predevelopment ground-water table, 2004 ground-water table, <strong>and</strong> bedrock elevations.
iver channel is about 11 ft/mi. Along <strong>the</strong> Cimarron River, <strong>the</strong> greatest saturated<br />
thickness <strong>in</strong> <strong>the</strong> High Pla<strong>in</strong>s aquifer occurs <strong>in</strong> eastern Seward County. At <strong>the</strong><br />
downstream end of <strong>the</strong> Cimarron River cross section <strong>in</strong> sou<strong>the</strong>rn Meade County, <strong>the</strong><br />
bedrock surface elevation <strong>in</strong>creases <strong>and</strong> <strong>the</strong> aquifer th<strong>in</strong>s abruptly toward <strong>the</strong> Crooked<br />
Creek-Fowler fault zone.<br />
Prior to ground-water development, <strong>the</strong> surface of <strong>the</strong> ground-water table <strong>in</strong> <strong>the</strong> Cimarron<br />
valley was relatively near <strong>the</strong> bottom of <strong>the</strong> river channel along <strong>the</strong> entire length of <strong>the</strong><br />
river <strong>in</strong> Kansas. The predevelopment water table <strong>in</strong>dicates that perennial flow <strong>in</strong> <strong>the</strong><br />
Cimarron River historically occurred <strong>in</strong> southwest <strong>and</strong> south-central Grant County <strong>and</strong><br />
began aga<strong>in</strong> <strong>in</strong> northwestern Seward County <strong>and</strong> cont<strong>in</strong>ued eastward. A graph <strong>in</strong><br />
McLaughl<strong>in</strong> (1946; p. 50) based on streamflow measurements <strong>in</strong> 1942 <strong>and</strong> 1943 showed<br />
that <strong>the</strong> river generally lost flow from near Elkhart to <strong>the</strong> northwest part of Seward<br />
County <strong>and</strong> ga<strong>in</strong>ed flow from northwest Seward to southwest Meade County. A map of<br />
water-table contours for <strong>the</strong> High Pla<strong>in</strong>s aquifer <strong>in</strong> 1940 (Byrne <strong>and</strong> McLaughl<strong>in</strong>, 1948;<br />
Plate 1) <strong>in</strong>dicates that perennial flow <strong>in</strong> <strong>the</strong> river began <strong>in</strong> <strong>the</strong> northwest part of T. 32 S.,<br />
R. 33 W <strong>in</strong> northwest Seward County. This is approximately <strong>the</strong> same vic<strong>in</strong>ity as <strong>the</strong><br />
start of <strong>the</strong> perennial portion of <strong>the</strong> river <strong>in</strong>dicated on <strong>the</strong> USGS Sublette SW topographic<br />
quadrangle of 1968 based on aerial photographs of 1966.<br />
The 2004 water table lies below <strong>the</strong> level of <strong>the</strong> riverbed from southwest Morton County<br />
to sou<strong>the</strong>ast of <strong>the</strong> center of Seward County. The water-level surface <strong>in</strong> <strong>the</strong> river valley is<br />
near or above <strong>the</strong> l<strong>and</strong> surface only <strong>in</strong> southwesternmost Morton County, where <strong>the</strong><br />
bedrock surface is relatively close to <strong>the</strong> l<strong>and</strong> surface, <strong>and</strong> <strong>in</strong> sou<strong>the</strong>ast Seward County<br />
<strong>and</strong> eastward. Thus, <strong>the</strong> po<strong>in</strong>t at which perennial flow began <strong>in</strong> Seward County has<br />
migrated downstream some 15 miles.<br />
High Pla<strong>in</strong>s aquifer saturated thickness decl<strong>in</strong>es of over 50% are evident along stretches<br />
of <strong>the</strong> river, such as where <strong>the</strong> river crosses from Stevens to Grant County (Figure 14), an<br />
area characterized by relatively permeable sediments <strong>and</strong> high water-use density. The<br />
2004 water table is more than 100 ft below <strong>the</strong> river channel at this county boundary <strong>and</strong><br />
to <strong>the</strong> east where <strong>the</strong> river crosses <strong>the</strong> southwest corner of Haskell County.<br />
Ground-water table decl<strong>in</strong>es have caused long-term flow decreases <strong>in</strong> <strong>the</strong> Cimarron River<br />
<strong>and</strong> o<strong>the</strong>r rivers that orig<strong>in</strong>ate ma<strong>in</strong>ly with<strong>in</strong> <strong>the</strong> extent of <strong>the</strong> High Pla<strong>in</strong>s aquifer<br />
(Buddemeier et al., 2003). The decrease <strong>in</strong> fresh ground-water discharge from <strong>the</strong> High<br />
Pla<strong>in</strong>s aquifer, caused by decl<strong>in</strong>es <strong>in</strong> ground-water levels, has resulted <strong>in</strong> an <strong>in</strong>crease <strong>in</strong><br />
<strong>the</strong> sal<strong>in</strong>ity of <strong>the</strong> river (see Whittemore et al., 2005). The water-level decl<strong>in</strong>es have led<br />
to <strong>in</strong>creases <strong>in</strong> streambed recharge dur<strong>in</strong>g substantial precipitation events along upstream<br />
stretches of <strong>the</strong> rivers that no longer have perennial flow.<br />
The mean annual flows of <strong>the</strong> Cimarron River have decl<strong>in</strong>ed at <strong>the</strong> current USGS gag<strong>in</strong>g<br />
stations <strong>in</strong> southwest Morton County near Elkhart <strong>and</strong> <strong>in</strong> sou<strong>the</strong>ast Meade County north<br />
of Forgan, Oklahoma (Figure 19). The flow of <strong>the</strong> river <strong>in</strong> sou<strong>the</strong>ast Meade County<br />
dur<strong>in</strong>g 2000-2002 was less than half of that dur<strong>in</strong>g 1966-1969. The decl<strong>in</strong>e <strong>in</strong> <strong>the</strong><br />
difference <strong>in</strong> <strong>the</strong> flow between southwest Morton <strong>and</strong> sou<strong>the</strong>ast Meade counties (Figure<br />
31
CIMARRON RIVER<br />
120<br />
100<br />
MEAN ANNUAL FLOW (CFS)<br />
80<br />
60<br />
40<br />
NORTH OF FORGAN<br />
NEAR ELKHART<br />
20<br />
0<br />
1960 1965 1970 1975 1980 1985 1990 1995 2000 2005<br />
DATE<br />
Figure 19. Cimarron River flows (USGS data).<br />
CIMARRON RIVER<br />
120<br />
100<br />
MEAN ANNUAL FLOW (CFS)<br />
80<br />
60<br />
40<br />
20<br />
0<br />
1960 1965 1970 1975 1980 1985 1990 1995 2000 2005<br />
DATE<br />
Figure 20. Difference between flows north of Forgan <strong>and</strong> flows near Elkhart (USGS data).<br />
32
20) represents an <strong>in</strong>crease <strong>in</strong> recharge from <strong>the</strong> river across <strong>the</strong> High Pla<strong>in</strong>s aquifer from<br />
near Elkhart downstream <strong>in</strong>to northwest Seward County <strong>and</strong> a decrease <strong>in</strong> <strong>the</strong> groundwater<br />
discharge from <strong>the</strong> aquifer to <strong>the</strong> river from northwest Seward to southwest Meade<br />
counties.<br />
The decl<strong>in</strong>e <strong>in</strong> <strong>the</strong> High Pla<strong>in</strong>s aquifer water table along <strong>the</strong> Cimarron River corridor is<br />
<strong>the</strong> ma<strong>in</strong> cause of <strong>the</strong> decrease <strong>in</strong> river flow. Gutentag et al. (1981) described substantial<br />
water-level drops <strong>in</strong> <strong>the</strong> aquifer <strong>in</strong> southwest Kansas through <strong>the</strong> 1960s to 1975. A<br />
seepage run conducted <strong>in</strong> November 1974 <strong>in</strong>dicated that <strong>the</strong> po<strong>in</strong>t where flow began <strong>in</strong><br />
<strong>the</strong> Cimarron River was approximately <strong>in</strong> <strong>the</strong> center of T. 32 S., R. 33 W., a distance of<br />
about 3-4 channel miles downstream of <strong>the</strong> beg<strong>in</strong>n<strong>in</strong>g of perennial flow on <strong>the</strong> 1968<br />
USGS topographic map. The location where <strong>the</strong> ground-water levels <strong>in</strong> <strong>the</strong> aquifer<br />
change from below to above <strong>the</strong> river channel (<strong>and</strong> thus, <strong>the</strong> start of perennial flow) has<br />
migrated ano<strong>the</strong>r 11-12 channel miles downstream from <strong>the</strong> 1974 survey to just sou<strong>the</strong>ast<br />
of <strong>the</strong> center of <strong>the</strong> county, based on KGS <strong>and</strong> DWR measurements <strong>in</strong> annual network<br />
wells with<strong>in</strong> 2.5 miles of <strong>the</strong> river (Table 3). This transition po<strong>in</strong>t is near <strong>the</strong> old town of<br />
Arkalon <strong>in</strong> <strong>the</strong> southwest part of T. 33 S., R. 32. W. McLaughl<strong>in</strong> (1942) cited data from<br />
<strong>the</strong> USGS that <strong>the</strong> mean daily discharge of <strong>the</strong> Cimarron River near Arkalon <strong>in</strong> 1938-<br />
1939 was 42.3 ft 3 /sec. Today, this is <strong>the</strong> area where <strong>the</strong> river would be expected to beg<strong>in</strong><br />
its perennial flow based on <strong>the</strong> water-level data.<br />
As <strong>in</strong>dicated <strong>in</strong> Table 3, water levels dur<strong>in</strong>g <strong>the</strong> last five years cont<strong>in</strong>ue to decl<strong>in</strong>e where<br />
<strong>the</strong> water level <strong>in</strong> <strong>the</strong> High Pla<strong>in</strong>s aquifer is below <strong>the</strong> riverbed but have not changed<br />
substantially <strong>in</strong> <strong>the</strong> area where <strong>the</strong> aquifer water levels are close to or above <strong>the</strong> riverbed.<br />
Hydrographs show<strong>in</strong>g ground-water levels <strong>in</strong> wells with<strong>in</strong> about 2.5 miles of <strong>the</strong><br />
Cimarron River are displayed <strong>in</strong> Figures 21-24. The wells are listed <strong>in</strong> order from west to<br />
east <strong>in</strong> <strong>the</strong> legends. Data were obta<strong>in</strong>ed from <strong>the</strong> KGS WIZARD database<br />
(http://www.kgs.ku.edu/Magellan/WaterLevels/<strong>in</strong>dex.html).<br />
The Morton County hydrographs (Figure 21) <strong>in</strong>dicate that ground-water levels have<br />
rema<strong>in</strong>ed largely unchanged along <strong>the</strong> river <strong>in</strong> that county, except <strong>in</strong> well 32S 39W 09DD<br />
01, which showed a decl<strong>in</strong>e of about 50 ft from <strong>the</strong> mid 1960s to <strong>the</strong> mid 1980s. This<br />
well is located <strong>in</strong> extreme eastern Morton County, essentially <strong>the</strong> only area along <strong>the</strong><br />
river <strong>in</strong> Morton County with substantial water right development (Figures 7 <strong>and</strong> 8).<br />
In Stevens County (Figure 22), substantial decl<strong>in</strong>es approach<strong>in</strong>g 150 ft are observed <strong>in</strong><br />
<strong>the</strong> wells with longest period of record (31S 37W 09BCC 01 <strong>and</strong> 31S 37W 09BBC 01).<br />
Along <strong>the</strong> river <strong>in</strong> Stevens County, this area has <strong>the</strong> largest decl<strong>in</strong>e <strong>and</strong> <strong>the</strong> largest decl<strong>in</strong>e<br />
rate (over 3 ft/yr) <strong>and</strong> is located <strong>in</strong> <strong>the</strong> area with <strong>the</strong> highest water-use density (Figure 8).<br />
The wells closest to <strong>the</strong> river tend to have <strong>the</strong> least decl<strong>in</strong>es <strong>and</strong> lowest decl<strong>in</strong>e rates,<br />
suggest<strong>in</strong>g enhanced recharge from <strong>the</strong> river when it flows. It should be noted that some<br />
stretches along <strong>the</strong> river rema<strong>in</strong> as grassl<strong>and</strong> with relatively low water use density (Figure<br />
2).<br />
33
Table 3. Elevation of water levels <strong>in</strong> DWR-KGS annual network wells <strong>and</strong> a USGS multi-level well with<strong>in</strong> 2.8 miles of <strong>the</strong> Cimarron River relative to<br />
<strong>the</strong> river channel elevation <strong>in</strong> Seward <strong>and</strong> southwestern Meade counties.<br />
L<strong>and</strong><br />
surface<br />
elevation<br />
at well<br />
River<br />
channel<br />
elevation<br />
Elevation<br />
difference<br />
between<br />
channel <strong>and</strong><br />
l<strong>and</strong><br />
surface at<br />
well<br />
Well location <strong>and</strong> ID General descriptive location<br />
Well<br />
depth<br />
ft ft<br />
Well location<br />
relative to<br />
Cimarron R ft ft ft<br />
Date of<br />
depth to<br />
water<br />
31S 34W 18BBB 01 NW corner Seward Co. 375 2951 1.9 mi to W 2778 173 252.3 1/2000 -79<br />
31S 34W 30DBA 01 NW Seward Co. 530 2946 1.9 mi to W 2759 187 251.6 1/2003 -65<br />
254.5 1/2005 -68<br />
32S 34W 10DAA 01 NW Seward Co. 350 2925.4 2.3 mi to W 2710 215 259.6 1/2003 -45<br />
263.2 1/2005 -48<br />
32S 33W 32DBD 01 NW of center Seward Co. ? 2820 1.6 mi to SW 2660 160 185.8 1/2003 -26<br />
189.2 1/2005 -29<br />
33S 33W 12AAD 01 Center of Seward Co. 140 2626 0.65 mi to W 2612 14 23.8 1/2003 -10<br />
25.2 1/2005 -11<br />
33S 32W 28CDD 02 SE of center Seward Co. 205 2630 1.0 mi to SW 2565 65 62.8 1/2003 2<br />
62.6 1/2005 2<br />
33S 31W 20ACA 01 SE Seward Co. 418 2750 2.1 mi to NE 2532 218 214.3 1/2003 4<br />
215.2 1/2005 3<br />
33S 31W 28DDB 01 SE Seward Co. ? 2720 2.5 mi to NE 2510 210 192.8 1/1998 17<br />
Depth<br />
to<br />
water<br />
34S 31W 22BDD 04* SE Seward Co. 65 2530 0.4 mi to SW 2467 63 56.0<br />
55.5<br />
56.6<br />
35S 31W 10AAC 01 SE Seward Co. 480 2680 2.8 mi to SW 2420 260 200.7<br />
201.3<br />
35S 30W 10CDA 01 SW corner of Meade Co. 260 2420 0.6 mi to NNE 2376 44 26.7<br />
25.6<br />
10/1999<br />
1/2000<br />
10/2004<br />
1/2003<br />
1/2005<br />
1/2003<br />
1/2005<br />
Elevation<br />
difference<br />
between<br />
channel <strong>and</strong><br />
water level<br />
ft<br />
* The surface elevation for <strong>the</strong> UGSS multi-level well site is listed as 2444 ft above sea level <strong>in</strong> McMahon (2000). The KGS visited <strong>the</strong> site with<br />
<strong>the</strong> USGS <strong>in</strong> 2004 to verify <strong>the</strong> location of <strong>the</strong> site <strong>and</strong> determ<strong>in</strong>ed that <strong>the</strong> surface elevation is 2530 ft. The depth to water is for <strong>the</strong> shallowest<br />
well (screened from a depth of 45 to 65 ft).<br />
7.0<br />
7.5<br />
6.4<br />
59<br />
59<br />
17<br />
18
MORTON COUNTY<br />
0<br />
50<br />
DEPTH TO WATER (FT)<br />
100<br />
150<br />
200<br />
34S 43W 07BDD 01<br />
34S 42W 05BDC 01<br />
33S 41W 33DDD 01<br />
33S 41W 21CCC 01<br />
32S 39W 09DD 01<br />
250<br />
300<br />
1940 1950 1960 1970 1980 1990 2000 2010<br />
DATE<br />
Figure 21. Hydrographs for wells with<strong>in</strong> about 2.5 miles of <strong>the</strong> Cimarron River <strong>in</strong> Morton County.<br />
STEVENS COUNTY<br />
0<br />
50<br />
DEPTH TO WATER (FT)<br />
100<br />
150<br />
200<br />
32S 39W 15BCA 01<br />
32S 39W 14DDD 01<br />
32S 39W 02BBB 01<br />
32S 38W 06ACC 01<br />
31S 38W 34BAC 01<br />
31S 38W 17CDA 01<br />
31S 37W 09BCC 01<br />
31S 37W 09BBC 01<br />
250<br />
300<br />
1940 1950 1960 1970 1980 1990 2000 2010<br />
DATE<br />
Figure 22. Hydrographs for wells with<strong>in</strong> about 2.5 miles of <strong>the</strong> Cimarron River <strong>in</strong> Stevens County.<br />
35
GRANT AND HASKELL COUNTIES<br />
0<br />
50<br />
DEPTH TO WATER (FT)<br />
100<br />
150<br />
200<br />
30S 37W 20CBC 01<br />
30S 37W 20CBC 02<br />
30S 37W 33ABC 01<br />
30S 36W 32BBC 01<br />
30S 36W 25BCB 01<br />
30S 35W 19BCD 01<br />
30S 34W 30ADD 01<br />
30S 34W 30ADD 02<br />
250<br />
300<br />
1940 1950 1960 1970 1980 1990 2000 2010<br />
DATE<br />
Figure 23. Hydrographs for wells with<strong>in</strong> about 2.5 miles of <strong>the</strong> Cimarron River <strong>in</strong> Grant <strong>and</strong><br />
Haskell counties.<br />
SEWARD AND MEADE COUNTIES<br />
0<br />
50<br />
DEPTH TO WATER (FT)<br />
100<br />
150<br />
200<br />
31S 34W 18BBB 01<br />
32S 34W 10DAA 01<br />
32S 33W 21CDB 01<br />
32S 33W 32DBD 01<br />
33S 33W 12AAD 01<br />
33S 32W 28CDD 02<br />
35S 30W 10CDA 01<br />
250<br />
300<br />
1940 1950 1960 1970 1980 1990 2000 2010<br />
DATE<br />
Figure 24. Hydrographs for wells with<strong>in</strong> about 2.5 miles of <strong>the</strong> Cimarron River <strong>in</strong> Seward <strong>and</strong><br />
Meade counties.<br />
36
Water-level decl<strong>in</strong>es <strong>in</strong> wells near <strong>the</strong> river are large <strong>and</strong> decl<strong>in</strong>e rates are similar across<br />
Grant <strong>and</strong> Haskell counties (Figure 23). Similar to Stevens County, <strong>the</strong> maximum<br />
decl<strong>in</strong>e is about 150 ft. Decl<strong>in</strong>e rates are slightly lower, approximately 3 ft/yr.<br />
Decl<strong>in</strong>es <strong>and</strong> decl<strong>in</strong>e rates decrease from west to east across Seward <strong>and</strong> <strong>in</strong>to Meade<br />
County (Figure 24). The water level <strong>in</strong> <strong>the</strong> well <strong>in</strong> <strong>the</strong> northwest corner of Seward<br />
County (31S 24W 18BBB 01) dropped over 70 ft from December 1959 to January 2000<br />
(<strong>the</strong> level <strong>in</strong> <strong>the</strong> well could not be measured after 2000 <strong>and</strong> <strong>the</strong> well was removed from<br />
<strong>the</strong> network). The water level elevation at this well <strong>in</strong> December 1958 would have been<br />
only about 8 ft below <strong>the</strong> elevation of <strong>the</strong> riverbed (Table 3). The water level <strong>in</strong> <strong>the</strong><br />
network well <strong>in</strong> southwest Meade County (35S 30W 10CDA 01), located 0.6 mile north<br />
of <strong>the</strong> river, shows a general correlation with <strong>the</strong> mean annual flow of <strong>the</strong> Cimarron River<br />
(Figure 25).<br />
CIMARRON RIVER AND NEARBY WELL<br />
20<br />
140<br />
22<br />
35S 30W 10CDA 01<br />
NORTH OF FORGAN<br />
120<br />
DEPTH TO WATER (FT)<br />
24<br />
26<br />
28<br />
30<br />
100<br />
80<br />
60<br />
40<br />
MEAN ANNUAL RIVER FLOW (CFS)<br />
32<br />
20<br />
34<br />
1960 1965 1970 1975 1980 1985 1990 1995 2000<br />
0<br />
2005<br />
DATE<br />
Figure 25. Ground-water level <strong>in</strong> well 35S 30W 10CDA 01 compared to mean annual flow <strong>in</strong> <strong>the</strong><br />
Cimarron River north of Forgan, Oklahoma (KGS <strong>and</strong> USGS data).<br />
The alluvial well <strong>in</strong> Seward County (32S 33W 21CDB 01 <strong>in</strong> Figure 24) shows very little<br />
decl<strong>in</strong>e, but <strong>the</strong> water-level record only goes through 1984. A nearby deeper well (32S<br />
33W 32DBD 01) shows a higher decl<strong>in</strong>e rate but <strong>the</strong> period of record is later. No<br />
substantial new development occurred <strong>in</strong> this area <strong>in</strong> <strong>the</strong> 1980s. It is probable that clays<br />
at <strong>the</strong> base of <strong>the</strong> alluvial aquifer provide some hydraulic separation between <strong>the</strong><br />
37
alluvium <strong>and</strong> <strong>the</strong> deeper portion of <strong>the</strong> aquifer. This scenario, along with <strong>the</strong> fact that<br />
water-level decl<strong>in</strong>es tend to be smaller <strong>in</strong> wells closer to <strong>the</strong> river, suggests that water<br />
from <strong>the</strong> river recharges <strong>the</strong> alluvium, where its vertical movement is retarded, <strong>and</strong> <strong>the</strong>n<br />
leaks <strong>in</strong>to <strong>the</strong> deeper aquifer.<br />
Sections A through D (Figures 15-18) are aligned west to east along <strong>the</strong> general direction<br />
of regional ground-water flow. Locations of <strong>the</strong> sections are shown on Figure 10. These<br />
sections display deep, steep valleys that were carved by <strong>the</strong> Cimarron River <strong>and</strong> o<strong>the</strong>r<br />
surface waterways. The valleys commonly have <strong>in</strong> excess of 200 ft of relief. Except for<br />
<strong>the</strong> valleys, <strong>the</strong> l<strong>and</strong> surface slopes fairly uniformly from west to east. The surface of <strong>the</strong><br />
predevelopment water table generally reflects <strong>the</strong> l<strong>and</strong> surface topography, which is<br />
common <strong>in</strong> unconsolidated aquifers. The surface <strong>and</strong> predevelopment water-table<br />
gradients are greater <strong>in</strong> <strong>the</strong> south -- about 12 ft/mi <strong>in</strong> Sections A <strong>and</strong> B, <strong>and</strong> about 9 ft/mi<br />
<strong>in</strong> Sections C <strong>and</strong> D. The slope of <strong>the</strong> bedrock surface, which has been subject to erosion<br />
<strong>and</strong> fault<strong>in</strong>g, is less uniform. The bedrock surface becomes shallow <strong>in</strong> <strong>the</strong> east as <strong>the</strong><br />
Crooked Creek fault zone <strong>and</strong> <strong>the</strong> eastern extent of <strong>the</strong> aquifer are approached. The fault<br />
zone is essentially co<strong>in</strong>cident with eastern extent of <strong>the</strong> aquifer <strong>in</strong> <strong>the</strong> Cimarron bas<strong>in</strong>.<br />
Ground-water pump<strong>in</strong>g has substantially lowered <strong>the</strong> 2004 water-table surface relative to<br />
<strong>the</strong> predevelopment surface. Areas of high water-level decl<strong>in</strong>es are correlated with high<br />
water-use density (Figure 8). Water-level decl<strong>in</strong>es <strong>in</strong>crease from south to north <strong>in</strong> <strong>the</strong><br />
Cimarron bas<strong>in</strong>, with <strong>the</strong> largest decl<strong>in</strong>es <strong>in</strong> Section D, reflect<strong>in</strong>g <strong>the</strong> relation to water-use<br />
density. This relationship holds with<strong>in</strong> each cross section as well. For example, large<br />
decl<strong>in</strong>es are evident <strong>in</strong> Haskell County <strong>and</strong> <strong>in</strong> <strong>the</strong> western portion of Section D. In<br />
Sections C <strong>and</strong> D, troughs are visible <strong>in</strong> <strong>the</strong> 2004 water table <strong>in</strong> sou<strong>the</strong>rn Grant/nor<strong>the</strong>rn<br />
Stevens counties <strong>and</strong> <strong>in</strong> Haskell/nor<strong>the</strong>rn Seward counties. The area with <strong>the</strong> greatest<br />
rema<strong>in</strong><strong>in</strong>g saturated thickness is <strong>in</strong> <strong>the</strong> south (Section A), but concerns about lithology<br />
(thick clays <strong>in</strong> <strong>the</strong> deeper portion of <strong>the</strong> aquifer) <strong>and</strong> water quality rema<strong>in</strong> (see<br />
Whittemore et al., 2005).<br />
CONCLUSIONS<br />
Ground-water pump<strong>in</strong>g is result<strong>in</strong>g <strong>in</strong> substantial ground-water level decl<strong>in</strong>es <strong>in</strong> portions<br />
of <strong>the</strong> Cimarron River bas<strong>in</strong>. The High Pla<strong>in</strong>s aquifer is be<strong>in</strong>g m<strong>in</strong>ed. Water-level<br />
decl<strong>in</strong>es exceed<strong>in</strong>g 150 ft, over 40 percent of <strong>the</strong> saturated thickness, have occurred along<br />
<strong>the</strong> Cimarron River; even larger decl<strong>in</strong>es have occurred elsewhere <strong>in</strong> <strong>the</strong> bas<strong>in</strong>. Areas of<br />
<strong>the</strong> largest ground-water level decl<strong>in</strong>es are correlated with high water-use density.<br />
Overall, decl<strong>in</strong>e rates along <strong>the</strong> Cimarron River corridor do not appear to be decreas<strong>in</strong>g.<br />
Ground-water level decl<strong>in</strong>es have resulted <strong>in</strong> reduced streamflows. Streamflows <strong>in</strong> <strong>the</strong><br />
Cimarron River have decl<strong>in</strong>ed, <strong>and</strong> portions of <strong>the</strong> river which previously flowed<br />
perennially now flow only <strong>in</strong>termittently. The po<strong>in</strong>t at which perennial flow beg<strong>in</strong>s <strong>in</strong><br />
Seward County has migrated downstream roughly 15 miles.<br />
Most notable <strong>in</strong> <strong>the</strong> lithologic cross section along <strong>the</strong> Cimarron River is a west-to-east<br />
transition from an abundance of f<strong>in</strong>e-gra<strong>in</strong>ed deposits to primarily coarser-gra<strong>in</strong>ed<br />
materials <strong>in</strong> extreme eastern Grant County. The shallow alluvial aquifer is variable <strong>in</strong><br />
38
thickness <strong>and</strong> composition, but is primarily composed of coarse-gra<strong>in</strong>ed sediments <strong>and</strong> is<br />
only a few tens of feet thick. While this report improves our knowledge of <strong>the</strong> lithology,<br />
more field data are necessary to improve <strong>the</strong> lithologic characterization, particularly<br />
along <strong>the</strong> alluvial valley of <strong>the</strong> Cimarron River.<br />
ACKNOWLEDGMENTS<br />
This report benefited from reviews by Susan Stover (Kansas Water Office) <strong>and</strong> Rex<br />
Buchanan (KGS). Mark Schoneweis, KGS graphic artist, assisted with graphics. Melany<br />
Miller, KGS adm<strong>in</strong>istrative assistant, assisted with f<strong>in</strong>al preparation of <strong>the</strong> report.<br />
REFERENCES<br />
Buddemeier, R.W., D.O. Whittemore, D.P. Young, B.B. Wilson, G.R. Hecox, M.A.<br />
Townsend, <strong>and</strong> P.A. Macfarlane, 2003. Data, Research, <strong>and</strong> Technical Support for<br />
Ogallala-High Pla<strong>in</strong>s Aquifer Assessment, Plann<strong>in</strong>g, <strong>and</strong> Management: An overview<br />
report of fiscal year 2003 activities by <strong>the</strong> Kansas Geological Survey supported by <strong>the</strong><br />
Ogallala Aquifer Support Study of <strong>the</strong> Kansas Water Plan. Kansas Geological Survey<br />
Open-File Report 2003-41.<br />
Byrne, F.E., <strong>and</strong> McLaughl<strong>in</strong>, T.G., 1948. Geology <strong>and</strong> ground-water resources of<br />
Seward County, Kansas. Kansas Geological Survey Bullet<strong>in</strong> 69, 140 p.<br />
Cederstr<strong>and</strong>, J.R. <strong>and</strong> M.F. Becker, 1998. Digital map of hydraulic conductivity for <strong>the</strong><br />
High Pla<strong>in</strong>s aquifer <strong>in</strong> parts on Colorado, Kansas, Nebraska, New Mexico, Oklahoma,<br />
South Dakota, Texas, <strong>and</strong> Wyom<strong>in</strong>g. USGS OFR 98-548.<br />
Fenneman, N.M., 1931. Physiography of western United States. New York, McGraw-<br />
Hill, 534 p.<br />
Frye, J.C., 1941. A prelim<strong>in</strong>ary report on <strong>the</strong> water supply of <strong>the</strong> Meade artesian bas<strong>in</strong>,<br />
Meade County, Kansas. Kansas Geological Survey Bullet<strong>in</strong> 35, 39 p.<br />
Frye, J.C., 1942. Geology <strong>and</strong> ground-water resources of Meade County, Kansas. Kansas<br />
Geological Survey Bullet<strong>in</strong> 45, 152 p.<br />
Frye, J.C., <strong>and</strong> Schoff, S.L., 1942. Deep-seated solution <strong>in</strong> <strong>the</strong> Meade bas<strong>in</strong> <strong>and</strong> vic<strong>in</strong>ity,<br />
Kansas <strong>and</strong> Oklahoma. American Geophysical Union Transactions, pt 1, pp. 35-39.<br />
Frye, J.C., 1950. Orig<strong>in</strong> of Kansas Great Pla<strong>in</strong>s depressions. Kansas Geological Survey,<br />
Bullet<strong>in</strong> 86, part 1, p. 1-20.<br />
Gutengag, E.D., F.J. Heimes, N.C. Kro<strong>the</strong>, R.R. Luckey, <strong>and</strong> J.B. Weeks, 1984.<br />
Geohydrology of <strong>the</strong> High Pla<strong>in</strong>s aquifer <strong>in</strong> parts of Colorado, Kansas, Nebraska,<br />
39
New Mexico, Oklahoma, South Dakota, Texas, <strong>and</strong> Wyom<strong>in</strong>g. US Geological<br />
Survey Professional Paper 1400-B, 63 p.<br />
Gutentag, E.D., Lobmeyer, D.H., <strong>and</strong> Slagle, S.E., 1981. Geohydrology of southwestern<br />
Kansas. Kansas Geological Survey, Irrigation Series 7, 73 p.<br />
Holdoway, K., 1978. Deposition of evaporites <strong>and</strong> red beds of <strong>the</strong> Nippewalla Group,<br />
Permian, Western Kansas. Kansas Geological Survey Bullet<strong>in</strong> 215, 43 p.<br />
Johnson, W.D., 1901. The High Pla<strong>in</strong>s <strong>and</strong> <strong>the</strong>ir utilization. US Geological Survey, 21st<br />
Annual Report, pt. 4, pp. 601-741.<br />
Kume, J., <strong>and</strong> Sp<strong>in</strong>azola, J.M., 1985. Geohydrology of s<strong>and</strong>stone aquifers <strong>in</strong><br />
southwestern Kansas. Kansas Geological Survey, Irrigation Series 8, 49 p.<br />
Macfarlane, P.A., 1993. The effect of topographic relief <strong>and</strong> hydrostratigraphy on <strong>the</strong><br />
upper part of <strong>the</strong> regional ground-water flow system, sou<strong>the</strong>astern Colorado <strong>and</strong><br />
western <strong>and</strong> central Kansas with emphasis on <strong>the</strong> Dakota aquifer. Ph.D. <strong>the</strong>sis,<br />
University of Kansas, Lawrence, KS, 197 p.<br />
Macfarlane, P.A., 2000. Revisions to <strong>the</strong> nomenclature for Kansas aquifers. Kansas<br />
Geological Survey Bullet<strong>in</strong>. 242, part 2:<br />
http://www.kgs.ku.edu/Current/2000/macfarlane/macfarlane1.html.<br />
Macfarlane, P.A., <strong>and</strong> Wilson, B.B., <strong>in</strong> review. Enhancement of <strong>the</strong> bedrock surface<br />
elevation map beneath <strong>the</strong> Ogallala portion of <strong>the</strong> high pla<strong>in</strong>s aquifer, western<br />
Kansas. Kansas Geological Survey Bullet<strong>in</strong>, 56 p.<br />
McLaughl<strong>in</strong>, T.G., 1942. Geology <strong>and</strong> ground-water resources of Morton Co, Kansas.<br />
Kansas Geological Survey Bullet<strong>in</strong> 40, 126 p.<br />
McLaughl<strong>in</strong>, T.G., 1946. Geology <strong>and</strong> ground-water resources of Grant, Haskell, <strong>and</strong><br />
Stevens counties, Kansas. Kansas Geological Survey Bullet<strong>in</strong> 61, 221 p.<br />
McMahon, P.B., 2000. Vertical gradients <strong>in</strong> water chemistry <strong>in</strong> <strong>the</strong> central High Pla<strong>in</strong>s<br />
aquifer, southwestern Kansas <strong>and</strong> Oklahoma panh<strong>and</strong>le, 1999: U.S. Geological<br />
Survey, Water-Resources Investigations Report 01–4028, 47 p.<br />
Merriam, D.F., 1963. The geologic history of Kansas. Kansas Geological Survey<br />
Bullet<strong>in</strong> 162, 317 p.<br />
O’Connor, H.G. <strong>and</strong> McCla<strong>in</strong>, T.J., 1982. Ogallala aquifer study <strong>in</strong> Kansas -<br />
geohydrology. Kansas Water Office.<br />
Smith, H.T.U., 1940. Geologic studies <strong>in</strong> southwestern Kansas. Kansas Geological<br />
Survey Bullet<strong>in</strong> 34, 212 p.<br />
40
Sophocleous, M.A., 2004. Ground-water recharge <strong>and</strong> water budgets of <strong>the</strong> Kansas High<br />
Pla<strong>in</strong>s <strong>and</strong> related aquifers. Kansas Geological Survey Bullet<strong>in</strong> 249, 102 p.<br />
Sp<strong>in</strong>azola, J.M. <strong>and</strong> M.T. Dealy, 1983. Hydrology of <strong>the</strong> Ogallala aquifer <strong>in</strong> Ford<br />
County, southwestern Kansas, US Geological Survey Water-Resources Investigations<br />
Report 83-4226, 58 p.<br />
Stullken, L.E., K.R. Watts, <strong>and</strong> R.J. L<strong>in</strong>dgren, 1985. Geohydrology of <strong>the</strong> High Pla<strong>in</strong>s aquifer,<br />
western Kansas. U.S. Geological Survey Water-resources Investigations Report 85-<br />
4198, 86 p.<br />
Sw<strong>in</strong>eford, A., 1955. Petrography of Upper Permian rocks <strong>in</strong> south-central Kansas.<br />
Kansas Geological Survey Bullet<strong>in</strong> 111, 179 p.<br />
Walters, R.F., 1978. L<strong>and</strong> subsidence <strong>in</strong> central Kansas related to salt dissolution. Kansas<br />
Geological Survey Bullet<strong>in</strong> 214, 32 p.<br />
Whittemore, D.O., E.R. Grieve, D.P. Young, <strong>and</strong> B.B. Wilson, 2005. Water quality <strong>in</strong> <strong>the</strong><br />
High Pla<strong>in</strong>s aquifer <strong>and</strong> <strong>the</strong> Cimarron River <strong>in</strong> Seward <strong>and</strong> Meade counties, Kansas.<br />
Kansas Geological Survey Open-File Report 2005-27.<br />
Wilson, B.B., D.P. Young, <strong>and</strong> R.W. Buddemeier, 2002. Explor<strong>in</strong>g relationships between<br />
water table elevations, reported water use, <strong>and</strong> aquifer lifetime as parameters for<br />
consideration <strong>in</strong> aquifer subunit del<strong>in</strong>eations. Kansas Geological Survey Open-File<br />
Report 2002-25D. A component of <strong>the</strong> Technical Report Series 2002-25: Technical<br />
Support for Ogallala Aquifer Assessment, Plann<strong>in</strong>g, <strong>and</strong> Management:<br />
http://www.kgs.ku.edu/HighPla<strong>in</strong>s/OHP/2002_25D.pdf.<br />
Woods, J.J., <strong>and</strong> Sophocleous, M.A., 2002. Set of (water availability) maps for Southwest<br />
Kansas Groundwater Management District. Kansas Geological Survey Open-File Report<br />
2002-26.<br />
Young, D. P., D. O. Whittemore, J. L. Grauer, <strong>and</strong> J. M. Whitmer, 2000. Lithologic<br />
characterization of unconsolidated deposits along <strong>the</strong> Arkansas River corridor <strong>in</strong><br />
southwest Kansas. Kansas Geological Survey Open-File Report 2000-43, 30 pp plus<br />
3 plates (geologic cross sections).<br />
41