Annual Report 2011/2012 - Colombo Stock Exchange
Annual Report 2011/2012 - Colombo Stock Exchange
Annual Report 2011/2012 - Colombo Stock Exchange
You also want an ePaper? Increase the reach of your titles
YUMPU automatically turns print PDFs into web optimized ePapers that Google loves.
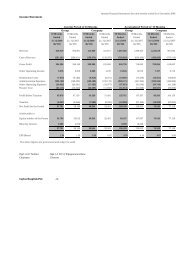
MERCANTILE SHIPPING COMPANY PLC<br />
CASH FLOW STATEMENT<br />
Year ended 31 March <strong>2012</strong><br />
Group<br />
Company<br />
Cash Flows From / (Used in) Operating Activities<br />
Note<br />
<strong>2012</strong><br />
Rs.<br />
<strong>2011</strong><br />
Rs.<br />
<strong>2012</strong><br />
Rs.<br />
<strong>2011</strong><br />
Rs.<br />
Profit/ (Loss) Before Tax<br />
(33,366,164)<br />
(28,609,925)<br />
4,364,325<br />
(14,513,491)<br />
Adjustments for<br />
Finance Income<br />
Depreciation<br />
Profit on Disposal of Property, Plant and Equipment<br />
Finance Costs<br />
Provision for Defined Benefit Plans<br />
<strong>Exchange</strong> Loss/ (Gain)<br />
Operating Profit/(Loss) before Working Capital Changes<br />
17.2<br />
17.1<br />
13<br />
(2,332,385)<br />
181,315,586<br />
(5,376,313)<br />
103,870,087<br />
120,282<br />
(8,669,195)<br />
235,561,899<br />
(1,063,483)<br />
182,731,519<br />
(2,708,333)<br />
91,075,897<br />
191,874<br />
4,533,282<br />
246,150,831<br />
(2,332,385)<br />
3,251,991<br />
(5,376,313)<br />
-<br />
60,875<br />
(1,529,075)<br />
(1,560,581)<br />
(1,056,338)<br />
3,076,852<br />
(2,708,333)<br />
-<br />
78,021<br />
1,300,672<br />
(13,822,618)<br />
(Increase)/Decrease in Inventories<br />
(Increase)/Decrease in Trade and Other Receivables<br />
Increase/(Decrease) in Trade and Other Payables<br />
Cash Generated From Operations<br />
2,502,654<br />
(711,449)<br />
7,438,819<br />
244,791,922<br />
(1,801,208)<br />
(2,067,686)<br />
(21,154,366)<br />
221,127,571<br />
-<br />
3,589,359<br />
4,861,989<br />
6,890,767<br />
-<br />
107,396,245<br />
(30,726,834)<br />
62,846,793<br />
Finance Costs Paid<br />
Defined Benefit Plan Costs Paid<br />
Income Tax Paid<br />
Net Cash From/(Used in) Operating Activities<br />
17.1<br />
13<br />
(103,870,087)<br />
-<br />
(2,596,123)<br />
140,921,835<br />
(91,075,897)<br />
(230,350)<br />
(5,631,300)<br />
124,190,023<br />
-<br />
-<br />
(2,216,574)<br />
4,674,193<br />
-<br />
(230,350)<br />
(6,184,516)<br />
56,431,927<br />
Cash Flows From / (Used in) Investing Activities<br />
Acquisition of Property, Plant and Equipment<br />
Proceeds from Disposal of Property, Plant and Equipment<br />
Investment made in Subsidiaries<br />
Finance Income Received<br />
17.2<br />
Net Cash Flows From/(Used in) Investing Activities<br />
(3,231,061)<br />
5,376,313<br />
-<br />
2,332,385<br />
4,477,637<br />
(6,090,925)<br />
2,708,333<br />
-<br />
1,063,483<br />
(2,319,109)<br />
-<br />
5,376,313<br />
-<br />
2,332,385<br />
7,708,698<br />
(6,090,950)<br />
2,708,333<br />
(125,000,000)<br />
1,056,338<br />
(127,326,279)<br />
Cash Flows From / (Used in) Financing Activities<br />
With Holding Tax Paid on Script Dividend<br />
Repayment of Interest Bearing Loans and Borrowings<br />
Net Cash Flows From/(Used in) Financing Activities<br />
12<br />
-<br />
(152,728,923)<br />
(152,728,923)<br />
(1,370,865)<br />
(177,635,428)<br />
(179,006,293)<br />
-<br />
-<br />
-<br />
(1,370,865)<br />
-<br />
(1,370,865)<br />
Effect of <strong>Exchange</strong> Rate Changes on Cash and Cash Equivalents<br />
10,038,010<br />
(4,533,282)<br />
1,529,074<br />
(1,300,672)<br />
Net Increase/(Decrease) in Cash and Cash Equivalents<br />
2,708,560<br />
(61,668,661)<br />
12,382,891<br />
(73,565,889)<br />
Cash and Cash Equivalents at the Beginning of the Year<br />
Cash and Cash Equivalents at the End of the Year<br />
117,269,577<br />
119,978,137<br />
178,938,238<br />
117,269,577<br />
47,180,822<br />
61,092,787<br />
120,746,711<br />
47,180,822<br />
Analysis of Cash and Cash Equivalents<br />
Short Term Investments<br />
Cash and Bank Balances<br />
Cash and Cash Equivalents at the End for the Purpose of Cash Flow Statement<br />
9<br />
10<br />
42,174,408<br />
77,803,729<br />
119,978,137<br />
29,878,575<br />
87,391,002<br />
117,269,577<br />
42,174,408<br />
18,918,379<br />
61,092,787<br />
29,878,575<br />
17,302,247<br />
47,180,822<br />
The Accounting Policies and Notes on pages 19 through 37 form an integral part of the Financial Statements.<br />
18


