Heavy Metals Uptake by Dried Caulerpa lentillifera - The Joint ...
Heavy Metals Uptake by Dried Caulerpa lentillifera - The Joint ...
Heavy Metals Uptake by Dried Caulerpa lentillifera - The Joint ...

You also want an ePaper? Increase the reach of your titles
YUMPU automatically turns print PDFs into web optimized ePapers that Google loves.
<strong>The</strong> 2 nd <strong>Joint</strong> International Conference on “Sustainable Energy and Environment (SEE 2006)”<br />
E-043 (P) 21-23 November 2006, Bangkok, Thailand<br />
log( q / q q ) ( k t<br />
e e<br />
−<br />
t<br />
=<br />
1<br />
) / 2.303 (3)<br />
A plot of log (q e -q t ) against t should give a straight line to confirm the applicability of the first-order kinetic model.<br />
<strong>The</strong> second model is the pseudo-second-order kinetic model [10] which is expressed as:<br />
dq<br />
t<br />
/ dt<br />
= k<br />
(4)<br />
2<br />
2<br />
( q<br />
e<br />
− qt<br />
)<br />
where k 2 (g mg -1 min -1 ) is the rate constant of second-order adsorption. Eq. (4) can be rearranged and linearized to obtain:<br />
1<br />
q<br />
t<br />
1 1<br />
= + t<br />
(5)<br />
2<br />
k q q<br />
2<br />
e<br />
e<br />
<strong>The</strong> plot t/q t versus t should give a straight line if second-order kinetics are applicable and q e and k 2 can be determined from the slope<br />
and intercept of the plot, respectively.<br />
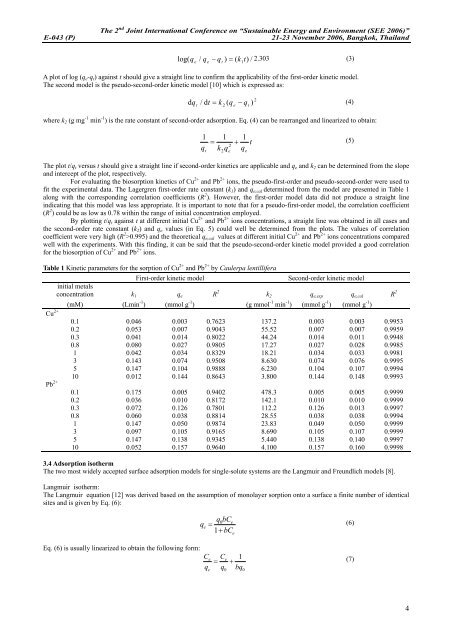
For evaluating the biosorption kinetics of Cu 2+ and Pb 2+ ions, the pseudo-first-order and pseudo-second-order were used to<br />
fit the experimental data. <strong>The</strong> Lagergren first-order rate constant (k 1 ) and q e,cal determined from the model are presented in Table 1<br />
along with the corresponding correlation coefficients (R 2 ). However, the first-order model data did not produce a straight line<br />
indicating that this model was less appropriate. It is important to note that for a pseudo-first-order model, the correlation coefficient<br />
(R 2 ) could be as low as 0.78 within the range of initial concentration employed.<br />
By plotting t/q t against t at different initial Cu 2+ and Pb 2+ ions concentrations, a straight line was obtained in all cases and<br />
the second-order rate constant (k 2 ) and q e values (in Eq. 5) could well be determined from the plots. <strong>The</strong> values of correlation<br />
coefficient were very high (R 2 >0.995) and the theoretical q e,cal values at different initial Cu 2+ and Pb 2+ ions concentrations compared<br />
well with the experiments. With this finding, it can be said that the pseudo-second-order kinetic model provided a good correlation<br />
for the biosorption of Cu 2+ and Pb 2+ ions.<br />
Table 1 Kinetic parameters for the sorption of Cu 2+ and Pb 2+ <strong>by</strong> <strong>Caulerpa</strong> <strong>lentillifera</strong><br />
First-order kinetic model<br />
Second-order kinetic model<br />
initial metals<br />
concentration k 1 q e R 2 k 2 q e,exp q e,cal R 2<br />
Cu 2+<br />
(mM) (Lmin -1 ) (mmol g -1 ) (g mmol -1 min -1 ) (mmol g -1 ) (mmol g -1 )<br />
0.1 0.046 0.003 0.7623 137.2 0.003 0.003 0.9953<br />
0.2 0.053 0.007 0.9043 55.52 0.007 0.007 0.9959<br />
0.3 0.041 0.014 0.8022 44.24 0.014 0.011 0.9948<br />
0.8 0.080 0.027 0.9805 17.27 0.027 0.028 0.9985<br />
1 0.042 0.034 0.8329 18.21 0.034 0.033 0.9981<br />
3 0.143 0.074 0.9508 8.630 0.074 0.076 0.9995<br />
5 0.147 0.104 0.9888 6.230 0.104 0.107 0.9994<br />
10 0.012 0.144 0.8643 3.800 0.144 0.148 0.9993<br />
Pb 2+ 0.1 0.175 0.005 0.9402 478.3 0.005 0.005 0.9999<br />
0.2 0.036 0.010 0.8172 142.1 0.010 0.010 0.9999<br />
0.3 0.072 0.126 0.7801 112.2 0.126 0.013 0.9997<br />
0.8 0.060 0.038 0.8814 28.55 0.038 0.038 0.9994<br />
1 0.147 0.050 0.9874 23.83 0.049 0.050 0.9999<br />
3 0.097 0.105 0.9165 8.690 0.105 0.107 0.9999<br />
5 0.147 0.138 0.9345 5.440 0.138 0.140 0.9997<br />
10 0.052 0.157 0.9640 4.100 0.157 0.160 0.9998<br />
3.4 Adsorption isotherm<br />
<strong>The</strong> two most widely accepted surface adsorption models for single-solute systems are the Langmuir and Freundlich models [8].<br />
Langmuir isotherm:<br />
<strong>The</strong> Langmuir equation [12] was derived based on the assumption of monolayer sorption onto a surface a finite number of identical<br />
sites and is given <strong>by</strong> Eq. (6):<br />
q<br />
q bC<br />
0 e<br />
e<br />
= (6)<br />
1 + bCe<br />
Eq. (6) is usually linearized to obtain the following form:<br />
Ce Ce<br />
1<br />
= +<br />
(7)<br />
q q bq<br />
e<br />
0<br />
0<br />
4