School Accountability Report Card - Modesto City Schools
School Accountability Report Card - Modesto City Schools
School Accountability Report Card - Modesto City Schools
You also want an ePaper? Increase the reach of your titles
YUMPU automatically turns print PDFs into web optimized ePapers that Google loves.
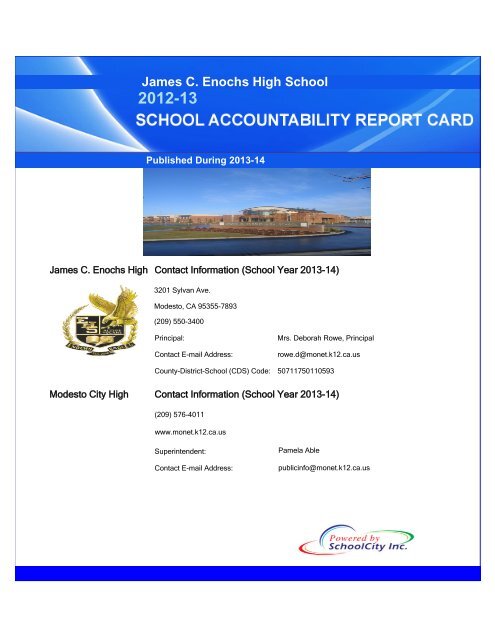
James C. Enochs High <strong>School</strong><br />
2012-13<br />
Published During 2013-14<br />
James C. Enochs High Contact Information (<strong>School</strong> Year 2013-14)<br />
3201 Sylvan Ave.<br />
<strong>Modesto</strong>, CA 95355-7893<br />
(209) 550-3400<br />
Principal:<br />
Contact E-mail Address:<br />
Mrs. Deborah Rowe, Principal<br />
rowe.d@monet.k12.ca.us<br />
County-District-<strong>School</strong> (CDS) Code: 50711750110593<br />
<strong>Modesto</strong> <strong>City</strong> High Contact Information (<strong>School</strong> Year 2013-14)<br />
(209) 576-4011<br />
www.monet.k12.ca.us<br />
Superintendent:<br />
Contact E-mail Address:<br />
Pamela Able<br />
publicinfo@monet.k12.ca.us
James C. Enochs High 2012-13<br />
<strong>School</strong> <strong>Accountability</strong> <strong>Report</strong> <strong>Card</strong><br />
Every school in California is required by state law to publish a <strong>School</strong> <strong>Accountability</strong> <strong>Report</strong> <strong>Card</strong> (SARC), by February 1 of each<br />
year. The SARC contains information about the condition and performance of each California public school.<br />
• For more information about SARC requirements, see the California Department of Education (CDE) SARC Web page at<br />
http://www.cde.ca.gov/ta/ac/sa/.<br />
• For additional information about the school, parents and community members should contact the school principal or the district<br />
office.<br />
DataQuest<br />
DataQuest is an online data tool located on the CDE DataQuest Web page at http://dq.cde.ca.gov/dataquest/ that contains<br />
additional information about this school and comparisons of the school to the district, the county, and the state. Specifically,<br />
DataQuest is a dynamic system that provides reports for accountability (e.g., state Academic Performance Index [API], federal<br />
Adequate Yearly Progress [AYP]), test data, enrollment, high school graduates, dropouts, course enrollments, staffing, and data<br />
regarding English learners.<br />
Internet Access<br />
I. Data and Access<br />
Internet access is available at public libraries and other locations that are publicly accessible (e.g., the California State Library).<br />
Access to the Internet at libraries and public locations is generally provided on a first-come, first-served basis. Other use<br />
restrictions may include the hours of operation, the length of time that a workstation may be used (depending on availability), the<br />
types of software programs available on a workstation, and the ability to print documents.<br />
Additional Information<br />
For further information regarding the data elements and terms used in the SARC see the 2012-13 Academic Performance Index<br />
<strong>Report</strong>s Information Guide located on the CDE API Web page at http://www.cde.ca.gov/ta/ac/ap/.<br />
II. About This <strong>School</strong><br />
District Contact Information (<strong>School</strong> Year 2013-14)<br />
Name<br />
<strong>Modesto</strong> <strong>City</strong> High<br />
Phone Number (209) 576-4011<br />
Web Site<br />
Superintendent<br />
E-mail Address<br />
www.monet.k12.ca.us<br />
Pamela Able<br />
publicinfo@monet.k12.ca.us<br />
CDS Code 50711750110593<br />
<strong>School</strong> Contact Information (<strong>School</strong> Year 2013-14)<br />
Name<br />
Street<br />
James C. Enochs High<br />
3201 Sylvan Ave.<br />
<strong>City</strong>, State, Zip <strong>Modesto</strong>, CA 95355-7893<br />
Phone Number (209) 550-3400<br />
Principal<br />
E-mail Address<br />
Mrs. Deborah Rowe, Principal<br />
rowe.d@monet.k12.ca.us<br />
1/29/2014 Powered by <strong>School</strong><strong>City</strong>, Inc Page 2 of 18
James C. Enochs High 2012-13<br />
<strong>School</strong> <strong>Accountability</strong> <strong>Report</strong> <strong>Card</strong><br />
<strong>School</strong> Description and Mission Statement (<strong>School</strong> Year 2012-13)<br />
James C. Enochs High school is one of seven comprehensive high schools in <strong>Modesto</strong> <strong>City</strong> <strong>School</strong>s. The remarkable campus<br />
was built on an expanse of 70-acres and opened in the fall of 2006. The majority of our 2,500 students in grades 9-12 reside in<br />
the northeast section of <strong>Modesto</strong>, the heart of California’s Central Valley. The diverse city of <strong>Modesto</strong> has a warm, friendly<br />
atmosphere and a large agricultural industry due to the fertile farmland surrounding it. In order to build the capacity of all<br />
students to think independently and solve complex problem our educational goal is to provide real world, unpredictable<br />
experiences for students within the academic process. Enochs High <strong>School</strong> students who embrace this goal will graduate from<br />
high school, pursue higher education, and become productive citizens.<br />
Vision Statement<br />
At James C. Enochs High <strong>School</strong>, we envision a learning community that challenges and nurtures students by fostering a sense<br />
of shared mission and engaging them in a rigorous, relevant, standards-based curriculum.<br />
Our vision demands that we provide innovative instruction by accomplished practitioners whose commitment to learning and<br />
student achievement encourages students to become technologically adept, lifelong learners able to think independently and<br />
solve complex problems.<br />
Our vision presupposes a community in which academics, athletics, student activities, and the arts contribute to student<br />
success.<br />
Our vision is rooted in the belief that staff and students alike must embrace the diversity of an increasingly complex world, foster<br />
mutual respect, and create a secure environment that supports student success.<br />
Expected <strong>School</strong>wide Learning Results<br />
Our students will be:<br />
o Educated in a rigorous, relevant, standards-based curriculum<br />
o Actively involved in their school and community<br />
o Goal-oriented and independent thinkers<br />
o Life-long learners and problem solvers<br />
o Engaged through technology<br />
o Socially responsible.<br />
The mascot for James C. Enochs High <strong>School</strong> is the Eagle, and the motto is Altius Volans, which in Latin means Soaring<br />
Higher. Eagles can fly to altitudes of 10,000 feet, and can soar aloft for hours, Eagles have strong vision and remain focused,<br />
avoiding all distraction. The Eagle has become the living symbol of freedom, spirit and the pursuit of excellence.<br />
Opportunities for Parental Involvement (<strong>School</strong> Year 2012-13)<br />
Parents have the opportunity to be involved both formally and informally at Enochs High <strong>School</strong>.<br />
Formal Involvement<br />
Parent Nights<br />
• Back to <strong>School</strong> Night<br />
• Open House & 8th grade Parent Night<br />
• College Information Night<br />
• Senior Information Night<br />
• Sports Information Nights<br />
• Awards Programs<br />
Parent Organizations<br />
• Eagle Foundation<br />
• Athletics Booster Club<br />
• Band Booster Club<br />
• <strong>School</strong> Site Council<br />
• Advisory Committees<br />
• Safety Committee<br />
Informal Involvement<br />
Personal Contact<br />
• Computer Access<br />
• Email<br />
• Phone<br />
• Conferences<br />
<strong>School</strong> Events<br />
• Athletic Games<br />
• Concerts<br />
• Fundraisers<br />
Parent Volunteers<br />
• Testing Proctor<br />
• Parent Patrol<br />
• Chaperones<br />
• Classroom Presentations<br />
1/29/2014 Powered by <strong>School</strong><strong>City</strong>, Inc Page 3 of 18
James C. Enochs High 2012-13<br />
<strong>School</strong> <strong>Accountability</strong> <strong>Report</strong> <strong>Card</strong><br />
Standardized Testing and <strong>Report</strong>ing Program<br />
III. Student Performance<br />
The Standardized Testing and <strong>Report</strong>ing (STAR) Program consists of several key components, including:<br />
• California Standards Tests(CSTs), which include English-language arts (ELA) and mathematics in grades two through<br />
eleven; science in grades five, eight, and nine through eleven; and history-social science in grades eight, and nine through<br />
eleven.<br />
• California Modified Assessment (CMA), an alternate assessment that is based on modified achievement standards in ELA<br />
for grades three through eleven; mathematics for grades three through seven, Algebra I, and Geometry; and science in<br />
grades five and eight, and Life Science in grade ten. The CMA is designed to assess those students whose disabilities<br />
preclude them from achieving grade-level proficiency on an assessment of the California content standards with or without<br />
accommodations.<br />
• California Alternate Performance Assessment (CAPA), includes ELA and mathematics in grades two through eleven, and<br />
science for grades five, eight, and ten. The CAPA is given to those students with significant cognitive disabilities whose<br />
disabilities prevent them from taking either the CSTs with accommodations or modifications or the CMA with<br />
accommodations.<br />
The assessments under the STAR Program show how well students are doing in relation to the state content standards. On<br />
each of these assessments, student scores are reported as performance levels.<br />
For detailed information regarding the STAR Program results for each grade and performance level, including the percent<br />
of students not tested, see the CDE STAR Results Web site at http://star.cde.ca.gov.<br />
Standardized Testing and <strong>Report</strong>ing Results for All Students – Three-Year Comparison<br />
Percent of Students Scoring at Proficient or Advanced<br />
(meeting or exceeding the state standards)<br />
Subject <strong>School</strong> District State<br />
2010-11 2011-12 2012-13 2010-11 2011-12 2012-13 2010-11 2011-12 2012-13<br />
English-Language Arts 61% 65% 67% 48% 49% 51% 54% 56% 55%<br />
Mathematics 37% 35% 32% 26% 23% 22% 49% 50% 50%<br />
Science 69% 68% 64% 52% 53% 53% 57% 60% 59%<br />
History-Social Science 67% 66% 64% 51% 49% 50% 48% 49% 49%<br />
Note: Scores are not shown when the number of students tested is ten or less, either because the number of students in<br />
this category is too small for statistical accuracy or to protect student privacy.<br />
1/29/2014 Powered by <strong>School</strong><strong>City</strong>, Inc Page 4 of 18
James C. Enochs High 2012-13<br />
<strong>School</strong> <strong>Accountability</strong> <strong>Report</strong> <strong>Card</strong><br />
Standardized Testing and <strong>Report</strong>ing Results by Student Group – Most Recent Year<br />
Group<br />
English-Language<br />
Arts<br />
California High <strong>School</strong> Exit Examination<br />
Percent of Students Scoring at Proficient or Advanced<br />
Mathematics Science History-Social<br />
Science<br />
All Students in the LEA 51% 22% 53% 50%<br />
All Students at the <strong>School</strong> 67% 32% 64% 64%<br />
Male 61% 33% 64% 68%<br />
Female 73% 31% 64% 61%<br />
Black or African American 57% 19% 46% 52%<br />
American Indian or Alaska Native N/A N/A N/A N/A<br />
Asian 76% 56% 60% 67%<br />
Filipino 86% 52% 86% 76%<br />
Hispanic or Latino 59% 25% 58% 57%<br />
Native Hawaiian or Pacific Islander N/A N/A N/A N/A<br />
White 74% 35% 73% 72%<br />
Two or More Races 64% 27% 60% 65%<br />
Socioeconomically Disadvantaged 58% 25% 55% 54%<br />
English Learners 18% 18% 25% 22%<br />
Students with Disabilities 31% 12% 20% 13%<br />
Students Receiving Migrant Education<br />
Services<br />
N/A N/A N/A N/A<br />
Note: Scores are not shown when the number of students tested is ten or less, either because the number of students in<br />
this category is too small for statistical accuracy or to protect student privacy.<br />
The California High <strong>School</strong> Exit Examination (CAHSEE) is primarily used as a graduation requirement. However, the grade<br />
ten results of this exam are also used to establish the percentages of students at three proficiency levels (not proficient,<br />
proficient, or advanced) in ELA and mathematics to compute AYP designations required by the federal Elementary and<br />
Secondary Education Act (ESEA), also known as No Child Left Behind (NCLB).<br />
For detailed information regarding CAHSEE results, see the CDE CAHSEE Web site at http://cahsee.cde.ca.gov/.<br />
California High <strong>School</strong> Exit Examination Results for All Grade Ten Students – Three-Year<br />
Comparison (if applicable)<br />
Percent of Students Scoring at Proficient or Advanced<br />
Subject <strong>School</strong> District State<br />
2010-11 2011-12 2012-13 2010-11 2011-12 2012-13 2010-11 2011-12 2012-13<br />
English-Language Arts 68% 60% 64% 56% 49% 52% 59% 56% 57%<br />
Mathematics 69% 69% 69% 56% 55% 53% 56% 58% 60%<br />
Note: Scores are not shown when the number of students tested is ten or less, either because the number of students in this<br />
category is too small for statistical accuracy or to protect student privacy.<br />
1/29/2014 Powered by <strong>School</strong><strong>City</strong>, Inc Page 5 of 18
James C. Enochs High 2012-13<br />
<strong>School</strong> <strong>Accountability</strong> <strong>Report</strong> <strong>Card</strong><br />
California High <strong>School</strong> Exit Examination Grade Ten Results by Student Group – Most Recent<br />
Year (if applicable)<br />
Note: Scores are not shown when the number of students tested is ten or less, either because the number of students in this<br />
category is too small for statistical accuracy or to protect student privacy.<br />
Group English-Language Arts Mathematics<br />
Not Proficient Proficient Advanced Not Proficient Proficient Advanced<br />
All Students in the LEA 48% 25% 27% 47% 35% 18%<br />
All Students at the <strong>School</strong> 36% 28% 36% 31% 44% 25%<br />
Male 44% 29% 27% 32% 43% 25%<br />
Female 28% 28% 45% 30% 46% 25%<br />
Black or African American 69% 6% 25% 56% 31% 13%<br />
American Indian or Alaska Native N/A N/A N/A N/A N/A N/A<br />
Asian 34% 40% 26% 23% 26% 51%<br />
Filipino 27% 33% 40% 7% 47% 47%<br />
Hispanic or Latino 42% 25% 33% 39% 42% 19%<br />
Native Hawaiian or Pacific<br />
Islander<br />
N/A N/A N/A N/A N/A N/A<br />
White 26% 32% 41% 22% 52% 26%<br />
Two or More Races 36% 25% 39% 32% 43% 25%<br />
Socioeconomically Disadvantaged 49% 25% 26% 44% 38% 18%<br />
English Learners 88% 12% N/A 71% 21% 9%<br />
Students with Disabilities 89% 11% N/A 74% 23% 2%<br />
Students Receiving Migrant<br />
Education Services<br />
N/A N/A N/A N/A N/A N/A<br />
California Physical Fitness Test Results (<strong>School</strong> Year 2012-13)<br />
The California Physical Fitness Test (PFT) is administered to students in grades five, seven, and nine only. This table displays<br />
by grade level the percent of students meeting the fitness standards for the most recent testing period. For detailed information<br />
regarding this test, and comparisons of a school’s test results to the district and state, see the CDE PFT Web page at<br />
http://www.cde.ca.gov/ta/tg/pf/.<br />
Grade Level<br />
Percent of Students<br />
Meeting Four of Six<br />
Fitness Standards<br />
Percent of Students<br />
Meeting Five of Six<br />
Fitness Standards<br />
Percent of Students<br />
Meeting Six of Six<br />
Fitness Standards<br />
5 N/A N/A N/A<br />
7 N/A N/A N/A<br />
9 22.7% 23.1% 36.4%<br />
Note: Scores are not shown when the number of students tested is ten or less, either because the number of students in this<br />
category is too small for statistical accuracy or to protect student privacy.<br />
Academic Performance Index<br />
IV. <strong>Accountability</strong><br />
The Academic Performance Index (API) is an annual measure of state academic performance and progress of schools in<br />
California. API scores range from 200 to 1,000, with a statewide target of 800. For detailed information about the API, see the<br />
CDE API Web page at http://www.cde.ca.gov/ta/ac/ap/.<br />
1/29/2014 Powered by <strong>School</strong><strong>City</strong>, Inc Page 6 of 18
James C. Enochs High 2012-13<br />
<strong>School</strong> <strong>Accountability</strong> <strong>Report</strong> <strong>Card</strong><br />
Academic Performance Index Ranks – Three-Year Comparison<br />
This table displays the school's statewide and similar schools' API ranks. The statewide API rank ranges from 1 to 10. A<br />
statewide rank of 1 means that the school has an API score in the lowest ten percent of all schools in the state, while a<br />
statewide rank of 10 means that the school has an API score in the highest ten percent of all schools in the state.<br />
The similar schools API rank reflects how a school compares to 100 statistically matched "similar schools." A similar<br />
schools rank of 1 means that the school's academic performance is comparable to the lowest performing ten schools of the<br />
100 similar schools, while a similar schools rank of 10 means that the school's academic performance is better than at least<br />
90 of the 100 similar schools.<br />
API Rank 2010 2011 2012<br />
Statewide 8 8 8<br />
Similar <strong>School</strong>s 10 9 8<br />
Academic Performance Index Growth by Student Group – Three-Year Comparison<br />
Group<br />
Actual API Change<br />
2010-11<br />
Actual API Change<br />
2011-12<br />
Actual API Change<br />
2012-13<br />
All Students at the <strong>School</strong> 6 6 -3<br />
Black or African American 22<br />
American Indian or Alaska Native<br />
Asian<br />
Filipino<br />
Hispanic or Latino 10 -2 9<br />
Native Hawaiian or Pacific Islander<br />
White 0 10 -6<br />
Two or More Races -13<br />
Socioeconomically Disadvantaged 25 0 -2<br />
English Learners -9 -10 -1<br />
Students with Disabilities 22 15 26<br />
Note: 'N/D' means that no data were available to the CDE or LEA to report. 'B' means the school did not have a valid API<br />
Base and there is no Growth or target information. 'C' means the school had significant demographic changes and there<br />
is no Growth or target information.<br />
Academic Performance Index Growth by Student Group - 2013 Growth API Comparison<br />
This table displays, by student group, the number of students included in the API and the 2013 Growth API at the school,<br />
LEA, and state level.<br />
Group <strong>School</strong> Growth API LEA Growth API State Growth<br />
API<br />
All Students at the <strong>School</strong> 1,786 821 10,102 756 4,655,989 790<br />
Black or African American 73 737 394 681 296,463 708<br />
American Indian or Alaska Native 7 48 714 30,394 743<br />
Asian 111 851 589 809 406,527 906<br />
Filipino 59 888 136 879 121,054 867<br />
Hispanic or Latino 632 797 5,090 725 2,438,951 744<br />
Native Hawaiian or Pacific Islander 15 858 107 756 25,351 774<br />
White 737 840 3,073 797 1,200,127 853<br />
Two or More Races 134 828 531 786 125,025 824<br />
Socioeconomically Disadvantaged 707 779 5,996 715 2,774,640 743<br />
English Learners 213 730 2,512 656 1,482,316 721<br />
Students with Disabilities 139 578 1,125 526 527,476 615<br />
1/29/2014 Powered by <strong>School</strong><strong>City</strong>, Inc Page 7 of 18
James C. Enochs High 2012-13<br />
<strong>School</strong> <strong>Accountability</strong> <strong>Report</strong> <strong>Card</strong><br />
Adequate Yearly Progress<br />
The federal ESEA requires that all schools and districts meet the following Adequate Yearly Progress (AYP) criteria:<br />
• Participation rate on the state’s standards-based assessments in ELA and mathematics<br />
• Percent proficient on the state’s standards-based assessments in ELA and mathematics<br />
• API as an additional indicator<br />
• Graduation rate (for secondary schools)<br />
For detailed information about AYP, including participation rates and percent proficient results by student group, see the CDE<br />
AYP Web page at http://www.cde.ca.gov/ta/ac/ay/.<br />
Adequate Yearly Progress Overall and by Criteria (<strong>School</strong> Year 2012-13)<br />
AYP Criteria <strong>School</strong> District<br />
Overall No No<br />
Participation Rate - English-Language Arts Yes No<br />
Participation Rate - Mathematics Yes No<br />
Percent Proficient - English-Language Arts Yes No<br />
Percent Proficient - Mathematics No No<br />
API Yes Yes<br />
Graduation Rate No Yes<br />
Federal Intervention Program (<strong>School</strong> Year 2013-14)<br />
<strong>School</strong>s and districts receiving federal Title I funding enter Program Improvement (PI) if they do not make AYP for two<br />
consecutive years in the same content area (ELA or mathematics) or on the same indicator (API or graduation rate). After<br />
entering PI, schools and districts advance to the next level of intervention with each additional year that they do not make<br />
AYP. For detailed information about PI identification, see the CDE PI Status Determinations Web page:<br />
http://www.cde.ca.gov/ta/ac/ay/tidetermine.asp.<br />
Program Improvement Status<br />
Indicator <strong>School</strong> District<br />
First Year of Program Improvement 2004-2005<br />
Year in Program Improvement Year 3<br />
Number of <strong>School</strong>s Currently in Program Improvement N/A 5<br />
Percent of <strong>School</strong>s Currently in Program Improvement N/A 100%<br />
V. <strong>School</strong> Climate<br />
Student Enrollment by Grade Level (<strong>School</strong> Year 2012-13)<br />
In PI<br />
Grade Level<br />
Number of Students<br />
Grade 9 657<br />
Grade 10 630<br />
Grade 11 628<br />
Grade 12 561<br />
Total Enrollment 2476<br />
Student Enrollment by Student Group (<strong>School</strong> Year 2012-13)<br />
1/29/2014 Powered by <strong>School</strong><strong>City</strong>, Inc Page 8 of 18
James C. Enochs High 2012-13<br />
<strong>School</strong> <strong>Accountability</strong> <strong>Report</strong> <strong>Card</strong><br />
Group<br />
Percent of Total Enrollment<br />
Black or African American 4.1<br />
American Indian or Alaska Native 0.5<br />
Asian 5.7<br />
Filipino 3<br />
Hispanic or Latino 36<br />
Native Hawaiian/Pacific Islander 1<br />
White 39.8<br />
Two or More Races 6.3<br />
Socioeconomically Disadvantaged 38.6<br />
English Learners 11.5<br />
Students with Disabilities 8.9<br />
Average Class Size and Class Size Distribution (Secondary)<br />
Subject<br />
Avg. Class<br />
Size<br />
2010-11<br />
Number of Classes*<br />
Avg. Class<br />
Size<br />
2011-12<br />
Number of Classes*<br />
Avg. Class<br />
Size<br />
2012-13<br />
Number of Classes*<br />
1-22 23-32 33+ 1-22 23-32 33+ 1-22 23-32 33+<br />
English 30.7 23 11 56 29.2 23 12 46 22 50 12 56<br />
Mathematics 32.7 14 7 56 29.7 15 19 44 24 39 17 52<br />
Science 35.1 3 4 43 34.2 4 5 36 28 17 6 44<br />
Social Science 34.4 5 4 49 29.9 12 11 40 23 36 9 51<br />
* Number of classes indicates how many classrooms fall into each size category (a range of total students per classroom). At<br />
the secondary school level, this information is reported by subject area rather than grade level.<br />
<strong>School</strong> Safety Plan (<strong>School</strong> Year 2012-13)<br />
The Enochs High <strong>School</strong> Safety Plan is a comprehensive document the purpose of which is to outline protocols, plans, and<br />
procedures in place to ensure the maintenance of a safe and harmonious school environment. The plan is updated annually,<br />
reviewed with the Site Safety Committee and submitted to <strong>Modesto</strong> <strong>City</strong> <strong>School</strong>s for review. One important component of the<br />
plan is routine drills to refine procedures and ensure readiness on the part of staff and students.<br />
Our Site Safety Plan identifies a number of events for which we hold practice drills. They are:<br />
1. Fire<br />
2. Emergency lockdown<br />
3. Emergency school wide evacuation<br />
In the event that such an emergency occurs, the Principal or his designee implements emergency protocols.<br />
Suspensions and Expulsions<br />
Rate*<br />
<strong>School</strong><br />
2010-11<br />
<strong>School</strong><br />
2011-12<br />
<strong>School</strong><br />
2012-13<br />
District<br />
2010-11<br />
District<br />
2011-12<br />
District<br />
2012-13<br />
Suspensions 11.12 8.8 4.9 23.01 20.46 16.29<br />
Expulsions 0.47 0.16 0.16 1.34 0.61 0.37<br />
* The rate of suspensions and expulsions is calculated by dividing the total number of incidents by the total enrollment.<br />
1/29/2014 Powered by <strong>School</strong><strong>City</strong>, Inc Page 9 of 18
James C. Enochs High 2012-13<br />
<strong>School</strong> <strong>Accountability</strong> <strong>Report</strong> <strong>Card</strong><br />
VI. <strong>School</strong> Facilities<br />
<strong>School</strong> Facility Conditions and Planned Improvements (<strong>School</strong> Year 2013-14)<br />
<strong>School</strong> Facility Conditions -- General Information<br />
The district takes great efforts to ensure that all schools are clean, safe, and functional. To assist in this effort, the district<br />
uses a facility survey instrument developed by the State of California Office of Public <strong>School</strong> Construction. The results of this<br />
survey are included within this report. The results of this survey are available at the district office and on the internet at<br />
mcs4kids.com.<br />
The campus master plan accommodates 2,500 students. The site incorporates 70 acres and contains 277,000 square feet of<br />
building space including three two-story academic buildings. Also on the site there is a large gymnasium with two<br />
locker/shower facilities linked by covered walkways. A library/media center, a cafeteria/multi-use facility, and buildings<br />
housing industrial technology, home economics, and performing arts round out the major site facilities. The spacious center<br />
courtyard includes eating areas and an amphitheater. The site includes a full complement of sports venues, including<br />
baseball, softball, soccer, practice football field, track, tennis and basketball. The <strong>City</strong> of <strong>Modesto</strong> has begun the first phase of<br />
the soccer complex at Mary Grogan Park, the park is adjacent to Enochs on the east and will have six soccer fields, several<br />
with synthetic turf, and the entire complex will be lighted. Other features will include a 300+ space parking lot, concession<br />
area, restrooms and miles of walking paths around the park. The park's second phase is not scheduled but plans include a<br />
play area for children, an aquatic feature and a neighborhood center.<br />
Below is more specific information on the condition of the school and the efforts made to ensure that students are provided<br />
with a clean, safe, and functional learning environment.<br />
Age of <strong>School</strong>/Buildings:<br />
This school has 96 classrooms, a cafeteria, gym, locker room, library, auditorium, pool, stadium and an administration office.<br />
The main campus was built in 2006. The school opened in 2006.<br />
Maintenance and Repair:<br />
District maintenance staff ensures that the repairs necessary to keep the school in good repair and working order are<br />
completed in a timely manner. A work order process is used to ensure efficient service. Emergency repairs are given the<br />
highest priority. The school facility is in overall good repair.<br />
Cleaning Process and Schedule:<br />
The district governing board has adopted cleaning standards for all schools in the district. A summary of these standards are<br />
available at the school office, or at the district office. The Principal works continually with the custodial staff to develop<br />
cleaning schedules to ensure a clean and safe school.<br />
Deferred Maintenance Budget:<br />
The District participates in the State <strong>School</strong> Deferred Maintenance Program, which provides flexible state matching funds to<br />
assist school districts with expenditures for major repair or replacement of existing school facilities components, however, the<br />
District has elected not to pass through the state contribution this year and has retained this funding with the District General<br />
Fund. Deferred Maintenance typically includes paving, roofing, plumbing, heating, air conditioning, electrical systems,<br />
interior or exterior painting, and floor systems. For the 2013-14 school year, the district has budgeted $1.4 million in carryover<br />
funds for deferred maintenance projects throughout the District. This amount is 0.94% of the district’s original adopted<br />
unrestricted general fund expenditures budget. The district’s complete deferred maintenance plan is available at the district<br />
office. Identified needed repairs are weighed against all other District site repairs and the most urgent repairs are addressed<br />
first.<br />
Data provided by LEA. Additional information about the condition of the school's facilities may be obtained by speaking with<br />
the school principal.<br />
<strong>School</strong> Facility Good Repair Status (<strong>School</strong> Year 2013-14)<br />
Using the most recent FIT data (or equivalent), provide the following:<br />
• Determination of repair status for systems listed<br />
• Description of any needed maintenance to ensure good repair<br />
• The year and month in which the data were collected<br />
• The Overall Rating<br />
1/29/2014 Powered by <strong>School</strong><strong>City</strong>, Inc Page 10 of 18
James C. Enochs High 2012-13<br />
<strong>School</strong> <strong>Accountability</strong> <strong>Report</strong> <strong>Card</strong><br />
System Inspected Good Fair Poor<br />
Systems: Gas Leaks, Mechanical/HVAC,<br />
Sewer<br />
Interior: Interior Surfaces<br />
Cleanliness: Overall Cleanliness, Pest/<br />
Vermin Infestation<br />
Electrical: Electrical<br />
Restrooms/Fountains: Restrooms, Sinks/<br />
Fountains<br />
Safety: Fire Safety, Hazardous Materials<br />
Structural: Structural Damage, Roofs<br />
Repair Needed and Action Taken or Planned<br />
External: Playground/<strong>School</strong> Grounds,<br />
Windows/ Doors/Gates/Fences<br />
Overall Facility Rate (<strong>School</strong> Year 2013-14)<br />
gopher problem, field leveling.<br />
Overall Rating<br />
Exemplary Good Fair Poor<br />
1/29/2014 Powered by <strong>School</strong><strong>City</strong>, Inc Page 11 of 18
James C. Enochs High 2012-13<br />
<strong>School</strong> <strong>Accountability</strong> <strong>Report</strong> <strong>Card</strong><br />
VII. Teachers<br />
Teacher Credentials<br />
Teachers<br />
<strong>School</strong><br />
2010-11<br />
<strong>School</strong><br />
2011-12<br />
<strong>School</strong><br />
2012-13<br />
District<br />
2012-13<br />
Teachers with Full Credential 107 97 78 516<br />
Teachers without Full Credential 1 0 0 0<br />
Teachers Teaching Outside Subject Area of Competence 13 1 0 n/a<br />
Teacher Misassignments and Vacant Teacher Positions<br />
Indicator 2011-12 2012-13 2013-14<br />
Misassignments of Teachers of English Learners 0 0 0<br />
Total Teacher Misassignments 0 0 0<br />
Vacant Teacher Positions 4 0 0<br />
Note: "Misassignments" refers to the number of positions filled by teachers who lack legal authorization to teach that grade<br />
level, subject area, student group, etc.<br />
* Total Teacher Misassignments includes the number of Misassignments of Teachers of English Learners.<br />
Core Academic Classes Taught by Highly Qualified Teachers (<strong>School</strong> Year 2012-13)<br />
The federal ESEA, also known as NCLB, requires that core academic subjects be taught by Highly Qualified Teachers,<br />
defined as having at least a bachelor’s degree, an appropriate California teaching credential, and demonstrated core<br />
academic subject area competence. For more information, see the CDE Improving Teacher and Principal Quality Web page<br />
at http://www.cde.ca.gov/nclb/sr/tq/.<br />
Location of Classes<br />
Percent of Classes In Core<br />
Academic Subjects<br />
Taught by<br />
Highly Qualified Teachers<br />
Percent of Classes In Core<br />
Academic Subjects<br />
Not Taught by<br />
Highly Qualified Teachers<br />
This <strong>School</strong> 99 1<br />
All <strong>School</strong>s in District 99 1<br />
High-Poverty <strong>School</strong>s in District 99 1<br />
Low-Poverty <strong>School</strong>s in District<br />
Note: High-poverty schools are defined as those schools with student eligibility of approximately 40 percent or more in the<br />
free and reduced price meals program. Low-poverty schools are those with student eligibility of approximately 39 percent or<br />
less in the free and reduced price meals program.<br />
1/29/2014 Powered by <strong>School</strong><strong>City</strong>, Inc Page 12 of 18
James C. Enochs High 2012-13<br />
<strong>School</strong> <strong>Accountability</strong> <strong>Report</strong> <strong>Card</strong><br />
VIII. Support Staff<br />
Academic Counselors and Other Support Staff (<strong>School</strong> Year 2012-13)<br />
Title<br />
Number of FTE*<br />
Assigned to <strong>School</strong><br />
Average Number of Students per<br />
Academic Counselor<br />
Academic Counselor 5.6 750<br />
Counselor (Social/Behavioral or Career<br />
Development<br />
Library Media Teacher (Librarian) 1 N/A<br />
Library Media Services Staff (Paraprofessional)<br />
Psychologist 1 N/A<br />
Social Worker<br />
Nurse 0.5 N/A<br />
Speech/Language/Hearing Specialist 0.2 N/A<br />
Resource Specialist (non - teaching) 5 N/A<br />
Other<br />
Note: Cells shaded in black or with N/A values do not require data.<br />
* One Full Time Equivalent (FTE) equals one staff member working full time; one FTE could also represent two staff<br />
members who each work 50 percent of full time.<br />
IX. Curriculum and Instructional Materials<br />
Quality, Currency, Availability of Textbooks and Instructional Materials (<strong>School</strong> Year 2013-14)<br />
This section describes whether the textbooks and instructional materials used at the school are from the most recent<br />
adoption; whether there are sufficient textbooks and instruction materials for each student; and information about the school’s<br />
use of any supplemental curriculum or non-adopted textbooks or instructional materials.<br />
Month and year in which data were collected: January 2013<br />
N/A<br />
N/A<br />
N/A<br />
N/A<br />
Core Curriculum Area<br />
Reading/Language Arts<br />
Textbooks and instructional<br />
materials/year of adoption<br />
Grades 7-8: Holt, 2004<br />
Grades 9-10: Holt, 2005<br />
Grades 11-12: Holt, 2006<br />
From most recent adoption?<br />
Percent students<br />
lacking own assigned<br />
copy<br />
Yes 0%<br />
Mathematics<br />
Grades 7-8: Holt, 2008<br />
Algebra: Holt, 2008<br />
Geometry: Holt, 2008<br />
Algebra II: Holt, 2008<br />
Pre-Calculus: Holt, 2008<br />
Calculus: Pearson/Prentice<br />
Hall, 2008<br />
AP Statistics:<br />
Pearson/Prentice Hall, 2008<br />
Yes 0%<br />
1/29/2014 Powered by <strong>School</strong><strong>City</strong>, Inc Page 13 of 18
James C. Enochs High 2012-13<br />
<strong>School</strong> <strong>Accountability</strong> <strong>Report</strong> <strong>Card</strong><br />
Science<br />
Core Curriculum Area<br />
Textbooks and instructional<br />
materials/year of adoption<br />
Grades 7-8: Glencoe, 2007<br />
Adv. Biology: Glencoe,<br />
2007<br />
AP Biology/IB Biology: On<br />
Hold<br />
AP Chemistry: McDougal-<br />
Littell<br />
AP/IB Environmental Sci:<br />
Thomson, 2007<br />
AP Physics: Thomson,<br />
2007<br />
Biology/CP Biolgy/Int. Ag<br />
Science 3-4: McDougal-<br />
Littell<br />
Bio. Horticulture: Thomson,<br />
2007<br />
Chemistry/CP,<br />
Chemistry/Pre-AP,<br />
Chemistry/Pre-IB, &<br />
Chemistry: Holt, 2007<br />
Earth Science/Int. Ag.<br />
Science 1-2: Holt, 2007<br />
Human Anatomy &<br />
Physiology: Pearson, 2007<br />
IB/SL Chemistry: Glencoe,<br />
2007<br />
Forensics/Biotech 1-2/Int.<br />
Science 1: Glencoe, 2007<br />
Forensics/Biotech3-4/Int.<br />
Science 3: Pearson, 2007<br />
Integrated Science 4: Holt,<br />
2007<br />
Physics: Holt, 2007<br />
Pre-AP Biology: Pearson,<br />
2007<br />
Pre-AP/Pre-IB Physics:<br />
CPO Science, 2007<br />
From most recent adoption?<br />
Percent students<br />
lacking own assigned<br />
copy<br />
Yes 0%<br />
History-Social Science<br />
Grades 7-8: McDougal<br />
Littell, 2006<br />
Wld Religion/Geo: Prentice<br />
Hall, 2006<br />
Wld History: Prentice Hall,<br />
2006<br />
US History: McDougal<br />
Littell, 2006<br />
Gov. Econ: Prentice Hall,<br />
2006<br />
Yes 0%<br />
1/29/2014 Powered by <strong>School</strong><strong>City</strong>, Inc Page 14 of 18
James C. Enochs High 2012-13<br />
<strong>School</strong> <strong>Accountability</strong> <strong>Report</strong> <strong>Card</strong><br />
Core Curriculum Area<br />
Foreign Language<br />
Textbooks and instructional<br />
materials/year of adoption<br />
Spanish 1, 2, 3, 4: Prentice<br />
Hall, 2007<br />
French 1, 2, 3, 4:<br />
McDougal Littell, 2007<br />
Spanish for Spanish<br />
Speakers 3: Holt, 2007<br />
Spanish for Spanish<br />
Speakers 4, 5, 6: Holt;<br />
Prentice Hall, 2007<br />
German 1, 2, 3: Holt, 2007<br />
AP Spanish: Prentice Hall;<br />
Glencoe, 2007<br />
From most recent adoption?<br />
Percent students<br />
lacking own assigned<br />
copy<br />
Yes 0%<br />
Health Health, Glencoe, 2005 Yes 0%<br />
Science Laboratory Equipment<br />
(grades 9-12)<br />
Yes 0%<br />
Visual and Performing Arts Yes 0%<br />
1/29/2014 Powered by <strong>School</strong><strong>City</strong>, Inc Page 15 of 18
James C. Enochs High 2012-13<br />
<strong>School</strong> <strong>Accountability</strong> <strong>Report</strong> <strong>Card</strong><br />
X. <strong>School</strong> Finances<br />
Expenditures Per Pupil and <strong>School</strong> Site Teacher Salaries (Fiscal Year 2011-12)<br />
Level<br />
Total<br />
Expenditures Per<br />
Pupil<br />
Types of Services Funded (Fiscal Year 2012-13)<br />
Teacher and Administrative Salaries (Fiscal Year 2011-12)<br />
Expenditures Per<br />
Pupil (Supplemental /<br />
Restricted)<br />
Expenditures Per<br />
Pupil (Basic/<br />
Unrestricted)<br />
All students benefit from the district's emphasis on maintaining outstanding libraries. Students<br />
living a qualifying distance are provided transportation to and from their school. Special education<br />
students, gifted and talented students, and English learners receive appropriate educational services.<br />
Programs are funded through a combination of local, state and federal resources.<br />
Average Teacher<br />
Salary<br />
<strong>School</strong> Site $7,410 $1,957 $5,453 $82,310<br />
District N/A N/A $5,583 $76,463<br />
Percent Difference – <strong>School</strong> Site and District N/A N/A -2.33 7.65<br />
State N/A N/A $5,537 N/A<br />
Percent Difference – <strong>School</strong> Site and State N/A N/A -1.52 N/A<br />
Note: Cells shaded in black or with N/A values do not require data.<br />
Supplemental/Restricted expenditures come from money whose use is controlled by law or by a donor. Money that is<br />
designated for specific purposes by the district or governing board is not considered restricted. Basic/unrestricted<br />
expenditures are from money whose use, except for general guidelines, is not controlled by law or by a donor.<br />
For detailed information on school expenditures for all districts in California, see the CDE Current Expense of Education &<br />
Per-pupil Spending Web page at http://www.cde.ca.gov/ds/fd/ec/. For information on teacher salaries for all districts in<br />
California, see the CDE Certificated Salaries & Benefits Web page at http://www.cde.ca.gov/ds/fd/cs/. To look up<br />
expenditures and salaries for a specific school district, see the Ed-Data Web site at: http://www.ed-data.org.<br />
Category<br />
District Amount<br />
State Average For Districts In<br />
Same Category<br />
Beginning Teacher Salary $49,283 $35,288<br />
Mid-Range Teacher Salary $70,199 $63,569<br />
Highest Teacher Salary $91,849 $91,849<br />
Average Principal Salary (Elementary) $102,556 $98,325<br />
Average Principal Salary (Middle) $103,026 $102,745<br />
Average Principal Salary (High) $118,026 $110,360<br />
Superintendent Salary $225,000 $170,518<br />
Percent of Budget for Teacher Salaries 44.03% 39%<br />
Percent of Budget for Administrative Salaries 6.05% 5%<br />
For detailed information on salaries, see the CDE Certificated Salaries & Benefits Web page at<br />
http://www.cde.ca.gov/ds/fd/cs/.<br />
Admission Requirements for California's Public Universities<br />
University of California<br />
XI. <strong>School</strong> Completion and Postsecondary Preparation<br />
1/29/2014 Powered by <strong>School</strong><strong>City</strong>, Inc Page 16 of 18
James C. Enochs High 2012-13<br />
<strong>School</strong> <strong>Accountability</strong> <strong>Report</strong> <strong>Card</strong><br />
Admission requirements for the University of California (UC) follow guidelines set forth in the Master Plan, which requires<br />
that the top one-eighth of the state’s high school graduates, as well as those transfer students who have successfully<br />
completed specified college work, be eligible for admission to the UC. These requirements are designed to ensure that all<br />
eligible students are adequately prepared for University-level work.<br />
For general admissions requirements, please visit the UC Admissions Information Web page at<br />
http://www.universityofcalifornia.edu/admissions/.<br />
California State University<br />
Eligibility for admission to the California State University (CSU) is determined by three factors:<br />
• Specific high school courses<br />
• Grades in specified courses and test scores<br />
• Graduation from high school<br />
Some campuses have higher standards for particular majors or students who live outside the local campus area.<br />
Because of the number of students who apply, a few campuses have higher standards (supplementary admission<br />
criteria) for all applicants. Most CSU campuses have local admission guarantee policies for students who graduate or<br />
transfer from high schools and colleges that are historically served by a CSU campus in that region. For admission,<br />
application, and fee information see the CSU Web page at http://www.calstate.edu/admission/admission.shtml.<br />
Dropout Rate and Graduation Rate<br />
Indicator <strong>School</strong> District State<br />
2009-10 2010-11 2011-12 2009-10 2010-11 2011-12 2009-10 2010-11 2011-12<br />
Dropout Rate 8.4 6.3 5.4 20.3 17.9 15.5 16.6 14.7 13.1<br />
Graduation Rate 88.93 90.97 90.78 75.06 76.28 78.26 74.77 77.14 78.73<br />
Completion of High <strong>School</strong> Graduation Requirements<br />
This table displays, by student group, the number of students who were a part of the school’s most recent graduating<br />
class for which CDE has available data and meet all state and local graduation requirements for grade twelve<br />
completion, including having passed both the ELA and mathematics portions of the CAHSEE or received a local waiver<br />
or state exemption.<br />
Graduating Class of 2012<br />
Group <strong>School</strong> District State<br />
All Students 602 2,994 418,598<br />
Black or African American 117 234 28,078<br />
American Indian or Alaska Native 101 87 3,123<br />
Asian 121 286 41,700<br />
Filipino 17 49 12,745<br />
Hispanic or Latino 244 1,394 193,516<br />
Native Hawaiian/Pacific Islander 97 136 2,585<br />
White 343 1,181 127,801<br />
Two or More Races 103 115 6,790<br />
Socioeconomically Disadvantaged 283 1,529 217,915<br />
English Learners 135 652 93,297<br />
Students with Disabilities 110 322 31,683<br />
Career Technical Education Programs (<strong>School</strong> Year 2012-13)<br />
1/29/2014 Powered by <strong>School</strong><strong>City</strong>, Inc Page 17 of 18
James C. Enochs High 2012-13<br />
<strong>School</strong> <strong>Accountability</strong> <strong>Report</strong> <strong>Card</strong><br />
<strong>Modesto</strong> <strong>City</strong> <strong>School</strong>s' <strong>School</strong> to Career program provides preparation to youth and adults to meet the challenge of working<br />
in the 21st Century by a combination of academic and workplace based education that will make them life-time learners.<br />
Our commitment is to provide a successful program that promises to upgrade front line workers, improve the productive<br />
capacity of entry-level workers and provide quality education for all students.<br />
Career Technical Education Participation (<strong>School</strong> Year 2012-13)<br />
Measure<br />
CTE Program Participation<br />
Number of pupils participating in CTE 5809<br />
Percent of pupils completing a CTE program and earning a high<br />
school diploma<br />
Percent of CTE courses sequenced or articulated between the<br />
school and institutions of postsecondary education<br />
21<br />
95<br />
Courses for University of California and/or California State University Admission<br />
UC/CSU Course Measure<br />
2012-13 Students Enrolled in Courses Required for UC/CSU<br />
Admission<br />
2011-12 Graduates Who Completed All Courses Required for<br />
UC/CSU Admission<br />
Percent<br />
70.04<br />
38.19<br />
Advanced Placement Courses (<strong>School</strong> Year 2012-13)<br />
Computer Science<br />
Subject<br />
Number of AP Courses<br />
Offered*<br />
Percent of Students In AP<br />
Courses<br />
NA<br />
English 2 NA<br />
Fine and Performing Arts<br />
Foreign Language<br />
NA<br />
NA<br />
Mathematics 4 NA<br />
Science 4 NA<br />
Social Science 4 NA<br />
All courses 14 5<br />
* Where there are student course enrollments.<br />
Professional Development<br />
XII. Instructional Planning and Scheduling<br />
This section provides information on the annual number of school days dedicated to staff development for the most recent<br />
three-year period.<br />
10-11 No Staff Development days were allocated.<br />
11-12 Three days were allocated for the Professional Learning Communities Staff Development K-12.<br />
12-13 Four days were allocated for Common Core and 6 days ELA Common Core Transitional Training.<br />
1/29/2014 Powered by <strong>School</strong><strong>City</strong>, Inc Page 18 of 18


