A Solid Step Toward Accurate Interpretations - Arcis
A Solid Step Toward Accurate Interpretations - Arcis
A Solid Step Toward Accurate Interpretations - Arcis

You also want an ePaper? Increase the reach of your titles
YUMPU automatically turns print PDFs into web optimized ePapers that Google loves.
AAPG<br />
EXPLORER<br />
GEOPHYSICALCORNER<br />
The Geophysical Corner is a regular column in the EXPLORER, edited by<br />
Satinder Chopra, chief geophysicist for <strong>Arcis</strong> Seismic Solutions, Calgary,<br />
Canada, and a past AAPG-SEG Joint Distinguished Lecturer. This month’s<br />
column deals with quantifying facies variation.<br />
A <strong>Solid</strong> <strong>Step</strong> <strong>Toward</strong> <strong>Accurate</strong> <strong>Interpretations</strong><br />
By SATINDER CHOPRA and RITESH KUMAR SHARMA<br />
In last month’s<br />
Geophysical Corner<br />
we discussed the<br />
unsupervised seismic<br />
waveform classification<br />
method, which provides<br />
qualitative information<br />
on lithology in terms<br />
of facies variation in a<br />
given subsurface target CHOPRA<br />
zone.<br />
While this information<br />
is useful, more work<br />
needs to be done for<br />
characterizing such<br />
formations of interest in<br />
terms of porosity and<br />
fluid content. For this<br />
purpose, impedance<br />
inversion of seismic<br />
data could be used, SHARMA<br />
which essentially means<br />
transforming seismic amplitudes into<br />
impedance values.<br />
This month we discuss here such<br />
impedance characterization of the<br />
formations of interest.<br />
* * *<br />
Seismic signals have a narrow frequency<br />
bandwidth, say 8-80 Hz. Frequencies below<br />
8 or 10 Hz are lost either by bandpass<br />
filtering circuits in the recording instruments<br />
or while processing of seismic data to<br />
eliminate the low frequency noise usually<br />
present in the data.<br />
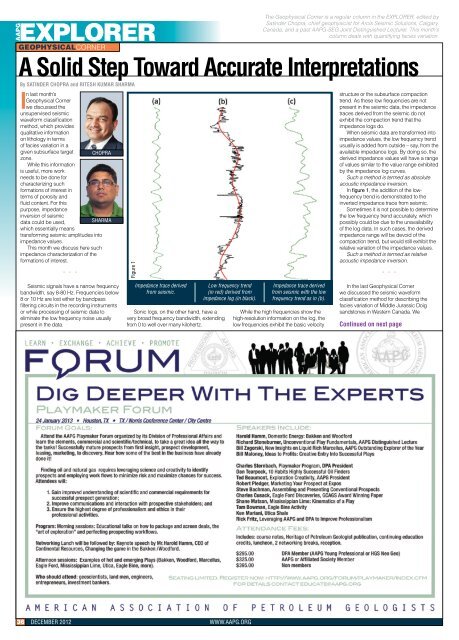
Figure 1<br />
Impedance trace derived<br />
from seismic.<br />
Sonic logs, on the other hand, have a<br />
very broad frequency bandwidth, extending<br />
from 0 to well over many kilohertz.<br />
Low frequency trend<br />
(in red) derived from<br />
impedance log (in black).<br />
Impedance trace derived<br />
from seismic with the low<br />
frequency trend as in (b).<br />
While the high frequencies show the<br />
high-resolution information on the log, the<br />
low frequencies exhibit the basic velocity<br />
structure or the subsurface compaction<br />
trend. As these low frequencies are not<br />
present in the seismic data, the impedance<br />
traces derived from the seismic do not<br />
exhibit the compaction trend that the<br />
impedance logs do.<br />
When seismic data are transformed into<br />
impedance values, the low frequency trend<br />
usually is added from outside – say, from the<br />
available impedance logs. By doing so, the<br />
derived impedance values will have a range<br />
of values similar to the value range exhibited<br />
by the impedance log curves.<br />
Such a method is termed as absolute<br />
acoustic impedance inversion.<br />
In figure 1, the addition of the lowfrequency<br />
trend is demonstrated to the<br />
inverted impedance trace from seismic.<br />
Sometimes it is not possible to determine<br />
the low frequency trend accurately, which<br />
possibly could be due to the unavailability<br />
of the log data. In such cases, the derived<br />
impedance range will be devoid of the<br />
compaction trend, but would still exhibit the<br />
relative variation of the impedance values.<br />
Such a method is termed as relative<br />
acoustic impedance inversion.<br />
* * *<br />
In the last Geophysical Corner<br />
we discussed the seismic waveform<br />
classification method for describing the<br />
facies variation of Middle Jurassic Doig<br />
sandstones in Western Canada. We<br />
Continued on next page<br />
36 DECEMBER 2012 WWW.AAPG.ORG
AAPG<br />
EXPLORER<br />
Continued from previous page<br />
pick up the same example to determine<br />
the changes of impedance in the Doig<br />
sandstones in a lateral sense, which would<br />
be reflective of the porosity changes.<br />
In figure 2a we show a horizon slice from<br />
the relative acoustic impedance volume<br />
derived from the input data volume. Within<br />
the sand boundary (in black), there are<br />
variations in impedance.<br />
We also computed the absolute acoustic<br />
impedance on the same volume, which<br />
is shown in figure 2b. Though the overall<br />
impedance pattern still appears more-orless<br />
the same, there is a significant variation<br />
in the impedance (red color) within the sand<br />
boundary.<br />
* * *<br />
The May 2008 Geophysical Corner<br />
described a thin-bed reflectivity inversion<br />
method that outputs a reflectivity series<br />
–and demonstrates that the apparent<br />
resolution of the inversion output is superior<br />
to the resolution of the input seismic data<br />
used to generate the reflectivity response.<br />
This aspect makes the method ideal for<br />
detailed delineation and characterization of<br />
thin reservoirs.<br />
We derived the reflectivity from the<br />
seismic data used for generating the<br />
impedance displays in figure 2, and then<br />
generated relative acoustic impedance<br />
from it. The result is shown in figure 3, where<br />
the impedance variation exhibits a pattern<br />
that is more focused than the impedance<br />
variation in figure 2a and similar to that in 2b<br />
– but superior.<br />
The main reason for this is probably<br />
the absence of the seismic wavelet in the<br />
data used to derive the relative acoustic<br />
impedance in figure 3.<br />
Impedance inversion on highly<br />
resolved seismic data retrieved in the<br />
form of reflectivity is useful for making<br />
accurate interpretations, and so proves<br />
advantageous.<br />
We thank <strong>Arcis</strong> Seismic Solutions for<br />
permission to present this work.<br />
Editor’s note: Chopra and Sharma are<br />
both with <strong>Arcis</strong> Seismic Solutions, Calgary,<br />
Canada.<br />
Call for Papers<br />
Issued for IPTC '14<br />
The call for papers has been issued<br />
for the seventh International<br />
Petroleum Technology Conference,<br />
set Jan. 20-22, 2014, in Doha, Qatar.<br />
The theme for the multi-society event<br />
will be “Unlocking Energy Through<br />
Innovation, Technology and Capability.”<br />
IPTCs are sponsored by AAPG, SEG,<br />
SPE and EAGE, rotating yearly between<br />
Doha and the Asia Pacific region. The<br />
2013 IPTC will be held March 26-28 in<br />
Beijing, China.<br />
Proposed technical topics are:<br />
u E&P Geoscience Challenges.<br />
u Reservoir.<br />
u Drilling and Completion.<br />
u Production and Operations.<br />
u Engineering Projects and Facilities.<br />
u Field Development.<br />
u Mid-Stream Gas.<br />
u Over-Arching Industry Issues – HSE,<br />
Security, Human Resources, Business<br />
and Social Challenges.<br />
The call for papers deadline is April<br />
12. To submit an abstract, or for more<br />
information, go to iptcnet.org.<br />
EXPLORER<br />
EXPLORER<br />
Figure 2 – Horizon slice through the (a) relative acoustic impedance volume<br />
(b) absolute acoustic impedance volume passing through the Doig sandstone.<br />
Figure 3 – Equivalent horizon slice to that of<br />
figure 2, through the relative acoustic impedance<br />
volume generated from thin-bed reflectivity<br />
derived from the input seismic volume.<br />
WWW.AAPG.ORG DECEMBER 2012<br />
37