Hyperspectral Image Compression Using JPEG2000 and Principal ...
Hyperspectral Image Compression Using JPEG2000 and Principal ...
Hyperspectral Image Compression Using JPEG2000 and Principal ...

Create successful ePaper yourself
Turn your PDF publications into a flip-book with our unique Google optimized e-Paper software.
IEEE GEOSCIENCE AND REMOTE SENSING LETTERS, VOL. 4, NO. 2, APRIL 2007 201<br />
<strong>Hyperspectral</strong> <strong>Image</strong> <strong>Compression</strong> <strong>Using</strong> <strong>JPEG2000</strong><br />
<strong>and</strong> <strong>Principal</strong> Component Analysis<br />
Qian Du, Member, IEEE, <strong>and</strong> James E. Fowler, Senior Member, IEEE<br />
Abstract—<strong>Principal</strong> component analysis (PCA) is deployed in<br />
<strong>JPEG2000</strong> to provide spectral decorrelation as well as spectral<br />
dimensionality reduction. The proposed scheme is evaluated in<br />
terms of rate-distortion performance as well as in terms of information<br />
preservation in an anomaly-detection task. Additionally,<br />
the proposed scheme is compared to the common approach<br />
of <strong>JPEG2000</strong> coupled with a wavelet transform for spectral<br />
decorrelation. Experimental results reveal that, not only does the<br />
proposed PCA-based coder yield rate-distortion <strong>and</strong> informationpreservation<br />
performance superior to that of the wavelet-based<br />
coder, the best PCA performance occurs when a reduced number<br />
of PCs are retained <strong>and</strong> coded. A linear model to estimate the<br />
optimal number of PCs to use in such dimensionality reduction<br />
is proposed.<br />
Index Terms—<strong>Hyperspectral</strong> data compression, <strong>JPEG2000</strong>,<br />
principal component analysis (PCA), wavelet transforms.<br />
I. INTRODUCTION<br />
HYPERSPECTRAL images typically possess a high<br />
degree of spectral as well as spatial correlation. As a<br />
consequence, data compression can significantly reduce hyperspectral<br />
data volumes to more manageable size for storage <strong>and</strong><br />
communication. Wavelet-based lossy compression techniques<br />
are of particular interest due to their long history of providing<br />
excellent rate-distortion performance for traditional 2-D imagery.<br />
Consequently, a number of prominent 2-D compression<br />
algorithms have been extended to 3-D; these 3-D waveletbased<br />
techniques include 3D-SPIHT, 3D-SPECK, <strong>and</strong> 3-D tarp<br />
(see [1] for a review). In addition, the <strong>JPEG2000</strong> st<strong>and</strong>ard has<br />
been widely applied to 3-D hyperspectral image coding (e.g.,<br />
[2]–[4]) owing to its ability to code multiple image components.<br />
However, it has been argued that such a direct extension from<br />
2-D to 3-D, without the consideration of special characteristics<br />
of hyperspectral imagery, may be problematic [5], as data<br />
analysis applied subsequent to compression may be affected.<br />
Typically, the development of a 3-D compression algorithm<br />
involves coupling a decorrelating transform in the spectral<br />
direction with a spatial wavelet transform plus a coding algorithm<br />
suitably modified for a 3-D data array. Most often,<br />
a wavelet transform is also deployed spectrally, so as to implement<br />
a 3-D wavelet decomposition. Indeed, Annex I of<br />
Part 2 of the <strong>JPEG2000</strong> st<strong>and</strong>ard supports a spectral discrete<br />
wavelet transform (DWT) in this manner, <strong>and</strong> it has been shown<br />
that <strong>JPEG2000</strong> plus a spectral DWT generally achieves ratedistortion<br />
performance superior to that of other wavelet-based<br />
Manuscript received June 29, 2006; revised October 8, 2006.<br />
The authors are with the Department of Electrical <strong>and</strong> Computer Engineering,<br />
GeoResources Institute (GRI)—Mississippi State HPC 2 , Mississippi State<br />
University, Mississippi State, MS 39762 USA (e-mail: du@ece.msstate.edu;<br />
fowler@ece.msstate.edu).<br />
Digital Object Identifier 10.1109/LGRS.2006.888109<br />
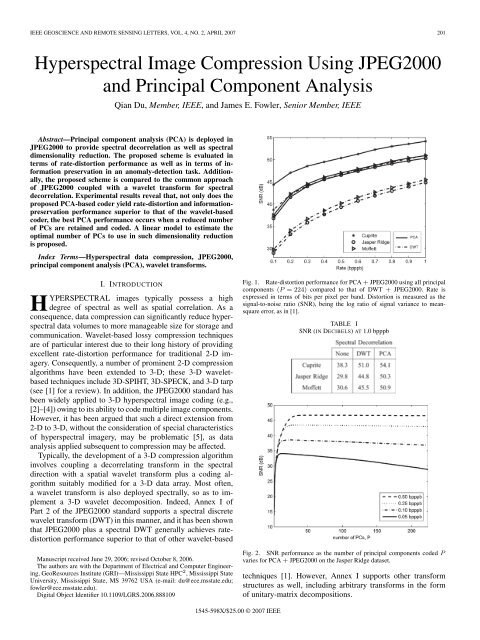
Fig. 1. Rate-distortion performance for PCA + <strong>JPEG2000</strong> using all principal<br />
components (P = 224) compared to that of DWT + <strong>JPEG2000</strong>. Rate is<br />
expressed in terms of bits per pixel per b<strong>and</strong>. Distortion is measured as the<br />
signal-to-noise ratio (SNR), being the log ratio of signal variance to meansquare<br />
error, as in [1].<br />
TABLE I<br />
SNR (IN DECIBELS) AT 1.0 bpppb<br />
Fig. 2. SNR performance as the number of principal components coded P<br />
varies for PCA + <strong>JPEG2000</strong> on the Jasper Ridge dataset.<br />
techniques [1]. However, Annex I supports other transform<br />
structures as well, including arbitrary transforms in the form<br />
of unitary-matrix decompositions.<br />
1545-598X/$25.00 © 2007 IEEE
202 IEEE GEOSCIENCE AND REMOTE SENSING LETTERS, VOL. 4, NO. 2, APRIL 2007<br />
TABLE II<br />
NUMBER OF PCS P ∗ THAT YIELDS MAXIMUM SNR<br />
In this letter, we investigate the performance of principal<br />
component analysis (PCA) for spectral decorrelation in conjunction<br />
with <strong>JPEG2000</strong> coding. This letter has four primary<br />
objectives. First, we compare this PCA-based spectral decorrelation<br />
to the more common approach of a DWT spectral<br />
transform. Second, we investigate the impact of using PCA for<br />
dimensionality reduction in addition to spectral decorrelation,<br />
observing the effect that the number of principal components<br />
(PCs) used in compression has on rate-distortion performance.<br />
Third, we evaluate the performance of <strong>JPEG2000</strong> with PCAbased<br />
spectral decorrelation in terms of information preservation,<br />
i.e., in terms of the usefulness of the reconstructed data<br />
in analysis, such as detection <strong>and</strong> classification. Finally, using<br />
our observations of both rate-distortion as well as data-analysis<br />
performance, we develop a heuristic that estimates the optimal<br />
number of PCs to be retained during dimensionality reduction.<br />
Our experiments indicate that, not only does PCA outperform<br />
the DWT for spectral decorrelation, the best performance occurs<br />
when only a small subset of PCs is coded instead of the<br />
entire set. The simple linear heuristic we develop estimates the<br />
optimal number of PCs, from both the rate-distortion as well as<br />
information-preservation perspectives.<br />
II. <strong>JPEG2000</strong> AND PCA-BASED<br />
SPECTRAL DECORRELATION<br />
A. Implementation<br />
PCA, a well-known technique in multivariate data analysis,<br />
has been widely used in the hyperspectral setting for spectral<br />
decorrelation as well as spectral dimensionality reduction. Capable<br />
of optimal decorrelation in a statistical sense, PCA often<br />
provides excellent decorrelation in practice. When all PCs are<br />
retained, PCA is commonly known as the Karhunen–Loève<br />
transform (KLT), in which case a hyperspectral image with<br />
N spectral b<strong>and</strong>s produces an N × N unitary KLT transform<br />
matrix. As this matrix is data dependent, it must be communicated<br />
to the decoder in any KLT-based compression system.<br />
Alternatively, PCA can effectuate dimensionality reduction by<br />
retaining in the KLT transform matrix only those eigenvectors<br />
corresponding to the P largest eigenvectors. The data volume<br />
passed to the encoder then has P
DU AND FOWLER: HYPERSPECTRAL IMAGE COMPRESSION USING <strong>JPEG2000</strong> AND PCA 203<br />
TABLE III<br />
DETECTION PERFORMANCE OF PCA + <strong>JPEG2000</strong> AND DWT + <strong>JPEG2000</strong><br />
st<strong>and</strong>ard. For both PCA + <strong>JPEG2000</strong> <strong>and</strong> DWT + <strong>JPEG2000</strong>,<br />
a spatial 9/7 transform with five levels is used.<br />
Fig. 1 shows rate-distortion performance when using PCA +<br />
<strong>JPEG2000</strong> <strong>and</strong> DWT + <strong>JPEG2000</strong> to encode the three AVIRIS<br />
scenes. Table I tabulates the SNR for PCA + <strong>JPEG2000</strong> <strong>and</strong><br />
DWT + <strong>JPEG2000</strong> at a fixed rate; also shown is the performance<br />
when <strong>JPEG2000</strong> is used with no spectral decorrelation.<br />
We see that, in all cases, although DWT-based spectral decorrelation<br />
improves SNR by around 15 dB with respect to no<br />
spectral decorrelation, PCA-based spectral decorrelation results<br />
in a further 5-dB increase. From a statistical perspective, PCA<br />
offers optimal decorrelation while highly structured correlation<br />
is known to exist between DWT coefficients, both within<br />
subb<strong>and</strong>s <strong>and</strong> across subb<strong>and</strong>s. While <strong>JPEG2000</strong> exploits this<br />
DWT correlation structure spatially, no attempt is made to<br />
exploit residual correlation across components, i.e., spectrally.<br />
As a consequence, a spectral DWT leaves a significant degree of<br />
correlation present in the spectral direction; the spectral PCA,<br />
with its optimal decorrelation, thus performs better.<br />
III. <strong>JPEG2000</strong> AND PCA-BASED<br />
DIMENSIONALITY REDUCTION<br />
A. Rate-Distortion Considerations<br />
In the use of PCA above, we retained <strong>and</strong> coded the full<br />
number of PCs. Theoretically, PCRD optimization results in an<br />
optimal rate allocation <strong>and</strong> SNR, thereby obviating the need for<br />
explicit dimensionality reduction. In theory, one should code<br />
all PCs <strong>and</strong> let the PCRD optimization allocate rate across the<br />
PCs, as PCs that are unneeded will be automatically allocated<br />
zero rate. However, in practice, rate-distortion performance<br />
is improved if fewer than the full complement of PCs is<br />
coded (i.e., for P
204 IEEE GEOSCIENCE AND REMOTE SENSING LETTERS, VOL. 4, NO. 2, APRIL 2007<br />
Fig. 4. ROC curves for the Moffett dataset at 0.05 bpppb. P d =<br />
probability of detection. P f = probability of false alarm.<br />
in the data. In this letter, unsupervised detection is considered.<br />
We focus on anomaly detection, wherein an anomaly is defined<br />
as a small object or material whose spectral signature is very<br />
different from the background. In hyperspectral applications,<br />
such an anomaly is most likely an unknown target. Anomaly<br />
detection provides a good test of the performance of lossy<br />
compression in information preservation because these small<br />
objects or materials are prone to be sacrificed during compression,<br />
although they may be, in fact, quite important to the<br />
hyperspectral application.<br />
The well-known RX algorithm is employed for anomaly<br />
detection [7]. Since there is no real ground truth available, we<br />
consider the detection map resulting from the original data to be<br />
ground truth; the detection map resulting from the reconstructed<br />
data is then compared to it. The measure of similarity comparison<br />
is the spatial correlation coefficient ρ—the closer ρ is to<br />
1.0, the better the detection performance is considered to be.<br />
Fig. 3 indicates that the detection performance varies with<br />
P , which is the number of PCs used for compression, with the<br />
maximal correlation coefficient occurring in all cases for fewer<br />
than 224 PCs. Once again, this experiment demonstrates that<br />
it is unnecessary, even undesirable, to retain the minor PCs,<br />
since they contain noise only <strong>and</strong> will not contribute to target<br />
detection.<br />
Table III presents P † , which is the number of PCs that<br />
achieves maximum detection performance, for each of the<br />
three AVIRIS datasets. Additionally, detection performance<br />
for PCA + <strong>JPEG2000</strong> using all 224 PCs as well as the<br />
performance for DWT + <strong>JPEG2000</strong> is given. We see that, in all<br />
cases, the maximum ρ occurs for strictly fewer than 224 PCs;<br />
additionally, this maximal PCA + <strong>JPEG2000</strong> ρ is greater than<br />
that of DWT + <strong>JPEG2000</strong> in all cases.<br />
Table III also examines the effect that compression has<br />
on anomalous pixels as measured using the Spectral Angle<br />
Mapper (SAM); such anomalous pixels typically are among<br />
the worst for spectral distortion in the dataset. In general, PCA<br />
+ <strong>JPEG2000</strong> using all the PCs results in less spectral distortion<br />
than DWT + <strong>JPEG2000</strong> for the anomalous pixels. Table III<br />
also shows the mean <strong>and</strong> st<strong>and</strong>ard deviation of the SAM over<br />
the entire image, <strong>and</strong> from these values, we observe that the<br />
average spectral distortion is typically quite small, even for low<br />
rate. On average, DWT + <strong>JPEG2000</strong> incurs the most average<br />
Fig. 5. P ∗ <strong>and</strong> ˜P ∗ versus rate R.<br />
TABLE IV<br />
COMPARISON BETWEEN P ∗ AND ˜P ∗ AND THE RESULTING SNRS<br />
spectral distortion, while PCA + <strong>JPEG2000</strong> using P † PCs<br />
incurs the least.<br />
In comparing Table II with Table III, it is interesting to see<br />
that P ∗ , which is the number of PCs yielding maximal SNR<br />
in Table II, is typically close to P † , which is the number of<br />
PCs yielding maximal detection performance in Table III.<br />
Often, these two values are identical. Consequently, we argue<br />
that, if we code the dataset using P ∗ PCs, we can use the<br />
reconstructed image for practical data analysis, such as target<br />
detection, because this same number of PCs should provide<br />
good performance in that sense as well. We use this observation<br />
as a motivation for developing a heuristic that estimates P ∗ in<br />
Section III-C.<br />
In order to further evaluate the detection performance,<br />
analysis of the receiver operating characteristic (ROC) is<br />
conducted. Target pixels are defined by thresholding the<br />
detection map produced from the original data with a threshold<br />
of half the maximum. Detection maps from the reconstructed<br />
data are then thresholded with thresholds ranging from 10%<br />
to 90% of maximum, <strong>and</strong> the detection <strong>and</strong> false-alarm<br />
probabilities are calculated for each threshold using the<br />
previously defined target pixels. Fig. 4 shows the resulting<br />
ROC curves for the Moffett dataset, which has a sufficient<br />
number of anomalous pixels for meaningful ROC analysis.<br />
To quantify the performance, the areas under the ROC curves<br />
are given in Table III for Moffett, with a larger area indicating
DU AND FOWLER: HYPERSPECTRAL IMAGE COMPRESSION USING <strong>JPEG2000</strong> AND PCA 205<br />
TABLE V<br />
RATE-DISTORTION AND ANOMALY-DETECTION PERFORMANCE<br />
superior detection performance. We see that the ROC areas<br />
generally match the correlation coefficients in Table III.<br />
C. Linear Model for Dimensionality Reduction<br />
Let P ∗ be the number of PCs that yields maximal SNR for<br />
a given dataset. From Fig. 2, P ∗ clearly varies with the rate<br />
R of the coding. We thus propose a simple linear model on<br />
R as an estimate of P ∗ . This is illustrated in Fig. 5 in which<br />
wefitalinetotheP ∗ versus R curves for the three AVIRIS<br />
datasets; specifically, we estimate P ∗ as ˜P ∗ = αR + β, where<br />
α =87.7778 <strong>and</strong> β =16.2222 are constants. Even though the<br />
P ∗ versus R curves are rather nonlinear in Fig. 5, this linear<br />
model fits the curves quite closely at the lower rates, which is<br />
crucial, since, from Fig. 2, the performance suffers the most<br />
from not coding at P ∗ when the rate is low.<br />
As shown in Table IV, this linear model yields rather accurate<br />
results in some cases. For instance, when the bit rate is<br />
0.25 bpppb, the estimated ˜P ∗ values are very close to the true<br />
P ∗ values. In some cases, however, ˜P ∗ can be quite different<br />
from P ∗ . For instance, the Cuprite scene yields the P ∗ versus<br />
R curve furthest from the linear model, as shown in Fig. 5; at<br />
0.5 bpppb, the model gives ˜P ∗ =75, while P ∗ =57for this<br />
dataset. Fortunately, the difference in SNR between these two<br />
values is only about 0.05 dB, which is relatively negligible. As<br />
a consequence, we conclude that the model provides a simple<br />
yet effective estimate of P ∗ .<br />
To further evaluate the proposed linear model, Table V<br />
summarizes the SNR <strong>and</strong> ρ values resulting from using P ∗<br />
(maximum SNR), P † (maximum ρ), <strong>and</strong> ˜P ∗ from the linear<br />
model. In many cases, P ∗ is close to P † ; in other cases, these<br />
two numbers are different, but the resulting performance is still<br />
close. Most importantly, ˜P ∗ , from the linear model, always<br />
yields comparable SNR <strong>and</strong> ρ.<br />
IV. CONCLUSION<br />
In this letter, we investigated the performance of spectral<br />
PCA in conjunction with <strong>JPEG2000</strong> for hyperspectral image<br />
compression, comparing to the common approach of a spectral<br />
DWT followed by <strong>JPEG2000</strong>. Experimental results on AVIRIS<br />
datasets yield the following observations: 1) spectral decorrelation<br />
via PCA results in rate-distortion performance superior<br />
to that of a spectral DWT; 2) rate-distortion performance is<br />
further improved by retaining <strong>and</strong> coding only a subset of PCs<br />
rather than using all the PCs; 3) data-analysis performance,<br />
such as anomaly detection, is similarly maximized by coding<br />
a subset of PCs rather than all the PCs; 4) the number of<br />
PCs that yields maximum SNR for a given dataset is usually<br />
close to the number of PCs that yields maximum detection<br />
performance; <strong>and</strong> 5) a simple linear model can effectively<br />
estimate the optimal number of PCs. Consequently, we conclude<br />
that the capabilities of PCA for decorrelation simultaneous<br />
with dimensionality reduction offer the potential for an<br />
excellent data-compression performance, significantly superior<br />
to that obtained by other techniques based on 3-D wavelet<br />
transforms.<br />
REFERENCES<br />
[1] J. E. Fowler <strong>and</strong> J. T. Rucker, “3D wavelet-based compression of hyperspectral<br />
imagery,” in <strong>Hyperspectral</strong> Data Exploitation: Theory <strong>and</strong> Applications,<br />
C.-I Chang, Ed. Hoboken, NJ: Wiley, 2007.<br />
[2] J. T. Rucker, J. E. Fowler, <strong>and</strong> N. H. Younan, “<strong>JPEG2000</strong> coding strategies<br />
for hyperspectral data,” in Proc. Int. Geosci. <strong>and</strong> Remote Sens. Symp.,<br />
Seoul, Korea, Jul. 2005, vol. 1, pp. 128–131.<br />
[3] B. Penna, T. Tillo, E. Magli, <strong>and</strong> G. Olmo, “Progressive 3-D coding of<br />
hyperspectral images based on <strong>JPEG2000</strong>,” IEEE Geosci. Remote Sens.<br />
Lett., vol. 3, no. 1, pp. 125–129, Jan. 2006.<br />
[4] P. Kulkarni, A. Bilgin, M. W. Marcellin, J. C. Dagher, J. H. Kasner,<br />
T. J. Flohr, <strong>and</strong> J. C. Rountree, “<strong>Compression</strong> of earth science data with<br />
<strong>JPEG2000</strong>,” in <strong>Hyperspectral</strong> <strong>Image</strong> <strong>Compression</strong>, G. Motta, F. Rizzo, <strong>and</strong><br />
J. A. Storer, Eds. New York: Springer-Verlag, 2006, ch. 12, pp. 347–378.<br />
[5] M. R. Pickering <strong>and</strong> M. J. Ryan, “An architecture for the compression of<br />
hyperspectral imagery,” in <strong>Hyperspectral</strong> <strong>Image</strong> <strong>Compression</strong>, G. Motta,<br />
F. Rizzo, <strong>and</strong> J. A. Storer, Eds. New York: Springer-Verlag, 2006, ch. 1,<br />
pp. 1–34.<br />
[6] D. Taubman, “High performance scalable image compression with<br />
EBCOT,” IEEE Trans. <strong>Image</strong> Process., vol. 9, no. 7, pp. 1158–1170,<br />
Jul. 2000.<br />
[7] C.-I Chang <strong>and</strong> S.-S. Chiang, “Anomaly detection <strong>and</strong> classification for<br />
hyperspectral imagery,” IEEE Trans. Geosci. Remote Sens., vol. 40, no. 6,<br />
pp. 1314–1325, Jun. 2002.