Effect of Storage Conditions upon the Resistance (D ... - Mesa Labs
Effect of Storage Conditions upon the Resistance (D ... - Mesa Labs
Effect of Storage Conditions upon the Resistance (D ... - Mesa Labs

Create successful ePaper yourself
Turn your PDF publications into a flip-book with our unique Google optimized e-Paper software.
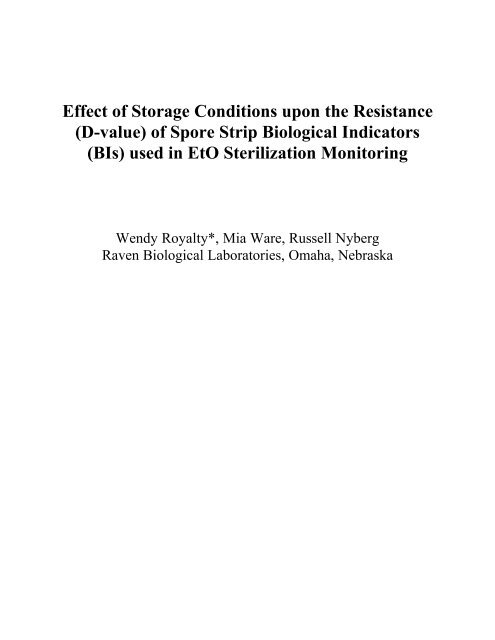
<strong>Effect</strong> <strong>of</strong> <strong>Storage</strong> <strong>Conditions</strong> <strong>upon</strong> <strong>the</strong> <strong>Resistance</strong><br />
(D-value) <strong>of</strong> Spore Strip Biological Indicators<br />
(BIs) used in EtO Sterilization Monitoring<br />
Wendy Royalty*, Mia Ware, Russell Nyberg<br />
Raven Biological Laboratories, Omaha, Nebraska
Abstract<br />
Spore strip storage recommendations vary among<br />
manufacturers. The manufacturers’ recommended storage<br />
conditions range from freezing (-15 o C), to ambient (22 o C), to<br />
refrigeration (5 o C). This study investigated <strong>the</strong> various<br />
storage conditions and <strong>the</strong>ir effect <strong>upon</strong> EtO D-value<br />
resistance. Using commercially prepared Bacillus subtilis<br />
spore strips (ATCC #9372) prepared according to US<br />
Pharmacopeia XXIII performance parameters, spore strips<br />
from three different production lots were stored at <strong>the</strong> various<br />
recommended temperatures. Periodically, samples from each<br />
storage condition were removed and tested in a Joslyn/Steris<br />
EtO Biological Indicator Evaluator Resistometer (BIER)<br />
vessel to determine D-value using <strong>the</strong> Spearman-Karber<br />
Fraction Negative method. Population assays were<br />
performed according to USP XXIII, supplement 5 ‘viable<br />
spore count’ to determine population stability. The resulting<br />
D-values were plotted and recorded. Resulting D-value<br />
changes were compared over time, and D-value change trends<br />
were graphically presented<br />
Introduction<br />
Ethylene oxide sterilization combines <strong>the</strong> lethal effects <strong>of</strong> <strong>the</strong><br />
sterilent, exposure time, relative humidity and temperature on<br />
a microbial population. BIs are commonly used to monitor<br />
<strong>the</strong> efficacy <strong>of</strong> ethylene oxide sterilization cycles. This study<br />
focuses on <strong>the</strong> use <strong>of</strong> spore strips. To function as effective<br />
monitors, BIs should maintain a stable level <strong>of</strong> resistance
while being stored over a specific period <strong>of</strong> shelf-life time.<br />
If it is so important to maintain <strong>the</strong> resistance level in spore<br />
strips and o<strong>the</strong>r BIs, how and where should <strong>the</strong>y be stored?<br />
This question is <strong>the</strong> primary focus <strong>of</strong> this experiment wherein<br />
three lots <strong>of</strong> spore strips inoculated with B. subtilis spores<br />
were stored and studied over a period <strong>of</strong> nine months. After<br />
inoculation <strong>of</strong> approximately 3,000 spore strips (1,000 per<br />
subtilis lot), <strong>the</strong>y were assayed to find <strong>the</strong> population per<br />
strip, packed into glassine envelopes, and stored under<br />
differing conditions.<br />
Since manufacturers recommend <strong>the</strong> strips be stored in<br />
conditions which range in temperature from freezing (-15 o C),<br />
to refrigeration (5 o C) to ambient (22 o C). Our study was to<br />
compare <strong>the</strong>se three storage conditions in order to determine<br />
<strong>the</strong> possible effects <strong>upon</strong> population and resistance for <strong>the</strong><br />
three lots <strong>of</strong> BIs. In our study, <strong>the</strong> storage temperatures were<br />
-8 o C, 5 o C, and 27 o C.<br />
Materials and Methods<br />
Materials<br />
1. One thousand <strong>of</strong> each lot <strong>of</strong> W-135GB, W-136GB<br />
and W-137GB spore strips in glassine envelopes.<br />
2. Joslyn ethylene oxide BIER vessel.<br />
3. Sterile Tryptic Soy Broth/Phenol Red (TSB/PR)<br />
prepared according to manufacturer’s instructions.
4. Tryptic Soy Agar for population assays.<br />
5. Incubator with temperature set at 35 o C.<br />
6. Laminar flow hood.<br />
7. Standard laboratory materials.<br />
Methods<br />
Raven Biological Laboratories manufactured three lots<br />
<strong>of</strong> spore strips containing one thousand biological<br />
indicators per lot. On July 10, 1998, population assays<br />
were done on <strong>the</strong> three lots <strong>of</strong> spore strips according to<br />
U.S. Pharmacopeia XXIII guidelines. Upon completion<br />
<strong>of</strong> <strong>the</strong> population assays, ethylene oxide exposures were<br />
run using a Joslyn Ethylene Oxide BIER vessel. The<br />
data was collected to determine an all-kill and allsurvive<br />
time with three dichotomous points in between.<br />
The Spearman-Karber (Fraction Negative) method was<br />
used to compute <strong>the</strong> D-values. The BIs within each lot<br />
were <strong>the</strong>n divided into three sublots, and stored in a<br />
refrigerator (ref), freezer (fr), and on a shelf at room<br />
temperature (rt) for a total <strong>of</strong> nine months.<br />
Population assays were done again after nine months <strong>of</strong><br />
storage in <strong>the</strong> strips’ respective environments. Change<br />
in spore count was noted and various EtO exposure<br />
times were run on each sublot <strong>of</strong> <strong>the</strong> three lots <strong>of</strong> spore<br />
test strips after nine months. The Spearman-Karber D-<br />
value was determined by exposing ten <strong>of</strong> each sublot <strong>of</strong><br />
BIs to ethylene oxide at selected exposure times.<br />
Exposures were run in increments <strong>of</strong> one, two, or four
minutes. After <strong>the</strong> EtO exposures, <strong>the</strong> individual BIs<br />
were aseptically transferred from <strong>the</strong>ir glassine<br />
envelopes into 10-ml tubes <strong>of</strong> TSB/PR. The cultured<br />
samples were <strong>the</strong>n incubated at 30 o -35 o C for seven days<br />
and observed for signs <strong>of</strong> growth daily.<br />
Positive growth was determined by a color change <strong>of</strong><br />
<strong>the</strong> media from red to yellow and by its turbidity. The<br />
growth results for each exposure time were recorded.<br />
This data, combined with <strong>the</strong> results <strong>of</strong> <strong>the</strong> population<br />
assays, was used to determine <strong>the</strong> EtO D-value using <strong>the</strong><br />
Spearman-Karber fraction negative formula listed<br />
below. A table created through <strong>the</strong> use <strong>of</strong> Micros<strong>of</strong>t<br />
Excel was also used to calculate <strong>the</strong> D-values. The data<br />
obtained from <strong>the</strong> assays and EtO exposures were <strong>the</strong>n<br />
compared to <strong>the</strong> original results and graphed.<br />
Spearman-Karber (fraction negative) formula:<br />
D=U/(logN 0 +. 2507)<br />
U=T-d/2-(d/10 x Σf k-1 to f 1 )<br />
D=D-value.<br />
U=mean time<br />
until sterility.<br />
N 0 =Population <strong>of</strong><br />
sample.<br />
T=Time to achieve f k .<br />
f k =All samples sterile and adjacent to a<br />
dichotomous result.<br />
d=Time interval between runs in
Results<br />
minutes.<br />
In <strong>the</strong> majority <strong>of</strong> <strong>the</strong> lots tested, populations dropped over<br />
<strong>the</strong> nine-month storage regardless <strong>of</strong> <strong>the</strong> storage conditions.<br />
All remained within an allowable population range to serve<br />
as a suitable EtO cycle challenge in relation to population<br />
(by USP standards).<br />
When compared to spore strips stored at room temperature,<br />
all <strong>of</strong> <strong>the</strong> three lots tested that were stored under freezer<br />
conditions showed a decrease in D-value. The average<br />
decrease was .3 minutes. Two <strong>of</strong> <strong>the</strong> three lots stored under<br />
refrigeration had a slight D-value or resistance increase over<br />
<strong>the</strong> nine months <strong>of</strong> storage.<br />
Micros<strong>of</strong>t Excel Chart<br />
1<br />
Micros<strong>of</strong>t Excel Chart<br />
2<br />
Micros<strong>of</strong>t Excel<br />
Worksheet<br />
3<br />
Micros<strong>of</strong>t Excel Chart<br />
4<br />
Micros<strong>of</strong>t Excel Chart<br />
5
Discussion<br />
The challenge or resistance <strong>of</strong>fered by a BI for a particular<br />
sterilization cycle is <strong>the</strong> important characteristic that needs<br />
to be maintained during <strong>the</strong> storage <strong>of</strong> <strong>the</strong> BIs. A BI stored<br />
under certain conditions that best maintains <strong>the</strong> population<br />
but reduces resistance or D-value is deleterious to <strong>the</strong><br />
effectiveness, or <strong>the</strong> BI challenge. ‘<strong>Resistance</strong> stability’ is<br />
<strong>of</strong> prime importance when evaluating storage conditions.
Conclusion<br />
Bacillus subtilis spore strips stored under <strong>the</strong> conditions <strong>of</strong><br />
refrigeration and at room temperature seem to show <strong>the</strong><br />
least overall change in resistance characteristics while strips<br />
stored under freezing conditions uniformly indicated that<br />
<strong>the</strong> resistance will decrease over extended storage.<br />
Decreased resistance will produce a ‘less challenging’ BI.<br />
This study was only done with three lots <strong>of</strong> spore strips over<br />
a nine-month period <strong>of</strong> storage time. Extended studies<br />
covering a full twelve to twenty-four month range need to<br />
be done to confirm <strong>the</strong> indicated trends in resistance<br />
modification due to storage conditions.