pdf download
pdf download
pdf download

You also want an ePaper? Increase the reach of your titles
YUMPU automatically turns print PDFs into web optimized ePapers that Google loves.
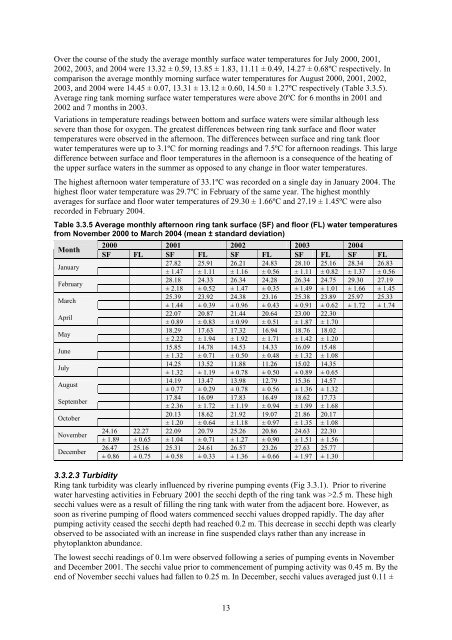
Over the course of the study the average monthly surface water temperatures for July 2000, 2001,<br />
2002, 2003, and 2004 were 13.32 ± 0.59, 13.85 ± 1.83, 11.11 ± 0.49, 14.27 ± 0.68ºC respectively. In<br />
comparison the average monthly morning surface water temperatures for August 2000, 2001, 2002,<br />
2003, and 2004 were 14.45 ± 0.07, 13.31 ± 13.12 ± 0.60, 14.50 ± 1.27ºC respectively (Table 3.3.5).<br />
Average ring tank morning surface water temperatures were above 20ºC for 6 months in 2001 and<br />
2002 and 7 months in 2003.<br />
Variations in temperature readings between bottom and surface waters were similar although less<br />
severe than those for oxygen. The greatest differences between ring tank surface and floor water<br />
temperatures were observed in the afternoon. The differences between surface and ring tank floor<br />
water temperatures were up to 3.1ºC for morning readings and 7.5ºC for afternoon readings. This large<br />
difference between surface and floor temperatures in the afternoon is a consequence of the heating of<br />
the upper surface waters in the summer as opposed to any change in floor water temperatures.<br />
The highest afternoon water temperature of 33.1ºC was recorded on a single day in January 2004. The<br />
highest floor water temperature was 29.7ºC in February of the same year. The highest monthly<br />
averages for surface and floor water temperatures of 29.30 ± 1.66ºC and 27.19 ± 1.45ºC were also<br />
recorded in February 2004.<br />
Table 3.3.5 Average monthly afternoon ring tank surface (SF) and floor (FL) water temperatures<br />
from November 2000 to March 2004 (mean ± standard deviation)<br />
Month<br />
2000 2001 2002 2003 2004<br />
SF FL SF FL SF FL SF FL SF FL<br />
January<br />
27.82 25.91 26.21 24.83 28.10 25.16 28.34 26.83<br />
± 1.47 ± 1.11 ± 1.16 ± 0.56 ± 1.11 ± 0.82 ± 1.37 ± 0.56<br />
February<br />
28.18 24.33 26.34 24.28 26.34 24.75 29.30 27.19<br />
± 2.18 ± 0.52 ± 1.47 ± 0.35 ± 1.49 ± 1.01 ± 1.66 ± 1.45<br />
March<br />
25.39 23.92 24.38 23.16 25.38 23.89 25.97 25.33<br />
± 1.44 ± 0.39 ± 0.96 ± 0.43 ± 0.91 ± 0.62 ± 1.72 ± 1.74<br />
April<br />
22.07 20.87 21.44 20.64 23.00 22.30<br />
± 0.89 ± 0.83 ± 0.99 ± 0.51 ± 1.87 ± 1.70<br />
May<br />
18.29 17.63 17.32 16.94 18.76 18.02<br />
± 2.22 ± 1.94 ± 1.92 ± 1.71 ± 1.42 ± 1.20<br />
June<br />
15.85 14.78 14.53 14.33 16.09 15.48<br />
± 1.32 ± 0.71 ± 0.50 ± 0.48 ± 1.32 ± 1.08<br />
July<br />
14.25 13.52 11.88 11.26 15.02 14.35<br />
± 1.32 ± 1.19 ± 0.78 ± 0.50 ± 0.89 ± 0.65<br />
August<br />
14.19 13.47 13.98 12.79 15.36 14.57<br />
± 0.77 ± 0.29 ± 0.78 ± 0.56 ± 1.36 ± 1.32<br />
September<br />
17.84 16.09 17.83 16.49 18.62 17.73<br />
± 2.36 ± 1.72 ± 1.19 ± 0.94 ± 1.99 ± 1.68<br />
October<br />
20.13 18.62 21.92 19.07 21.86 20.17<br />
± 1.20 ± 0.64 ± 1.18 ± 0.97 ± 1.35 ± 1.08<br />
November<br />
24.16 22.27 22.09 20.79 25.26 20.86 24.63 22.30<br />
± 1.89 ± 0.65 ± 1.04 ± 0.71 ± 1.27 ± 0.90 ± 1.51 ± 1.56<br />
December<br />
26.47 25.16 25.31 24.61 26.57 23.26 27.63 25.77<br />
± 0.86 ± 0.75 ± 0.58 ± 0.33 ± 1.36 ± 0.66 ± 1.97 ± 1.30<br />
3.3.2.3 Turbidity<br />
Ring tank turbidity was clearly influenced by riverine pumping events (Fig 3.3.1). Prior to riverine<br />
water harvesting activities in February 2001 the secchi depth of the ring tank was >2.5 m. These high<br />
secchi values were as a result of filling the ring tank with water from the adjacent bore. However, as<br />
soon as riverine pumping of flood waters commenced secchi values dropped rapidly. The day after<br />
pumping activity ceased the secchi depth had reached 0.2 m. This decrease in secchi depth was clearly<br />
observed to be associated with an increase in fine suspended clays rather than any increase in<br />
phytoplankton abundance.<br />
The lowest secchi readings of 0.1m were observed following a series of pumping events in November<br />
and December 2001. The secchi value prior to commencement of pumping activity was 0.45 m. By the<br />
end of November secchi values had fallen to 0.25 m. In December, secchi values averaged just 0.11 ±<br />
13