pdf download
pdf download
pdf download

You also want an ePaper? Increase the reach of your titles
YUMPU automatically turns print PDFs into web optimized ePapers that Google loves.
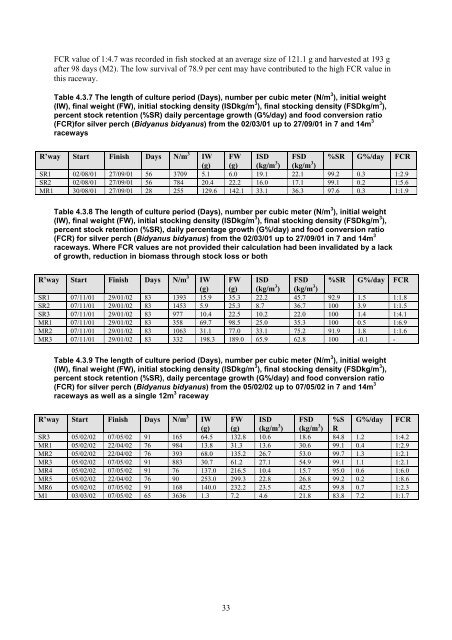
FCR value of 1:4.7 was recorded in fish stocked at an average size of 121.1 g and harvested at 193 g<br />
after 98 days (M2). The low survival of 78.9 per cent may have contributed to the high FCR value in<br />
this raceway.<br />
Table 4.3.7 The length of culture period (Days), number per cubic meter (N/m 3 ), initial weight<br />
(IW), final weight (FW), initial stocking density (ISDkg/m 3 ), final stocking density (FSDkg/m 3 ),<br />
percent stock retention (%SR) daily percentage growth (G%/day) and food conversion ratio<br />
(FCR)for silver perch (Bidyanus bidyanus) from the 02/03/01 up to 27/09/01 in 7 and 14m 3<br />
raceways<br />
R’way Start Finish Days N/m 3 IW FW ISD FSD %SR G%/day FCR<br />
(g) (g) (kg/m 3 ) (kg/m 3 )<br />
SR1 02/08/01 27/09/01 56 3709 5.1 6.0 19.1 22.1 99.2 0.3 1:2.9<br />
SR2 02/08/01 27/09/01 56 784 20.4 22.2 16.0 17.1 99.1 0.2 1:5.6<br />
MR1 30/08/01 27/09/01 28 255 129.6 142.1 33.1 36.3 97.6 0.3 1:1.9<br />
Table 4.3.8 The length of culture period (Days), number per cubic meter (N/m 3 ), initial weight<br />
(IW), final weight (FW), initial stocking density (ISDkg/m 3 ), final stocking density (FSDkg/m 3 ),<br />
percent stock retention (%SR), daily percentage growth (G%/day) and food conversion ratio<br />
(FCR) for silver perch (Bidyanus bidyanus) from the 02/03/01 up to 27/09/01 in 7 and 14m 3<br />
raceways. Where FCR values are not provided their calculation had been invalidated by a lack<br />
of growth, reduction in biomass through stock loss or both<br />
R’way Start Finish Days N/m 3 IW FW ISD FSD %SR G%/day FCR<br />
(g) (g) (kg/m 3 ) (kg/m 3 )<br />
SR1 07/11/01 29/01/02 83 1393 15.9 35.3 22.2 45.7 92.9 1.5 1:1.8<br />
SR2 07/11/01 29/01/02 83 1453 5.9 25.3 8.7 36.7 100 3.9 1:1.5<br />
SR3 07/11/01 29/01/02 83 977 10.4 22.5 10.2 22.0 100 1.4 1:4.1<br />
MR1 07/11/01 29/01/02 83 358 69.7 98.5 25.0 35.3 100 0.5 1:6.9<br />
MR2 07/11/01 29/01/02 83 1063 31.1 77.0 33.1 75.2 91.9 1.8 1:1.6<br />
MR3 07/11/01 29/01/02 83 332 198.3 189.0 65.9 62.8 100 -0.1 -<br />
Table 4.3.9 The length of culture period (Days), number per cubic meter (N/m 3 ), initial weight<br />
(IW), final weight (FW), initial stocking density (ISDkg/m 3 ), final stocking density (FSDkg/m 3 ),<br />
percent stock retention (%SR), daily percentage growth (G%/day) and food conversion ratio<br />
(FCR) for silver perch (Bidyanus bidyanus) from the 05/02/02 up to 07/05/02 in 7 and 14m 3<br />
raceways as well as a single 12m 3 raceway<br />
R’way Start Finish Days N/m 3 IW FW ISD FSD %S G%/day FCR<br />
(g) (g) (kg/m 3 ) (kg/m 3 ) R<br />
SR3 05/02/02 07/05/02 91 165 64.5 132.8 10.6 18.6 84.8 1.2 1:4.2<br />
MR1 05/02/02 22/04/02 76 984 13.8 31.3 13.6 30.6 99.1 0.4 1:2.9<br />
MR2 05/02/02 22/04/02 76 393 68.0 135.2 26.7 53.0 99.7 1.3 1:2.1<br />
MR3 05/02/02 07/05/02 91 883 30.7 61.2 27.1 54.9 99.1 1.1 1:2.1<br />
MR4 05/02/02 07/05/02 91 76 137.0 216.5 10.4 15.7 95.0 0.6 1:6.0<br />
MR5 05/02/02 22/04/02 76 90 253.0 299.3 22.8 26.8 99.2 0.2 1:8.6<br />
MR6 05/02/02 07/05/02 91 168 140.0 232.2 23.5 42.5 99.8 0.7 1:2.3<br />
M1 03/03/02 07/05/02 65 3636 1.3 7.2 4.6 21.8 83.8 7.2 1:1.7<br />
33