pdf download
pdf download
pdf download

Create successful ePaper yourself
Turn your PDF publications into a flip-book with our unique Google optimized e-Paper software.
Integrated Agri-Aquaculture<br />
Demonstration Facility<br />
Using irrigation storages for intensive native fish culture<br />
RIRDC Publication No. 09/060<br />
RIRDCInnovation for rural Australia
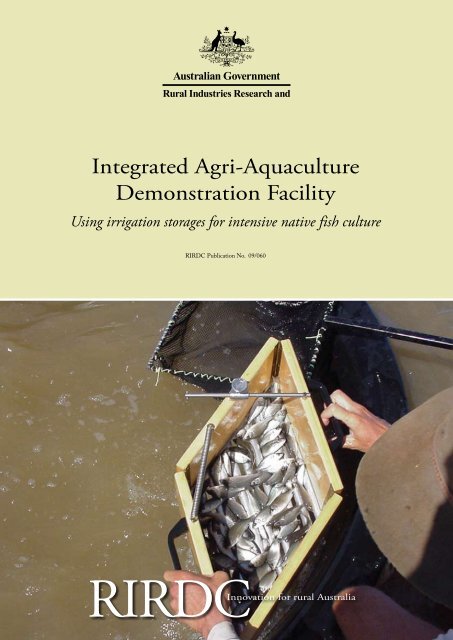
Integrated Agri-Aquaculture<br />
Demonstration Facility<br />
Using irrigation storages for intensive native fish culture<br />
By Dr Adrian Collins<br />
Mr Andrew Walls<br />
Mr Benjamin Russell<br />
April 2009<br />
RIRDC Publication No 09/060<br />
RIRDC Project No DAQ-290A
© 2009 Rural Industries Research and Development Corporation.<br />
All rights reserved.<br />
ISBN 1 74151 862 8<br />
ISSN 1440-6845<br />
Integrated Agri-Aquaculture Demonstration Facility - Using irrigation storages for intensive native fish culture<br />
Publication No. 09/060<br />
Project No. DAQ-290A<br />
The information contained in this publication is intended for general use to assist public knowledge and discussion<br />
and to help improve the development of sustainable regions. You must not rely on any information contained in<br />
this publication without taking specialist advice relevant to your particular circumstances.<br />
While reasonable care has been taken in preparing this publication to ensure that information is true and correct,<br />
the Commonwealth of Australia gives no assurance as to the accuracy of any information in this publication.<br />
The Commonwealth of Australia, the Rural Industries Research and Development Corporation (RIRDC), the<br />
authors or contributors expressly disclaim, to the maximum extent permitted by law, all responsibility and liability to<br />
any person, arising directly or indirectly from any act or omission, or for any consequences of any such act or<br />
omission, made in reliance on the contents of this publication, whether or not caused by any negligence on the<br />
part of the Commonwealth of Australia, RIRDC, the authors or contributors.<br />
The Commonwealth of Australia does not necessarily endorse the views in this publication.<br />
This publication is copyright. Apart from any use as permitted under the Copyright Act 1968, all other rights are<br />
reserved. However, wide dissemination is encouraged. Requests and inquiries concerning reproduction and rights<br />
should be addressed to the RIRDC Publications Manager on phone 02 6271 4165.<br />
Researcher Contact Details<br />
Dan Willett<br />
Project Leader Integrated Aquaculture<br />
c/- Bribie Island Aquaculture Research Centre<br />
PO Box 2066<br />
Bribie Island QLD 4507<br />
Phone: 07 3400 2000<br />
Fax: 07 3408 3535<br />
Email: bribie@dpi.qld.gov.au<br />
Website: www.dpi.qld.gov.au<br />
In submitting this report, the researcher has agreed to RIRDC publishing this material in its edited form.<br />
RIRDC Contact Details<br />
Rural Industries Research and Development Corporation<br />
Level 2, 15 National Circuit<br />
BARTON ACT 2600<br />
PO Box 4776<br />
KINGSTON ACT 2604<br />
Phone: 02 6271 4100<br />
Fax: 02 6271 4199<br />
Email: rirdc@rirdc.gov.au.<br />
Web: http://www.rirdc.gov.au<br />
Electronically published by RIRDC in April 2009<br />
Print-on-demand by Union Offset Printing, Canberra at www.rirdc.gov.au<br />
or phone 1300 634 313<br />
ii
Foreword<br />
The integration of aquaculture with traditional agriculture can provide a practical means for farmers to<br />
maximise their use of valuable water resources and infrastructure. This multiple use of water is<br />
practiced in many of the driest regions of the world where water is used, but not directly consumed, by<br />
the aquaculture operation and can then be used to irrigate the farm’s terrestrial crops.<br />
The Darling Downs region in southern Queensland is a hub for agriculture and contains large numbers<br />
of constructed water storages or ‘ring tanks’ to provide water for irrigation. The major irrigated crop in<br />
this region is cotton. The cotton industry’s access to this water infrastructure, and its location to<br />
markets and within the natural distribution of suitable native fish for culture, makes it a particularly<br />
suitable candidate to demonstrate the feasibility of integrating aquaculture into established farming<br />
operations. This project was an on-farm demonstration to highlight the needs, operational challenges<br />
and potential of integrated farming systems across rural Australia.<br />
The project screened a number of native fish species for their suitability to culture conditions in the<br />
farm’s primary water storage, within production systems that included floating cages and raceways.<br />
The floating raceways developed in this project were the first of their kind in Australia and proved to<br />
be an ideal fish culture system for permanent and non-specific water bodies (that is, water bodies not<br />
specifically designed as harvestable aquaculture ponds). This was due to their cost effectiveness and<br />
the improved management they offer in terms of stock inventory, feeding, growth and disease<br />
monitoring, predator control and harvesting.<br />
This study also highlighted the problems for integrating aquaculture with cotton production. In<br />
particular, integration requires changes to established water management practices to ensure adequate<br />
water quality is maintained for the aquaculture operation. Co-ordinating pumping events, maintaining<br />
appropriate volume in storages and managing overland flows from floods and tailwaters are vital for<br />
maintaining sound conditions for fish culture. Especially important is preventing pollutants such as<br />
pesticides from entering waters used for aquaculture due to the risk that pesticide residues can<br />
accumulate in fish tissues to unacceptable levels.<br />
Technically, aquaculture is a specialised discipline, and integrated operations with shared farm labour<br />
will require additional investment in aquaculture training to recognise and manage the needs of fish<br />
culture. However, the irrigation industry is well placed to make such investment because of its existing<br />
water infrastructure and because of its commitment to environmental management and sustainability.<br />
Successful integration would provide significant socio-economic benefits for growers as well as a<br />
number of other rural industries and their communities.<br />
The report, an addition to RIRDC’s diverse range of over 1800 research publications, forms part of our<br />
Environment and Farm Management R&D program which aims to support innovation in agriculture<br />
and the use of frontier technology to meet market demands for accredited sustainable production.<br />
Most of RIRDC’s publications are available for viewing, <strong>download</strong>ing or purchasing online at<br />
www.rirdc.gov.au. Purchases can also be made by phoning 1300 634 313.<br />
Peter O’Brien<br />
Managing Director<br />
Rural Industries Research and Development Corporation<br />
iii
Acknowledgments<br />
The authors would like to thank Mr Paul McVeigh and family for access to their farm, use of their<br />
facilities for demonstration and research activities, for the information provided concerning their<br />
whole of farm operations and general support for the project. Thanks also to Mark Taylor for his<br />
contribution to the conduct of onfarm trials.<br />
The authors would like to acknowledge the contributions and support of other DPI&F staff past and<br />
present, namely Peter Peterson, John Robertson, Paul Grieve, James Butler, Kelvin Spann, John<br />
Standley and Trent Lindsay.<br />
Abbreviations<br />
Abbreviation<br />
ABS<br />
ACG<br />
AGAL<br />
AGBOM<br />
AlSO 4<br />
APHA<br />
APVMA<br />
AQIS<br />
BCF<br />
BMP<br />
BOD<br />
CBWC<br />
cm<br />
CRDC<br />
DAFF<br />
DDD<br />
DDE<br />
DDT<br />
DO<br />
DPI&F<br />
EAR<br />
EPA<br />
ERL<br />
EXTOXNET<br />
FCR<br />
FL<br />
FSANZ<br />
FSDkg/m 3<br />
FW<br />
g<br />
G%/day<br />
GL<br />
ha<br />
HDPE<br />
hrs<br />
IAAS<br />
IPCS<br />
IPM<br />
IRR<br />
ISDkg/m 3<br />
IW<br />
Meaning<br />
Australian Bureau of Statistics<br />
The Australian Cotton Grower<br />
Australian Government Analytical Laboratories<br />
Australian Government Bureau of Meteorology<br />
Aluminium sulphate<br />
American Public Health Association<br />
Australian Pesticides and Veterinary Medicines Authority<br />
Australian Quarantine and Inspection Service<br />
Bio-concentration factors<br />
Best Management Practices<br />
Biological oxygen demand<br />
Condamine-Balonne Water Committee<br />
Centimetre<br />
Cotton Research and Development Corporation<br />
Department of Agriculture Fisheries & Forestry<br />
Dichlorodiphenyldichloroethane<br />
Dichlanodiphenyldichloroethylene<br />
Dichlorodiphenyltrichloroethane<br />
Dissolved oxygen<br />
Department of Primary Industries and Fisheries<br />
Equivalent Annual Return<br />
Environmental Protection Agency<br />
Extraneous residue limit<br />
Extension Toxicology Network<br />
food conversion rate<br />
Floor<br />
Food Standards Australia New Zealand<br />
Final stocking density<br />
Final weight<br />
Grams<br />
Daily percentage growth<br />
Giga litre<br />
Hectares<br />
High density polyethylene<br />
Hours<br />
Integrated Agri-Aquaculture Systems<br />
International Programme on Chemical Safety<br />
Integrated Pest Management<br />
Internal Rate of Return<br />
Initial stocking density<br />
Initial weight<br />
iv
Abbreviation Meaning<br />
kg<br />
Kilograms<br />
km<br />
Kilometres<br />
L<br />
Litre<br />
LC<br />
Lethal concentration<br />
LOQ<br />
Limit of Quantitation<br />
m<br />
Metre<br />
m 3<br />
Cubic metres<br />
mg<br />
Milligram<br />
mg/L<br />
Milligrams per litre<br />
min<br />
Minutes<br />
ML<br />
Mega litre<br />
ml<br />
Millilitres<br />
mm<br />
Millimetres<br />
MPR<br />
Modular plastic raceways<br />
MRL<br />
Maximum residue limit<br />
N<br />
Nitrogen<br />
N/m 3<br />
Number per cubic meter<br />
NPTN<br />
National Pesticide Telecommunications Network<br />
NPV<br />
Net present value<br />
NRA<br />
National Registration Authority<br />
NRS<br />
National Residue Survey<br />
OC<br />
Organochlorine<br />
ºC Degrees Celsius<br />
OP<br />
Organophosphate<br />
P<br />
Phosphorus<br />
P/L<br />
Proprietary Limited<br />
PAC<br />
Powdered activated carbon<br />
PAN<br />
Pesticide Action Network<br />
PIRSA<br />
Primary Industries and Resources South Australia<br />
PMEP<br />
Pesticide Management Education Program<br />
ppt<br />
Parts per thousand<br />
PV<br />
Present value<br />
RIRDC Rural Industries Research and Development Corporation<br />
SF<br />
Surface water<br />
SP<br />
Synthetic pyrethroids<br />
sp.<br />
Species<br />
t<br />
Tonne<br />
TAMCO Total Aquaculture Management Company<br />
TKN<br />
Total Kjeldahl Nitrogen<br />
TKP<br />
Total Kjeldahl Phosphorous<br />
USA<br />
United States of America<br />
USEPA United States Environmental Protection Agency<br />
V<br />
Volt<br />
VDPI<br />
Victorian Department of Primary Industries<br />
WHO<br />
World Health Organization<br />
βHCH<br />
Beta hexachlorocyclohexane<br />
μg/l<br />
Micrograms per litre<br />
v
Contents<br />
Foreword ............................................................................................................................................... iii<br />
Acknowledgments................................................................................................................................. iv<br />
Abbreviations........................................................................................................................................ iv<br />
List of Figures .................................................................................................................................... ix<br />
Executive Summary ............................................................................................................................. ix<br />
What the report is about ...................................................................................................................... x<br />
Who the report is targeted at ............................................................................................................... x<br />
Background ......................................................................................................................................... x<br />
Aims .................................................................................................................................................... x<br />
Methods used...................................................................................................................................... xi<br />
Results ................................................................................................................................................ xi<br />
Implications and Recommendations.................................................................................................. xii<br />
1. Introduction ....................................................................................................................................... 1<br />
2. Demonstration Farm......................................................................................................................... 4<br />
2.1 Background ................................................................................................................................... 4<br />
2.2 Aquaculture Systems..................................................................................................................... 5<br />
2.3 Fish Species................................................................................................................................... 7<br />
3. Water Use and Quality...................................................................................................................... 8<br />
3.1 Background ................................................................................................................................... 8<br />
3.2 Materials and Methods .................................................................................................................. 8<br />
3.3 Results ........................................................................................................................................... 9<br />
3.4 Discussion ................................................................................................................................... 15<br />
4. Production Systems and Growth ................................................................................................... 18<br />
4.1 Background ................................................................................................................................. 18<br />
4.2 Materials and Methods ................................................................................................................ 18<br />
4.3 Results ......................................................................................................................................... 27<br />
4.4 Discussion ................................................................................................................................... 37<br />
5. Pesticide Monitoring and Residues................................................................................................ 42<br />
5.1 Background ................................................................................................................................. 42<br />
5.2 Materials and Methods ................................................................................................................ 43<br />
5.3 Pesticide Bio-concentration and Depuration............................................................................... 45<br />
5.4 Results ......................................................................................................................................... 47<br />
5.5 Discussion ................................................................................................................................... 50<br />
6. Integrated Production Decision Tool............................................................................................. 55<br />
6.1 Description .................................................................................................................................. 55<br />
7. General Discussion .......................................................................................................................... 56<br />
Appendix 1 ........................................................................................................................................... 58<br />
References ............................................................................................................................................ 72<br />
vi
Tables<br />
Table 3.3.1<br />
Table 3.3.2<br />
Table 3.3.3<br />
Table 3.3.4<br />
Table 3.3.5<br />
Table 4.3.1<br />
Table 4.3.2<br />
Table 4.3.3<br />
Table 4.3.4<br />
Table 4.3.5<br />
Table 4.3.6<br />
Table 4.3.7<br />
Table 4.3.8<br />
Table 4.3.9<br />
Table 4.3.10<br />
Source, timing and duration of water harvesting activities at Loch Eaton from October<br />
2000 to February 2004 ............................................................................................................... 9<br />
Average monthly morning surface (SF) and floor (FL) dissolved oxygen levels (mg/L) in the<br />
aquaculture ring tank from November 2000 to March 2004 (mean ± standard deviation) ...... 11<br />
Average monthly afternoon ring tank surface (SF) and floor (FL) dissolved oxygen levels<br />
(mg/L) from November 2000 to March 2004 (mean ± standard deviation)............................. 12<br />
Average monthly morning ring tank surface (SF) and floor (FL) water temperatures from<br />
November 2000 to March 2004 (mean ± standard deviation).................................................. 12<br />
Average monthly afternoon ring tank surface (SF) and floor (FL) water temperatures from<br />
November 2000 to March 2004 (mean ± standard deviation).................................................. 13<br />
Number and volume of net cages and floating raceways in operation at Loch Eaton from<br />
September 2000 through to March 2004.................................................................................. 28<br />
List of known stock escape events at Loch Eaton, estimated numbers of fish lost and the<br />
observed cause of each escape event........................................................................................ 28<br />
The length of culture period (Days), number per cubic meter (N/m 3 ), initial weight (IW), final<br />
weight (FW), initial stocking density (ISDkg/m 3 ), final stocking density (FSDkg/m 3 ) and daily<br />
percentage growth (G%/day) for silver perch (Bidyanus bidyanus) held in 8 and 100m 3 net<br />
cages from the 07/12/00 up to the 31/01/01 ............................................................................. 30<br />
The length of culture period (Days), number per cubic meter (N/m 3 , initial weight (IW), final<br />
weight (FW), initial stocking density (ISDkg/m 3 ), final stocking density (FSDkg/m 3 ), percent<br />
stock retention (%SR) and daily percentage growth (G%/day) for silver perch (Bidyanus<br />
bidyanus) held in 8 and 100m 3 net cages from the 30/01/01 up to 26/04/01 in 8 and 100m 3 net<br />
cages......................................................................................................................................... 30<br />
.The length of culture period (Days), number per cubic meter (N/m 3 ), initial weight (IW), final<br />
weight (FW), initial stocking density (ISDkg/m 3 ), final stocking density (FSDkg/m 3 ), percent<br />
stock retention (%SR) and daily percentage growth (G%/day) for silver perch (Bidyanus<br />
bidyanus) held in 8 and 100m 3 net cages from the 02/03/01 up to 27/09/01 in 8 and 100m 3 net<br />
cages......................................................................................................................................... 30<br />
The length of culture period (Days), number per cubic meter (N/m 3 ), initial weight (IW), final<br />
weight (FW), initial stocking density (ISDkg/m 3 ), final stocking density (FSDkg/m 3 ), stock<br />
retention (%SR) and daily percentage growth (G%/day) for silver perch (Bidyanus bidyanus)<br />
from the 02/03/01 up to 27/09/01 in 7 and 14m 3 raceways...................................................... 31<br />
The length of culture period (Days), number per cubic meter (N/m 3 ), initial weight (IW), final<br />
weight (FW), initial stocking density (ISDkg/m 3 ), final stocking density (FSDkg/m 3 ), percent<br />
stock retention (%SR) daily percentage growth (G%/day) and food conversion ratio (FCR)for<br />
silver perch (Bidyanus bidyanus) from the 02/03/01 up to 27/09/01 in 7 and 14m 3 raceways 33<br />
The length of culture period (Days), number per cubic meter (N/m 3 ), initial weight (IW), final<br />
weight (FW), initial stocking density (ISDkg/m 3 ), final stocking density (FSDkg/m 3 ), percent<br />
stock retention (%SR), daily percentage growth (G%/day) and food conversion ratio (FCR) for<br />
silver perch (Bidyanus bidyanus) from the 02/03/01 up to 27/09/01 in 7 and 14m 3 raceways. 33<br />
The length of culture period (Days), number per cubic meter (N/m 3 ), initial weight (IW), final<br />
weight (FW), initial stocking density (ISDkg/m 3 ), final stocking density (FSDkg/m 3 ), percent<br />
stock retention (%SR), daily percentage growth (G%/day) and food conversion ratio (FCR) for<br />
silver perch (Bidyanus bidyanus) from the 05/02/02 up to 07/05/02 in 7 and 14m 3 raceways as<br />
well as a single 12m 3 raceway.................................................................................................. 33<br />
The length of culture period (Days), number per cubic meter (N/m 3 ), initial weight (IW), final<br />
weight (FW), initial stocking density (ISDkg/m 3 ), final stocking density (FSDkg/m3), percent<br />
stock retention (%SR), daily percentage growth (G%/day) and food conversion ratio (FCR) for<br />
silver perch (Bidyanus bidyanus) from the 19/07/02 up to 21/10/02 in 7 and 14m 3 raceways. 34<br />
vii
Table 4.3.11<br />
Table 4.3.12<br />
Table 4.3.13<br />
Figure 4.4.1<br />
Table 5.1.1<br />
The length of culture period (Days), number per cubic meter (N/m 3 ), initial weight (IW), final<br />
weight (FW), initial stocking density (ISDkg/m 3 ), final stocking density (FSDkg/m 3 ), percent<br />
stock retention (%SR), daily percentage growth (G%/day) and food conversion ratio (FCR) for<br />
silver perch (Bidyanus bidyanus) from the 06/11/02 up to 18/02/03 in 12 and 17.5m 3 raceways<br />
as well as a single 14m 3 raceway.............................................................................................. 36<br />
The length of culture period (Days), number per cubic meter (N/m 3 ), initial weight (IW), final<br />
weight (FW), initial stocking density (ISDkg/m 3 ), final stocking density (FSDkg/m 3 ), percent<br />
stock retention (%SR), daily percentage growth (G%/day) and food conversion ratio (FCR) for<br />
silver perch (Bidyanus bidyanus) from the 20/02/02 up to 25/03/03 in 12 and 17.5m 3<br />
raceways. .................................................................................................................................. 37<br />
The length of culture period (Days), number per cubic meter (N/m 3 ), initial weight (IW), final<br />
weight (FW), initial stocking density (ISDkg/m 3 ), final stocking density (FSDkg/m 3 ), percent<br />
stock retention (%SR), daily percentage growth (G%/day) and food conversion ratio (FCR) for<br />
silver perch (Bidyanus bidyanus) from the 08/04/03 up to 08/04/04 in 12, 17.5 and 23m 3<br />
raceways. 37<br />
Existing (E) and recommended (R) locations of aquaculture facilities and pumping<br />
infrastructure at Loch Eaton. Relocation of the floating raceway facility from the primary ring<br />
tank to the adjacent storage would serve to buffer the aquaculture facility from acute falls in<br />
dissolved oxygen as the result of harvesting large volumes of oxygen deficient, highly turbid<br />
flood waters.............................................................................................................................. 40<br />
Extraneous Residue Limits (ERL) for agricultural chemicals in whole fish (minus gut)<br />
according to Food Standards Australia New Zealand, Australia New Zealand Food Standards<br />
Code (FSANZ, 2006) ............................................................................................................... 42<br />
Table 5.2.1 List of agri-chemicals used at Loch Eaton from February 2001 to May 2003......................... 44<br />
Table 5.2.2<br />
Table 5.2.3<br />
List of organochlorine, organophosphate and pyrethroid compounds included in analytical<br />
testing of riverine and ring tank water samples........................................................................ 44<br />
List of organochlorine, organophosphate and synthetic pyrethroid compounds included in<br />
analytical testing of fish samples.............................................................................................. 45<br />
Table 5.4.1 Ranges of agents detected in Ring tank water.......................................................................... 47<br />
Table 5.4.2 Ranges of agents detected in River water................................................................................. 47<br />
viii
Figures<br />
Figure 2.1.1<br />
Area map of McVeigh Brothers properties Loch Eaton and Timberline located near Dalby,<br />
Queensland...................................................................................................................................... 4<br />
Figure 2.1.2 Layout of the McVeigh Brothers properties showing farm infrastructure...................................... 5<br />
Figure 2.2.3 Net cages used for silver perch and Murray cod production in the ring tank at Loch Eaton .......... 6<br />
Figure 2.2.4 Floating raceway system developed for intensive fish production deployed in the ring tank at<br />
Loch Eaton ........................................................................................................................................ 6<br />
Figure 3.3.1 Daily turbidity readings for the aquaculture ring tank from January 2001 to March 2004 reported<br />
weekly. The red dashed line indicates a major riverine pumping event ....................................................... 14<br />
Figure 3.3.2 Total Kjeldahl Nitrogen (TKN) and Total Kjeldahl Phosphorous (TKP) in the Condamine River<br />
and Loch Eaton ring tank waters. ................................................................................................... 15<br />
Figure 4.2.1 Net cages 8m 3 used for silver perch and Murray cod fingerlings and juveniles.............................. 19<br />
Figure 4.2.2 Net cages 100m 3 used for silver perch grow out ............................................................................. 19<br />
Figure 4.2.3 The first 7m 3 floating plastic raceway being stocked with silver perch fingerlings at Loch Eaton. 20<br />
Figure 4.2.4 The first 14m 3 floating plastic raceways were constructed from HPDE sheets welded to rectangular<br />
pontoons that provided buoyancy.................................................................................................... 20<br />
Figure 4.2.5 The first 12m 3 TAMCO roto-moulded raceways in use at Loch Eaton .......................................... 21<br />
Figure 4.2.6 A bank of uplifts (100mm) drives the water exchange through each of the raceway units............. 21<br />
Figure 4.2.7 Uplift, baffle board and end screen of raceways ............................................................................. 22<br />
Figure 4.2.8 Water flow characteristics of raceways without an eddy board ...................................................... 23<br />
Figure 4.2.9 Water flow characteristics of raceways with an eddy board placed 120cm from the water entrance<br />
and extended 20cm from the surface............................................................................................... 23<br />
Figure 4.2.10 Purging tanks (10m 3 ) supplied with degassed bore water were used to clear silver perch of ‘off<br />
flavour’ taints .................................................................................................................................. 24<br />
Figure 4.2.11 Drum nets used to assess the potential for re-capturing ‘live’ silver perch and Murray cod stocked<br />
into the ring tank.............................................................................................................................. 25<br />
Figure 4.2.12 Box grader used for grading fingerling and juvenile silver perch and Murray cod ...................... 25<br />
Figure 4.2.13 Raceway push gate grader used to passively grade fish within the raceway and also to crowd fish<br />
for harvest and transfer activities..................................................................................................... 26<br />
Figure 4.2.14 Fish transfer hopper used to move fish during stocking, grading, stock transfer or harvesting<br />
activity ............................................................................................................................................. 26<br />
Figure 4.4.1 Existing (E) and recommended (R) locations of aquaculture facilities and pumping infrastructure at<br />
Loch Eaton. ..................................................................................................................................... 40<br />
Figure 5.4.1 Pesticide levels in ring tank water from November 2001 until March 2003................................... 48<br />
Figure 5.4.2 Pesticide levels in river water from November 2001 until March 2003.......................................... 49<br />
Figure 5.4.3 Concentration of pesticides in muscle tissue of silver perch (Bidyanus bidyanus) maintained at<br />
15ºC and exposed to 1 μg/L heptachlor, dieldrin, endosulfan sulphate, chlorpyrifos, p,p-DDE, o,p-<br />
DDE, metolachlor, lindane and β-BHC for 96hrs then transferred to clean water for a period of up<br />
to 28 days......................................................................................................................................... 49<br />
Figure 5.4.4 Concentration of pesticides in muscle tissue of silver perch (Bidyanus bidyanus) maintained at<br />
25ºC and exposed to 1 μg/L heptachlor, dieldrin, endosulfan sulphate, chlorpyrifos, p,p-DDE, o,p-<br />
DDE, metolachlor, lindane and β-BHC for 96hrs then transferred to clean water for a period of up<br />
to 28 days......................................................................................................................................... 50<br />
Figure 6.1.1 Example of spreadsheet based decision tool ................................................................................... 55<br />
ix
Executive Summary<br />
What the report is about<br />
This report shows how the water infrastructure developed by the cotton industry for such large scale<br />
irrigation may also have potential for development of aquaculture. The introduction of an additional<br />
cropping opportunity may have significant economic, environmental and social benefits. It does<br />
however, also face several operational challenges that stem from the need to manage these water<br />
bodies and the farm’s other activities in a more intensive and considered fashion.<br />
Who the report is targeted at<br />
This report is targeted at irrigators who may be interested in diversifying their business by integrating<br />
commercial aquaculture with irrigated agriculture. It focuses on a demonstration site in the cotton<br />
industry in Queensland, but contains valuable information for potential investors throughout Australia.<br />
The report includes detailed analysis of the research undertaken on site and would be of interest to the<br />
Australian aquaculture industry and researchers interested in environmental impacts on Australian<br />
native fish.<br />
Background<br />
There are many thousands of hectares of water storage on cotton farms in Australia. Australia<br />
consumes approximately 22,185 GL of water annually of which about seventy percent (15,502 GL) of<br />
the total water used is consumed for agricultural production and approximately 11.9 per cent (or 1,840<br />
GL) of this is consumed by the cotton industry (Dalton, Raine, & Broadfoot, 2001). In Queensland<br />
cotton farmers are the second major industry user of freshwater in the State.<br />
The opportunity to utilise large water storage infrastructure for aquaculture is well recognised and is a<br />
common practice in many countries. However, the scale of these activities is often limited with largescale<br />
integrated agri-aquaculture being non-existent in Australia. A clear opportunity exists to utilise<br />
these resources, diversify farming operations, and deliver significant socio-economic benefits.<br />
To test this opportunity in Australia, an integrated aquaculture demonstration site at an irrigated cotton<br />
enterprise, ‘Loch Eaton’, 14 KM south of Dalby on the Darling Downs in Queensland was used. The<br />
development of the aquaculture enterprise was managed by the farm operators, McVeigh Brothers Inc.<br />
as were the farm’s irrigation activities and chemical spray events.<br />
The aquaculture trial screened a number of native fish species for their suitability to culture conditions<br />
in the farm’s existing on site cotton irrigation water storages or ‘ring tanks’, which are common to the<br />
area. These storages received water by pumping riverine flows and also from the farm’s groundwater<br />
supplies.<br />
Aims<br />
The aim of the project was to study how aquaculture was introduced into the irrigated cotton<br />
enterprise. This site was used as a demonstration facility for industry and to record the progress of the<br />
site’s development, its challenges and potential for replication.<br />
Specifically the aims of the study were to:<br />
• Develop an integrated agri-aquaculture demonstration site in on-farm water storages typically used<br />
for irrigated agriculture on the Darling Downs.<br />
• Conduct on-farm extensive production trials using Silver and Golden Perch and intensive<br />
production trials using Silver Perch and Murray Cod.<br />
• Demonstrate the potential for improved utilisation of water resources and the resultant economic<br />
and environmental benefits, by developing and quantifying robust farm diversification strategies.<br />
• Utilise the demonstration site for practical extension activities highlighting the needs and potential<br />
of integrated farming systems across rural Australia.<br />
x
Methods used<br />
Assessment of the site occurred over three years and involved monitoring fish growth, stocking<br />
practices, pesticide events, water quality, fish health, general husbandry needs and practices. Included<br />
in this assessment was consideration of how the aquaculture operation impacted on the farm’s existing<br />
cotton operations, its management, maintenance of water resources and use of water on farm. An<br />
important component of this study assessed how the farm’s pesticide management practices changed<br />
to comply with the needs of the site’s aquaculture operations<br />
Results<br />
The results from the three seasons of site development, monitoring, trials and training exercises<br />
demonstrated that cotton irrigators can integrate aquaculture/irrigation operations, but only with<br />
careful site selection, and the appropriate level of investment and technical expertise.<br />
The on-farm extensive production trials using Silver and Golden Perch and intensive production trials<br />
using Silver Perch and Murray Cod had unsatisfactory rates of growth for commercial production<br />
primarily due to problems with poor water quality following significant riverine pumping events. The<br />
harvest of water from the Condamine River occurred typically during flow events that resulted in large<br />
volumes of water with high turbidity and low dissolved oxygen levels to be pumped into the ring tank<br />
where the aquaculture trial was situated. These events not only resulted in significant mortalities<br />
associated with the low dissolved oxygen levels but also served to retard growth over an extended<br />
period because of the longer term impacts on water quality.<br />
These poor fish growth rates, clearly showed that aquaculture systems used must be located in a<br />
storage that does not directly receive flood or tail waters. Alternatively, these systems should<br />
incorporate capacity to be isolated from poor quality surface waters for short periods in order to avoid<br />
severe fluctuations in water quality.<br />
The study also showed that aquaculture sites must be protected from potential pesticide spray drifts<br />
from adjacent cotton production. There was only one detection of a compound in fish through the<br />
monitoring period. This event was most likely due to an off site aerial application of pesticide that<br />
drifted across the ring tank. Once identified and addressed no further spray drift events were detected.<br />
In addition to improved on farm pesticide management practices, pesticide use within the cotton<br />
industry has fallen significantly since the study was implemented. Such trends are expected to<br />
continue as industry Best Management Practices including Integrated Pest Management strategies and<br />
the introduction of disease resistant seed strains continue to be adopted by the cotton industry. Overall,<br />
the pesticide risk from adjacent cotton production was shown to be low and manageable.<br />
Significantly, the study developed and refined a more cost effective in-pond floating raceway system<br />
suitable for intensive production in environments not specifically designed for aquaculture. Although<br />
initially focusing on cage culture of native fish, the floating raceway system developed through the<br />
course of the project provided benefits of more efficient operation and greater security of stock. This<br />
was due to their cost effectiveness and the improved management they offer in terms of stock<br />
inventory, feeding, growth and disease monitoring, predator control and harvesting. Cage systems by<br />
comparison proved difficult to manage and were abandoned by the operator.<br />
Although the raceway system proved to be a durable approach to intensive fish culture, the primary<br />
factor limiting the aquaculture production in ring tanks is the availability and quality of surface water.<br />
The raceways demonstrated an ability to hold freshwater fish at high density but growth of larger fish<br />
in this system still was not commercial, due to the riverine pumping event outlined above.<br />
The issue of whole of farm water supply during periods of drought has serious implications for the<br />
integrated fish/cotton farmer. During this study, water for irrigation of cotton was limited and the farm<br />
relied heavily on its groundwater allocations. This allowed maintenance of low levels of surface water<br />
within the ring tank to maintain the aquaculture operation. However, for farms without access to<br />
sufficient groundwater supplies the cost of maintaining surface water in ring tanks may outstrip the<br />
return from the aquaculture facility. Therefore, the size of aquaculture operations in cotton ring tanks<br />
must provide a higher return from available water supplies than is returned from an irrigated cotton<br />
xi
crop. This is much higher than simply the cost of producing the cotton in a given year because of the<br />
need to absorb ongoing costs associated with the investment into the infrastructure and machinery<br />
associated with the cotton operation. Therefore, in order to achieve profitable integration through<br />
multiple use of water storages, an aquaculture operation must not place significant demands on the<br />
farm’s water resources. Systems like the floating raceways used in this study enable the water depth in<br />
ring tanks to be lowered to a minimal depth. This is beneficial as unlike cages that require a greater<br />
functional water depth, the raceway systems can operate in less water and therefore make more water<br />
available for irrigation.<br />
The economics of farm integration are complex as many of the inputs, resources and infrastructure are<br />
shared across the farm’s operations. As part of this study an Excel based spreadsheet decision tool was<br />
developed to assist growers investigate the potential for integrating aquaculture into their farm<br />
operations. Intended as a guide only, this model indicates that the demonstration farm’s overall<br />
profitability could be improved substantially if the documented technical and operational challenges<br />
faced during this study can be overcome.<br />
Implications and Recommendations<br />
It is clear from this study that while the aquaculture potential of these regions and infrastructure is<br />
high, there are existing issues concerning the methods and timing of water harvesting, the species<br />
used, the method of farming and the associated demands on the farm operators. The level of intensity<br />
and scale of production must be well matched to the skill of the proponent and the available<br />
infrastructure. Considered placement of the aquaculture operation will determine the success of the<br />
operation and its ability to expand.<br />
In conclusion, the irrigation industry is well placed to invest in the production of additional crops from<br />
their available water resources and infrastructure, the cotton industry is particularly well placed<br />
because of its commitment to environmental management and sustainability.<br />
It is recommended that irrigators seeking to introduce aquaculture into their existing farming<br />
enterprises investigate:<br />
• The impact of retaining up to 3m of water within the aquaculture storage on the farms irrigated<br />
crops.<br />
• The risk associated with servicing a new and highly technical farming enterprise.<br />
• The cost of additional training requirements for new and existing staff.<br />
• The minimum size that the aquaculture enterprise must achieve compared to the capacity that<br />
exists within their farm infrastructure.<br />
• The species that is optimal for their proposed system (extensive, semi-intensive or intensive).<br />
• The ability of the farm to maintain water supplies indefinitely.<br />
xii
1. Introduction<br />
1.1 General Background<br />
Large volumes of water are harvested in southern Queensland and stored for production of agricultural<br />
crops. On the Darling Downs hundreds of water storage or ‘ring tanks’ have been built by irrigators to<br />
hold many thousands of mega litres water. The major irrigated crop in this region is cotton. In<br />
Queensland 2001/2002 there were 96,700 hectares (ha) planted with cotton of which 79,800ha was<br />
irrigated production, of this the Darling Downs accounted for a total of 44,000ha of which 28,00ha<br />
was irrigated (ACG, 2006).<br />
Australia consumes approximately 22,185 GL of water annually of which about seventy percent<br />
(15,502 GL) of the total water used is consumed for agricultural production of which approximately<br />
11.9 per cent (or 1,840 GL) is consumed by the cotton industry (Dalton, Raine, & Broadfoot, 2001).<br />
The cotton industry is second only to the horticultural industry in terms of value derived from the<br />
water resource (ABS, 2000) returning a farm gate value of approximately $613 per ML consumed<br />
(Dalton, et.al, 2001).<br />
The Australian Bureau of Statistics (ABS) reports that for 2002/2003 Australian irrigated cotton<br />
farmers used an average of 6.5 ML/ha of water (ABS, 2006). The cost of water in real terms is<br />
increasing for growers and farm diversification is becoming an increasingly important consideration<br />
for farmers seeking to obtain more value from their water allocations and infrastructure. As a<br />
consequence of the cotton industry’s access to water and associated infrastructure, opportunity exists<br />
to integrate aquaculture into established cotton farming operations. Successful integration would<br />
provide significant socio-economic benefits for cotton growers as well as a number of other rural<br />
industries and their communities.<br />
Estimates of surface water storage capacities for the Condamine River catchment (Darling Downs<br />
region) are as follows. There are approximately 2,679 ring tank type storages with a total surface area<br />
of 6,115 ha with individual storages being about 2.28 ha in size on average. Palustrine/lacustrine<br />
water bodies that have been converted, completely or mostly, to a ring tank or other controlled storage<br />
account for an additional 305 storages with a total surface area of 763 ha with individual storages<br />
being about 2.5 ha in size (EPA, 2006).<br />
Fish farming as an integrated operation with irrigated cotton production is not a new concept and has<br />
been successfully practised with furrow and drip schemes in the United States and Israel. Potential<br />
exists to incorporate the same practices on Australian farms. Existing cotton water storages or ‘ring<br />
tanks’ vary in size from 10 to 50 ha with depths ranging from 4 to 7 m. These storages are usually<br />
filled by pumping riverine and overland flows when available. In some cases, a farms groundwater<br />
supplies are also used to supplement surface water supplies. In assessing the potential of individual<br />
ring tanks for fish production not only must the location and design of the ring tank be considered but<br />
so must the availability, source and quality of the farms water supplies and its use of agricultural<br />
chemicals.<br />
The depth of water held in any ring tank varies in accordance with a farms irrigation schedule, river<br />
flows, on farm rainfall patterns, evaporation rates and seepage. The depth of most storages means that<br />
there is potential for stratification of the water body which can result in oxygen levels in the deeper<br />
portion of the storage to become depleted while the levels in surface layers remain normal. This lack<br />
of mixing has the potential to cause problems for aquaculture when seasonal climatic conditions cause<br />
the water body to ‘turn’. Such an event brings the low oxygen water to the surface and in contact with<br />
fish and can result in death of fish in severe cases. The risks posed to aquaculture in cotton ring tanks<br />
by seasonal stratification needs to be assessed and any means of mitigating its impact determined.<br />
The timing and path by which water enters a ring tank will be of critical importance in determining the<br />
quality and quantity of water available for aquaculture. Water bodies that are highly turbid (has high<br />
levels of suspended solids such as fine clays) and have low dissolved oxygen levels are usually<br />
unsuitable for fish culture. Studies on catchments with predominant agricultural developments have<br />
1
documented such waters types as being associated with river flow or flood events (CBWC, 2002).<br />
Low dissolved oxygen levels will slow fish growth, can induce stress (which leads to disease<br />
outbreaks) and if severe enough, will result in significant to total mortality of the farms stock. The<br />
optimal range for native fish culture is recommended to be 4.5 mg/L or above (PIRSA, 2003). In<br />
ponds specifically built for aquaculture, algal growth is managed to provide such levels of oxygen.<br />
However, in water bodies that receive highly turbid waters algal growth is suppressed and problems<br />
associated with low dissolved oxygen levels become difficult to manage. Turbidity can also result in<br />
sediment build up within the gills of fish and in some cases even damage the gill themselves, resulting<br />
in further problems associated with fish growth, disease and survival. The short and long term impacts<br />
of water harvesting activities on the quality of water in a cotton storage needs to be assessed in order<br />
to determine their potential use for commercial aquaculture. The reliability of water supplies will also<br />
be an issue for an aquaculture operation that is integrated with a cotton farm. Most cotton storages are<br />
fully utilised by growers during the cropping cycle. Water consumption per hectare of production for<br />
cotton consumes about 8 ML/ha, of water (Mc Veigh, 2003). This water is accessed from seasonal<br />
flows which in some years may not be adequate to fulfil the needs of both the aquaculture and cotton<br />
farming enterprises. Therefore, although the cotton industry as a whole has access to a large volume of<br />
water, only farms that have appropriately located water storages, reliable pumping conditions and<br />
adequate groundwater allocations are likely to be suitable for large scale integrated aquaculture<br />
development. On these farms water management practices are likely to change significantly in order to<br />
enable aquaculture to co-exist with traditional crops. Assessment of the commercial development of<br />
aquaculture on a cotton farm with a favourable layout, an adequate natural resource base and the<br />
necessary infrastructure support is required to demonstrate the true potential of integrated farming<br />
practices within Australia’s cotton industry.<br />
Water harvesting during periods of high riverine flow also raises the risk of exposure to agricultural<br />
pollutants such as pesticides that can be highly toxic to fish (Kelly & Kohler, 1997). Endosulfan, is<br />
one pesticide that has been widely used historically on cotton farms in NSW and Queensland to treat<br />
for heliothis caterpillar infestations (Constable, Llewellyn, & Reid, 1998.). Endosulfan is recognised<br />
as being associated with several fish kills within the Murray Darling Basin (Napier, Fairweather &<br />
Scott, 1998). Chlorpyrifos is also toxic to fish and has been detected in 10.5 per cent of farmed catfish<br />
in the Untied States of America (Wan, Santerre & Deardoff, 2000). It is the aerial application of these<br />
pesticides that is likely to pose the major route of contamination and therefore threat, to any<br />
aquaculture operation. Spray drifts of agents like endosulfan and chlorpyrifos are highly toxic to fish<br />
and can move up to 500 m from the point of their application (Craig, Woods & Dorr, 1998). Yet it is<br />
not only the short term distress and damage these agents can do to fish that is of concern to an<br />
integrated fish farmer. It is the possibility that these agents can also rapidly accumulate in fish tissues<br />
to unacceptable levels either from direct absorption from the water column or through the food chain.<br />
As these compounds have not been approved for use on fish, an unacceptable level is any detection of<br />
these compounds as this will render market fish unsuitable for sale.<br />
The issue of pesticide management within the cotton industry is being addressed through industry<br />
programs that improve the application and reduce the reliance on agricultural chemicals. This program<br />
is the Best Management Practices (BMP) program. The BMP program represents the industries<br />
commitment to reducing the impacts of cotton farming on the natural environment, its neighbours,<br />
workers and the wider community. The BMP program has been designed to assist growers identify<br />
and manage risks, design farms that minimise environmental impact, use pesticide in a safe and<br />
responsible manner as well as use all available options to control pests (Cotton Australia). This<br />
includes encouraging thus introduction of new cotton varieties that require less pesticide than<br />
conventional varieties. During the last decade, the use of new cotton varieties has provided a<br />
foundation for the rapid adoption of Integrated Pest Management (IPM) practices, which in turn have<br />
helped reduce overall insecticide use by 70 per cent (CRDC, 2005). The introduction of Ingard cotton<br />
and more recently Bollgard II, have reduced chemical use significantly. The direction of the Australian<br />
cotton industry towards IPM and reduced reliance on chemicals is favourable for the long term<br />
development of aquaculture in cotton growing regions. However, the current risks associated with<br />
pesticide use need to be assessed in order to understand the future benefits of changing pesticide use<br />
patterns on the viability of aquaculture development in cotton catchments.<br />
2
1.2 Objectives<br />
This project was undertaken to demonstrate the potential for integrating an aquaculture operation into<br />
an established cotton farm in Queensland. It was undertaken in collaboration with an industry partner<br />
McVeigh Enterprises, who were in the first stages of establishing a pilot commercial aquaculture<br />
enterprise at their Loch Eaton Property on the Darling Downs in southern Queensland. Specifically the<br />
aims of the study were to:<br />
• Develop an integrated agri-aquaculture demonstration site in on-farm water storages typically used<br />
for irrigated agriculture on the Darling Downs.<br />
• Conduct on-farm extensive production trials using Silver and Golden Perch and intensive<br />
production trials using Silver Perch and Murray Cod.<br />
• Demonstrate the potential for improved utilisation of water resources and the resultant economic<br />
and environmental benefits, by developing and quantifying robust farm diversification strategies.<br />
• Utilise the demonstration site for practical extension activities highlighting the needs and potential<br />
of integrated farming systems across rural Australia.<br />
3
2. Demonstration Farm<br />
2.1 Background<br />
The key objective of this project was to establish a demonstration site in collaboration with industry<br />
partner McVeigh Brothers P/L. The purpose of this site was to present the concept of integrated<br />
farming to other irrigators while providing a facility where the benefits, issues and challenges of farm<br />
integration could be studied in detail. The farm, ‘Loch Eaton’, is a 270 ha cotton and grains farm<br />
located on Grassdale Road, 14 km south of Dalby on the Darling Downs, Queensland.<br />
Operated by Paul and Debbie McVeigh, Loch Eaton is positioned in an established irrigated cotton<br />
producing area. Like many in the area the farm was originally developed for wool and beef<br />
production. Since the mid 1980’s the farm has been used primarily for the production of cotton, grain<br />
and cereal crops. At present approximately 80 per cent of the farm is used for cotton production. At<br />
the time of this study McVeigh Brothers P/L operated a cooperative of farms along Grassdale Road of<br />
which Loch Eaton was the central property. There are 4 water storage cells or “ring tanks” on this<br />
property all of which share one border with the riparian zone of the Condamine River which flows<br />
along the eastern edge of the property (Fig 2.1.1). These ring tanks have a combined surface area of<br />
48.6 ha. Surface water is harvested from the adjacent river when water levels are above a regulated<br />
height using two pumping stations according to the farm’s general pumping licence. At the first<br />
pumping station water is pumped directly into the storage used for aquaculture. As this first ring tank<br />
is filled water overflows by gravity into the adjacent ring tank until it too is full or pumping is ceased.<br />
The second pumping station fills the lower but much shallower (
The ring tank used for fish culture (marked with arrow on map and shown in Fig 2.1.2) is 5.5 Ha and<br />
is a maximum of 7m deep at its deepest point when at capacity. At capacity the ring tank holds<br />
approximately 385ML.<br />
Ring Tank used for demonstration<br />
aquaculture facility<br />
Figure 2.1.2 Layout of the McVeigh Brothers properties showing farm infrastructure<br />
2.2 Aquaculture Systems<br />
The focus at Loch Eaton was to produce an additional crop, in this case fish, using the farms existing<br />
water infrastructure and resources. This was to be achieved without any detrimental impact on the<br />
farm’s existing cotton and grains operations. As such the use of earthen ponds were considered but<br />
deemed inappropriate as they would significantly reduce the area available for cotton production. Not<br />
only would the ponds cover a significant proportion of the farm but the need to install additional<br />
electrical, pumping and water transfer infrastructure meant the other costs were prohibitive.<br />
The aquaculture operation was therefore established in the farms primary ring tank which could<br />
receive both surface and groundwater inputs. Initially, a combination of small nursery cages (8 m 3 )<br />
and larger circular grow out cages (100 m 3 ) were installed within the storage and were serviced by a<br />
central walkway (Fig 2.2.3). Difficulties experienced with net cages in the ring tank led the operators<br />
to develop their own version of in-pond floating raceway technology (Fig 2.2.4).<br />
This system was released commercially by the Total Aquaculture Management Company (TAMCO)<br />
in 2003. Termed modular plastic raceways (MPRs) the product is a roto-moulded high density<br />
polyethylene (HDPE) construction which uses a bank of air uplifts at one end to drive water through<br />
the raceway. Water flow is evenly distributed through the unit and while the rate of water exchange is<br />
high the velocity of water is optimal for fish growth and removal of wastes.<br />
5
Figure 2.2.3 Net cages used for silver perch and Murray cod production in the ring tank at Loch<br />
Eaton<br />
Figure 2.2.4 Floating raceway system developed for intensive fish production deployed in the<br />
ring tank at Loch Eaton<br />
6
2.3 Fish Species<br />
Silver perch (Bidyanus bidyanus) were selected for initial trials as they are readily available from<br />
hatcheries as fingerlings. This species forms the majority of native freshwater fish production in<br />
Australia with the majority of product being sold live to markets and restaurants. Although primarily<br />
grown in pond systems this species has shown promise in net cages and other more intensive tank<br />
based production systems.<br />
Murray cod (Maccullochella peelii peelii) was selected because it has a demonstrated potential for<br />
higher density production particularly in tank systems (Gooley and Gavine, 2003). It is an emerging<br />
species which has a higher value than silver perch although the relative cost of fingerlings for Murray<br />
cod are also higher.<br />
Golden perch (Macquaria ambigua ambigua) is another emerging native freshwater fish. While<br />
hatchery production of this species is well established virtually all stock is used for recreational<br />
stocking activities. The primary issue for this species is the weaning of fingerlings onto artificial diets.<br />
Recent research by DPI&F has demonstrated successful weaning strategies and good growth<br />
characteristics of this species under culture conditions (Herbert and Graham, 2004ab).<br />
7
3. Water Use and Quality<br />
3.1 Background<br />
The opportunity to utilise large water storage infrastructure for aquaculture is well recognised and is a<br />
common practice in many countries. However, the scale of these activities is often limited with largescale<br />
integrated agri-aquaculture being non-existent in Australia. A clear opportunity exists to utilise<br />
these resources, diversify farming operations, and provide significant socio-economic benefits for rural<br />
Queensland and other areas of the country.<br />
In assessing the potential of a farms water infrastructure for aquaculture, the availability and quality of<br />
water must be considered. The origin of the water (the timing and means by which the water enters the<br />
water storage) will be of critical importance in determining the quantity and quality of water that will<br />
be used for aquaculture.<br />
Many factors determine the quality of water for use in freshwater fish culture. These include factors<br />
such as water temperature, dissolved oxygen levels, turbidity, pH and nutrient levels. Fluctuations in<br />
these factors will impact on the growth rate of fish or in severe instances can result in the onset of<br />
disease and fish death. Integrating aquaculture with an industry that relies heavily on the collection of<br />
riverine water, typically during flood events, poses significant challenges with respect to the<br />
maintenance of suitable water quality. This study aimed to monitor the changes in ring tank water<br />
quality over consecutive seasons in a ring tank that received water from both riverine flood pumping<br />
events and also from the farms groundwater supply.<br />
3.2 Materials and Methods<br />
3.2.1 Water Harvesting<br />
Water harvested during flow events from the Condamine River and from the farms bore adjacent to the<br />
ring tank events were recorded. Three pumps can be used for water harvesting (4, 12 and 16″) with the<br />
size of pump dictated by the height of the river. All water harvested from the river and bore was<br />
pumped into the aquaculture ring tank in its raw form did not receive any treatment such as settling,<br />
the addition of flocculants or aeration.<br />
3.2.2 Water Quality<br />
In order to monitor diurnal and seasonal changes in ring tank water quality measures of dissolved<br />
oxygen, water temperature and pH were recorded up to twice daily (morning and late afternoon).<br />
Given the variable water level within the ring tank (dependent on the amount being harvested and that<br />
being used for watering crops), these readings were taken as surface and bottom readings only. The<br />
average depth of the ring tank was also recorded. The pH was only recorded for surface waters (
Samples were collected from a central point in the middle of the dam to ensure all samples were well<br />
mixed and that localised effects of sampling near the aquaculture operations were avoided. A sample<br />
was also collected from the Condamine River adjacent to the farms pumping infrastructure. Both<br />
samples were immediately frozen following collection and stored at -20°C until analyses.<br />
Nutrient analyses were conducted on the Lachat QC8000 Flow Injection Analyser (Zellweger<br />
Analytics Inc. Milwaukee WI 53218) following standard methods (APHA, 1995.).<br />
3.3 Results<br />
3.3.1 Water Harvesting and Movement<br />
There were 11 separate water movement events from the beginning of the study period (Table 3.3.1).<br />
These included 7 periods where water was harvested from the Condamine River and 4 from the bore<br />
adjacent to the storage.<br />
Table 3.3.1 Source, timing and duration of water harvesting activities at Loch Eaton from<br />
October 2000 to February 2004<br />
Event Source Date Started Date Finished<br />
Duration<br />
(days)<br />
River pumps used<br />
1 Bore 27/10/00 27/11/00 31 Adjacent to ring tank<br />
2 Bore 28/12/00 11/01/01 14 Adjacent to ring tank<br />
3 River 04/02/01 10/02/01 6 4 and 12″<br />
4 River 14/03/01 14/04/01 31 4″<br />
5 Bore 12/09/01 23/09/01 11 Adjacent to ring tank<br />
6 Bore 15/11/01 22/11/01 7 Adjacent to ring tank<br />
7 River 28/11/01 10/12/01 12 4 and 12”<br />
8 River 26/02/03 02/03/03 4 4 and 12”<br />
9 River 07/12/03 20/12/03 13 4 and 12”<br />
10 River 14/01/04 28/01/04 14 4, 12 and 16″<br />
11 River 03/02/04 15/02/04 12 4, 12 and 16″<br />
Riverine water harvesting is an opportunistic and generally seasonal activity while pumping bore<br />
water occurs during periods of low rainfall. The ring tank has three different sized river pumps with<br />
diameters of 4, 12 and 16″ inches. These pumps are activated when water levels rise to a height that<br />
permits their use. Not all of this pumping capacity was used for each of the recorded pumping events.<br />
For riverine pumping activities lasting longer than 14 days only the 4″ pump was used. Pumping<br />
activity lasting 14 days or less used a combination of 4, 12 and 16″ pumps. In early February 2001 a<br />
short term pumping event lasted for six days using both the 4 and 12″ pumps. Another more prolonged<br />
pumping event occurred one month later and lasted 31days. The last riverine pumping event occurred<br />
in late November 2001 and lasted for 12 days. After this event, no riverine water harvesting activities<br />
took place for over 14 months (443 days). This event was brief as water levels only permitted pumping<br />
to occur for a total of 4 days. Late in 2003 water levels within the ring tank had fallen to less than 30<br />
per cent of its capacity and all other storages on the farm were fully drained. As a consequence the<br />
next three pumping events, December 2003, January 2004 and February 2004 represented a period of<br />
significant water exchange and turnover within the ring tank. The two smaller pumps (4 and 12) were<br />
used for 13 days during the December 2003 event while all three pumps (4, 12 and 16″) where used<br />
for a total of 39 days in January and February 2004.<br />
In Dalby the highest rainfalls typically occur from November through to February with December<br />
having the highest average total monthly falls of 95 mm (AGBOM, 2005). The annual rainfall average<br />
for the Dalby region is 676 mm (AGBOM, 2005). Despite an increased reliance on the farms<br />
groundwater allocation during this study due to extended periods of little to no riverine pumping<br />
activity, the majority of the farms water needs were met from riverine supplies harvested during high<br />
flow events. Water pumped into the ring tank during these events was typical of flood waters for<br />
9
inland Australia with high levels of suspended sediments and low levels of dissolved oxygen. Other<br />
small fish and debris were also introduced to the ring tank during water harvesting activities.<br />
Unlike riverine water, the groundwater that was pumped into the ring tank was of high quality and<br />
contained no particulate or suspended matter. The volumes of bore water added to the ring tank did not<br />
appear large enough to influence ring tank water quality.<br />
Of the water harvested from the Condamine River, virtually all passed through the aquaculture ring<br />
tank before being transferred to other on-farm storages. Water can be drained from the aquaculture<br />
ring tank via a gate valve into an adjacent head ditch that can be used to irrigate adjacent fields or the<br />
water can be moved to the lagoon dam. This drainpipe draws directly from underneath the aquaculture<br />
infrastructure (cages/raceways). The ring tank can also overflow into the adjacent cell which again is<br />
set up to move water either to the lagoon dam or the irrigation head ditch.<br />
3.3.2 Water Quality<br />
3.3.2.1 Dissolved Oxygen<br />
Flood harvesting events were the most influential factor governing the variability in dissolved oxygen<br />
(DO) levels. The ring tank morning DO levels for surface water (SF) in January 2001 averaged 9.21 ±<br />
0.61mg/L (Table 3.3.2). On the 04/02/01 a major riverine pumping event commenced. At the end of<br />
this 10 day pumping event the morning SF DO levels had fallen to just 3.5 mg/L. They remained<br />
below 5 mg/L until the 23/02/01 after which they began to slowly rise reaching an average of 6.50 ±<br />
1.09 mg/L in May.<br />
In late 2001 a series of riverine and bore pumping events that occurred between the 15/11/01 and the<br />
10/12/01 were again associated with a decrease in ring tank DO levels. The average morning SF DO<br />
level was 7.14 ± 0.48 mg/L for the month prior to the first 4 day riverine pumping event. Two<br />
subsequent riverine pumping events on the 20th and 28th of November lasted two and six days<br />
respectively. These riverine pumping events also coincided with bore water pumping activity on the<br />
11th and the 22nd of the same month. The morning SF DO level for the week following this series of<br />
pumping events averaged 4.53 ± 0.54mg/L.<br />
For an extended period between the 10/12/01 and the 26/02/03 there were no riverine pumping events.<br />
In early December 2003 a pumping event lasting 13 days resulted in an immediate drop in SF DO<br />
levels. The morning DO level in SF waters In November 2003 averaged 5.23 ± 0.95 mg/L compared<br />
to the December average of 3.83 ± 1.34 mg/L. The lowest morning DO level observed during the<br />
pump event in December was 1.92 mg/L on the 16/12/03. Low DO levels were maintained in January<br />
and February 2004 with another two pumping events. The January, February and March 2004 morning<br />
SF DO levels averaged 3.22 ± 0.33, 3.02 ± 0.38 and 4.08 ± 0.79 mg/L respectively. Afternoon DO<br />
levels for these months were similar and averaged 3.41 ± 0.42, 3.38 ± 0.42 and 4.23 ± 0.58 mg/L<br />
respectively.<br />
In contrast to riverine pumping events, isolated bore water pumping events were not associated with<br />
any decrease in ring tank DO. A 31 day bore pumping event that commenced on the 27/10/00 was not<br />
associated with any fall in DO levels. The morning surface DO levels prior to this pumping activity<br />
averaged 9.54 ± 0.77 mg/L. The DO concentration during this pumping event averaged 9.13 ±<br />
0.69 mg/L and was 8.2 mg/L the day after pumping ceased. Similarly a 12 day bore pumping event<br />
that commenced on the 12/09/00, also had no detrimental impact on ring tank DO levels. The morning<br />
surface DO level in the ring tank on the 24/09/00, the day after pumping ceased, was 8.39 ±<br />
0.17 mg/L. This compares favourably with the DO levels observed in surface waters in the week prior<br />
to this pumping event which averaged 9.07 ± 0.46 mg/L. Similar observations were made for DO<br />
levels following bore pumping events on the 12/09/01 and the 15/11/2001.<br />
10
Table 3.3.2 Average monthly morning surface (SF) and floor (FL) dissolved oxygen levels<br />
(mg/L) in the aquaculture ring tank from November 2000 to March 2004 (mean ± standard<br />
deviation)<br />
Month<br />
2000 2001 2002 2003 2004<br />
SF FL SF FL SF FL SF FL SF FL<br />
January<br />
9.21 8.56 6.34 5.45 6.50 4.20 3.22 3.00<br />
±0.61 ±0.84 ±0.65 ±0.73 ±1.33 ±1.77 ±0.33 ±0.35<br />
February<br />
4.58 3.28 6.67 4.75 6.27 4.58 3.02 2.62<br />
±1.17 ±0.67 ±0.55 ±0.87 ±1.14 ±1.13 ±0.38 ±0.48<br />
March<br />
4.73 3.68 7.09 5.16 5.85 4.83 4.08 3.85<br />
±0.66 ±1.45 ±0.58 ±1.47 ±0.99 ±0.97 ±0.79 ±0.78<br />
April<br />
5.77 5.12 6.17 5.44 6.39 4.62<br />
±0.32 ±0.59 ±0.39 ±0.50 ±1.29 ±0.87<br />
May<br />
9.18 6.50 6.08 7.00 6.51 6.66 5.49<br />
±0.41 ±1.09 ±1.13 ±0.46 ±0.61 ±0.71 ±1.13<br />
June<br />
10.13 8.29 8.01 7.74 6.84 7.49 6.43<br />
±1.06 ±0.43 ±0.44 ±0.73 ±0.85 ±0.84 ±1.35<br />
July<br />
10.35 9.95 9.63 9.44 8.54 7.43 8.05 7.45<br />
±0.22 ±0.27 ±1.02 ±1.05 ±0.54 ±0.55 ±0.77 ±0.65<br />
August<br />
11.35 10.55 9.22 8.80 8.04 6.87 7.29 6.62<br />
±0.21 ±0.35 ±0.70 ±0.60 ±0.84 ±0.59 ±0.92 ±0.87<br />
September<br />
10.09 5.85 8.87 8.33 5.92 4.95 6.18 5.14<br />
±0.80 ±2.33 ±0.52 ±0.74 ±0.69 ±0.63 ±0.59 ±0.75<br />
October<br />
9.48 8.32 7.36 6.10 6.34 4.22 4.93 3.67<br />
±0.58 ±0.99 ±0.50 ±0.79 ±0.76 ±0.93 ±0.65 ±1.33<br />
November<br />
9.03 7.78 5.92 5.38 6.27 2.98 5.23 4.02<br />
±0.59 ±1.24 ±0.92 ±0.88 ±0.45 ±0.58 ±0.95 ±1.57<br />
December<br />
8.65 7.64 4.78 4.50 6.61 3.53 3.83 2.95<br />
±0.35 ±0.95 ±0.96 ±1.04 ±0.71 ±1.58 ±1.34 ±1.10<br />
Average differences in the morning surface and bottom dissolved oxygen levels in the ring tank was<br />
1.14 ± 1.25 mg/L over the duration of this study. The difference in the average afternoon surface and<br />
bottom DO levels was 1.64 ± 1.78 mg/L. The only extended period where pronounced differences in<br />
surface and bottom DO levels were observed were over summer months from October through to<br />
March in both 2002 and 2003. In both years these differences were greatest for afternoon readings.<br />
During this period, the afternoon surface water DO levels averaged 7.85 ± 2.04 mg/L compared to the<br />
bottom readings that averaged 3.97 ± 1.37 mg/L. This equates to an average difference in the daily<br />
surface and bottom DO levels of 3.85 ± 2.39 mg/L. Although low over summer, the DO levels at the<br />
floor of the ring tank increased from 4.73 ± 1.06 mg/L in March 2003 to 4.98 ± 0.78 mg/L and 5.73 ±<br />
1.24 mg/L in April and May respectively of that year.<br />
Afternoon DO levels followed the same pattern as morning DO levels but afternoon values were<br />
typically higher than those observed in the morning (Table 3.3.3). In 30 of the 41 months where<br />
comparisons were possible, the surface DO levels were higher in the afternoon than in the morning.<br />
The FL readings for DO in the afternoons were only higher than the morning values in 16 of the 41<br />
months.<br />
3.3.2.2 Water Temperature<br />
Average water temperatures fluctuated on a seasonal basis peaking in the months of January and<br />
February of each year. The highest observed water temperature was 33.1ºC recorded in surface waters<br />
in the afternoon of 15/01/04. February 2004 had the highest average monthly morning and afternoon<br />
surface temperatures with values of 27.22 ± 1.50 ºC and 29.30 ± 1.66 ºC (Table 3.3.4 and 3.3.5).<br />
July and August were the coldest months in this study. The coldest temperature of 10.5ºC was<br />
recorded in the surface waters and the floor of the ring tank on the 07/0702. In that month the morning<br />
surface and floor water temperatures averaged 11.11 ± 0.49 ºC and 10.98 ± 0.40 ºC. These were the<br />
lowest average monthly water temperatures recorded in this study.<br />
11
Table 3.3.3 Average monthly afternoon ring tank surface (SF) and floor (FL) dissolved oxygen<br />
levels (mg/L) from November 2000 to March 2004 (mean ± standard deviation)<br />
Month<br />
January<br />
February<br />
March<br />
April<br />
May<br />
June<br />
July<br />
August<br />
September<br />
October<br />
November<br />
December<br />
2000 2001 2002 2003 2004<br />
SF FL SF FL SF FL SF FL SF FL<br />
9.91 9.01 6.08 5.19 9.75 3.79 3.41 2.93<br />
±1.33 ±2.07 ±0.87 ±0.75 ±1.65 ±2.07 ±0.42 ±0.44<br />
6.43 3.06 6.37 4.62 8.63 4.83 3.38 2.62<br />
±1.87 ±0.81 ±0.47 ±0.83 ±2.31 ±1.29 ±0.42 ±0.49<br />
5.52 3.58 6.76 5.01 8.25 4.73 4.23 3.81<br />
±0.82 ±1.41 ±0.52 ±1.27 ±1.63 ±1.06 ±0.58 ±0.71<br />
6.19 5.00 5.78 5.02 7.56 4.98<br />
±0.39 ±0.54 ±0.49 ±0.62 ±1.37 ±0.72<br />
6.70 6.10 7.27 6.41 7.68 5.73<br />
±1.04 ±1.22 ±0.53 ±1.00 ±1.20 ±1.24<br />
8.27 7.87 7.97 6.84 8.39 6.28<br />
±0.43 ±0.30 ±0.50 ±0.91 ±0.97 ±1.14<br />
9.66 9.82 8.71 7.68 8.77 7.27<br />
±1.07 ±1.65 ±0.53 ±0.50 ±1.01 ±0.72<br />
9.03 8.79 8.37 7.14 7.94 6.78<br />
±0.63 ±0.63 ±0.92 ±0.85 ±1.14 ±0.93<br />
8.57 7.97 5.90 4.98 6.72 5.27<br />
±0.60 ±0.90 ±0.64 ±0.58 ±0.52 ±1.02<br />
7.21 6.04 5.92 4.16 5.57 3.63<br />
±0.44 ±0.66 ±0.72 ±0.80 ±0.76 ±1.13<br />
9.04 7.03 5.94 5.24 6.72 2.88 6.62 3.67<br />
±0.39 ±1.48 ±0.97 ±0.66 ±0.82 ±0.62 ±1.63 ±1.45<br />
9.02 8.00 4.77 4.44 7.89 3.34 4.69 2.72<br />
±0.38 ±1.02 ±0.98 ±0.98 ±2.02 ±0.61 ±2.65 ±1.38<br />
Table 3.3.4 Average monthly morning ring tank surface (SF) and floor (FL) water temperatures<br />
from November 2000 to March 2004 (mean ± standard deviation)<br />
Month<br />
January<br />
February<br />
March<br />
April<br />
May<br />
June<br />
July<br />
August<br />
September<br />
October<br />
November<br />
December<br />
2000 2001 2002 2003 2004<br />
SF FL SF FL SF FL SF FL SF FL<br />
25.97 25.64 24.97 24.56 25.12 24.77 26.70 26.60<br />
± 1.23 ± 1.00 ± 0.59 ± 0.44 ± 0.70 ± 0.64 ± 0.60 ± 0.58<br />
24.68 24.17 25.02 24.28 24.66 24.30 27.22 27.06<br />
± 0.71 ± 0.52 ± 0.82 ± 0.37 ± 1.11 ± 0.92 ± 1.50 ± 1.46<br />
24.00 23.74 23.46 23.05 23.64 23.48 24.93 24.85<br />
± 0.64 ± 0.41 ± 0.71 ± 0.38 ± 0.69 ± 0.65 ± 1.42 ± 1.49<br />
20.81 20.70 20.65 20.62 21.97 21.80<br />
± 0.80 ± 0.83 ± 0.48 ± 0.46 ± 1.68 ± 1.53<br />
17.60 19.60 17.61 17.52 17.24 17.13 18.04 17.94<br />
± 2.39 ± 2.08 ± 2.06 ± 1.83 ± 1.77 ± 1.04 ± 1.08<br />
13.40 15.07 14.91 14.14 14.03 15.53 15.31<br />
± 0.53 ± 1.18 ± 1.07 ± 0.64 ± 0.61 ± 1.13 ± 1.03<br />
13.32 12.98 13.85 13.73 11.11 10.98 14.27 14.12<br />
± 0.59 ± 0.48 ± 1.83 ± 1.73 ± 0.49 ± 0.40 ± 0.68 ± 0.72<br />
14.45 14.10 13.31 13.23 13.12 12.59 14.50 14.35<br />
± 0.07 ± 0.28 ± 0.65 ± 0.62 ± 0.60 ± 0.69 ± 1.27 ± 1.28<br />
20.07 17.06 16.29 15.85 16.98 16.20 17.78 17.49<br />
± 1.98 ± 1.45 ± 1.79 ± 1.67 ± 1.11 ± 1.22 ± 1.87 ± 1.72<br />
20.83 20.38 19.23 18.45 19.88 18.58 20.26 19.91<br />
± 0.75 ± 0.42 ± 0.75 ± 0.51 ± 1.13 ± 0.91 ± 1.09 ± 1.03<br />
22.22 21.61 21.17 20.70 22.41 20.46 22.43 22.17<br />
± 1.11 ± 1.16 ± 0.63 ± 0.57 ± 0.74 ± 0.88 ± 1.40 ± 1.43<br />
25.27 24.90 24.51 24.31 23.85 22.66 25.74 25.54<br />
± 0.56 ± 0.75 ± 0.63 ± 0.42 ± 0.73 ± 0.85 ± 1.43 ± 1.36<br />
12
Over the course of the study the average monthly surface water temperatures for July 2000, 2001,<br />
2002, 2003, and 2004 were 13.32 ± 0.59, 13.85 ± 1.83, 11.11 ± 0.49, 14.27 ± 0.68ºC respectively. In<br />
comparison the average monthly morning surface water temperatures for August 2000, 2001, 2002,<br />
2003, and 2004 were 14.45 ± 0.07, 13.31 ± 13.12 ± 0.60, 14.50 ± 1.27ºC respectively (Table 3.3.5).<br />
Average ring tank morning surface water temperatures were above 20ºC for 6 months in 2001 and<br />
2002 and 7 months in 2003.<br />
Variations in temperature readings between bottom and surface waters were similar although less<br />
severe than those for oxygen. The greatest differences between ring tank surface and floor water<br />
temperatures were observed in the afternoon. The differences between surface and ring tank floor<br />
water temperatures were up to 3.1ºC for morning readings and 7.5ºC for afternoon readings. This large<br />
difference between surface and floor temperatures in the afternoon is a consequence of the heating of<br />
the upper surface waters in the summer as opposed to any change in floor water temperatures.<br />
The highest afternoon water temperature of 33.1ºC was recorded on a single day in January 2004. The<br />
highest floor water temperature was 29.7ºC in February of the same year. The highest monthly<br />
averages for surface and floor water temperatures of 29.30 ± 1.66ºC and 27.19 ± 1.45ºC were also<br />
recorded in February 2004.<br />
Table 3.3.5 Average monthly afternoon ring tank surface (SF) and floor (FL) water temperatures<br />
from November 2000 to March 2004 (mean ± standard deviation)<br />
Month<br />
2000 2001 2002 2003 2004<br />
SF FL SF FL SF FL SF FL SF FL<br />
January<br />
27.82 25.91 26.21 24.83 28.10 25.16 28.34 26.83<br />
± 1.47 ± 1.11 ± 1.16 ± 0.56 ± 1.11 ± 0.82 ± 1.37 ± 0.56<br />
February<br />
28.18 24.33 26.34 24.28 26.34 24.75 29.30 27.19<br />
± 2.18 ± 0.52 ± 1.47 ± 0.35 ± 1.49 ± 1.01 ± 1.66 ± 1.45<br />
March<br />
25.39 23.92 24.38 23.16 25.38 23.89 25.97 25.33<br />
± 1.44 ± 0.39 ± 0.96 ± 0.43 ± 0.91 ± 0.62 ± 1.72 ± 1.74<br />
April<br />
22.07 20.87 21.44 20.64 23.00 22.30<br />
± 0.89 ± 0.83 ± 0.99 ± 0.51 ± 1.87 ± 1.70<br />
May<br />
18.29 17.63 17.32 16.94 18.76 18.02<br />
± 2.22 ± 1.94 ± 1.92 ± 1.71 ± 1.42 ± 1.20<br />
June<br />
15.85 14.78 14.53 14.33 16.09 15.48<br />
± 1.32 ± 0.71 ± 0.50 ± 0.48 ± 1.32 ± 1.08<br />
July<br />
14.25 13.52 11.88 11.26 15.02 14.35<br />
± 1.32 ± 1.19 ± 0.78 ± 0.50 ± 0.89 ± 0.65<br />
August<br />
14.19 13.47 13.98 12.79 15.36 14.57<br />
± 0.77 ± 0.29 ± 0.78 ± 0.56 ± 1.36 ± 1.32<br />
September<br />
17.84 16.09 17.83 16.49 18.62 17.73<br />
± 2.36 ± 1.72 ± 1.19 ± 0.94 ± 1.99 ± 1.68<br />
October<br />
20.13 18.62 21.92 19.07 21.86 20.17<br />
± 1.20 ± 0.64 ± 1.18 ± 0.97 ± 1.35 ± 1.08<br />
November<br />
24.16 22.27 22.09 20.79 25.26 20.86 24.63 22.30<br />
± 1.89 ± 0.65 ± 1.04 ± 0.71 ± 1.27 ± 0.90 ± 1.51 ± 1.56<br />
December<br />
26.47 25.16 25.31 24.61 26.57 23.26 27.63 25.77<br />
± 0.86 ± 0.75 ± 0.58 ± 0.33 ± 1.36 ± 0.66 ± 1.97 ± 1.30<br />
3.3.2.3 Turbidity<br />
Ring tank turbidity was clearly influenced by riverine pumping events (Fig 3.3.1). Prior to riverine<br />
water harvesting activities in February 2001 the secchi depth of the ring tank was >2.5 m. These high<br />
secchi values were as a result of filling the ring tank with water from the adjacent bore. However, as<br />
soon as riverine pumping of flood waters commenced secchi values dropped rapidly. The day after<br />
pumping activity ceased the secchi depth had reached 0.2 m. This decrease in secchi depth was clearly<br />
observed to be associated with an increase in fine suspended clays rather than any increase in<br />
phytoplankton abundance.<br />
The lowest secchi readings of 0.1m were observed following a series of pumping events in November<br />
and December 2001. The secchi value prior to commencement of pumping activity was 0.45 m. By the<br />
end of November secchi values had fallen to 0.25 m. In December, secchi values averaged just 0.11 ±<br />
13
169<br />
165<br />
161<br />
157<br />
153<br />
149<br />
145<br />
141<br />
137<br />
133<br />
129<br />
125<br />
121<br />
117<br />
113<br />
109<br />
105<br />
101<br />
97<br />
93<br />
89<br />
85<br />
81<br />
77<br />
73<br />
69<br />
65<br />
61<br />
57<br />
53<br />
49<br />
45<br />
41<br />
37<br />
33<br />
29<br />
25<br />
21<br />
17<br />
13<br />
9<br />
5<br />
1<br />
0.02 m. This change in turbidity was again due to the levels of suspended clay particles as occurs<br />
during riverine flow events in the Condamine River. Secchi values did not subsequently return to the<br />
pre November 2001 pump event values until January 2003.<br />
Because riverine pumping was the most significant form of water supply to the ring tank, secchi<br />
depths remained between 0.1 and 0.6 m for the remainder of the study. The average secchi depth after<br />
the February 2001 riverine pump events was 0.35±0.13 m.<br />
2.6<br />
2.4<br />
2.2<br />
2<br />
1.8<br />
Secchi Depth (m)<br />
1.6<br />
1.4<br />
1.2<br />
1<br />
0.8<br />
0.6<br />
0.4<br />
0.2<br />
0<br />
Week<br />
Average Secchi Depth<br />
Figure 3.3.1 Daily turbidity readings for the aquaculture ring tank from January 2001 to March<br />
2004 reported weekly. The red dashed line indicates a major riverine pumping event<br />
3.3.2.4 pH<br />
Little variation was observed in monthly pH readings in surface waters with daily averages ranging<br />
between 7.11 and 8.75 over the course of this study. This included little diurnal variation in pH with<br />
morning and afternoon pH values varying less than 0.5 pH units. The morning and afternoon pH<br />
values averaged 7.95 ± 0.50 and 8.05 ± 0.50 respectively for the period from December 2001 to<br />
January 2003.<br />
3.3.2.5 Background Nutrient Levels<br />
Monitoring of total Kjeldahl N and P in both the river and the ring tank indicated that there has not<br />
been any detectable effect of the aquaculture activities on water quality (Fig 3.3.2). The only clear<br />
differences were obtained in riverine waters prior to the February pumping event where total N and P<br />
levels were comparatively higher than ring tank levels. During this same period the ring tank was<br />
filled from underground water source as prolonged dry conditions prevented flood harvesting and as<br />
such had visibly better water quality. Low riverine flow that preceded the high flow event is indicative<br />
of poorer riverine water quality at the time, as reflected in the observed result.<br />
14
Figure 3.3.2 Total Kjeldahl Nitrogen (TKN) and Total Kjeldahl Phosphorous (TKP) in the<br />
Condamine River and Loch Eaton ring tank waters. The red dashed line indicates a major<br />
pumping event<br />
3.3.3 General Observations<br />
Any variability in the quality of water within the ring tank was largely associated with riverine<br />
pumping events that introduced water with high levels of clay turbidity and low levels of dissolved<br />
oxygen. Water introduced from bore supplies did not negatively influence water quality and indeed<br />
may have served to mitigate the impacts of riverine waters harvested in early and late 2001.<br />
During the summer (November to March) of 2001/2002, 2002/2003 and 2003/2004 enough water was<br />
harvested from high flow events from the Condamine River to result in a net exchange of waters from<br />
the aquaculture ring tank of up to 4 times its volume.<br />
Ring tank water depth varied throughout the year depending on the amount of water being harvested<br />
and that which was required for irrigation. In 2002 and 2003, the lack of opportunity to harvest<br />
riverine water resulted in relatively low water levels being maintained within the aquaculture ring tank<br />
for an extended period. While this water was maintained the other storages on farm were emptied. In<br />
late 2003 and early 2004 the harvest of large volumes of riverine water, combined with relatively low<br />
water levels within the ring tank resulted in a large flushing event. The low DO levels in riverine water<br />
and the high levels of suspended solids reduced water quality and resulted in a significant stress event<br />
for fish which resulted in significant stock losses (Refer to Chapter 4).<br />
3.4 Discussion<br />
Water quality within the ring tank was detrimentally affected by water harvesting activities during<br />
periods of high river flows. Twice during this study a series of riverine pumping events were<br />
responsible for introducing large volumes of ‘run off’ water into the aquaculture ring tank. Surface<br />
waters that drain into rivers during storm events typically carry high levels of plant matter, bacteria<br />
and dissolved organic matter that has been leached from soils and vegetation. These waters are also<br />
generally high in turbidity resulting from suspension of fine clay particles. The resulting impact on<br />
water quality in the ring tank was both immediate and lasting with fish mortality, reduced feeding and<br />
poor growth the observed outcomes.<br />
15
In February 2001, enough water was harvested from the river to result in a net exchange of waters<br />
from the aquaculture ring tank of up to four times its volume. The water itself was not only low in<br />
dissolved oxygen (DO) but it also carried high levels of suspended solids that dramatically increased<br />
the turbidity of the ring tank. Morning DO readings prior to the February 2001 pumping event<br />
averaged between 7.6 and 9.5 mg/L. After pumping the dissolved oxygen level fell to 3.9 mg/L. It was<br />
not until late May that DO levels returned to levels of above 7 mg/L. In late 2003 and early 2004, a<br />
series of pumping events again had a severe impact on the DO level within the ring tank. While no<br />
sub-lethal oxygen values are available for silver perch, it is generally accepted that this species can<br />
handle DO levels approaching 2 mg/L for short periods. In this study, the lowest DO reading of<br />
1.92 mg/L was recorded during pumping activity in late December 2003. Signs of stress in fish<br />
associated with low dissolved oxygen levels include loss of appetite, lethargy, congregation near<br />
aerators or in flowing water, gasping near the surface and mortality (Rowland and Bryant, 1995).<br />
These signs were observed by farm staff in late 2003 early 2004 when fish mortality was observed<br />
during pumping activity. Rowland and Bryant (1995) recommended that DO levels be maintained at<br />
concentrations of 3 mg/L or higher for silver perch in pond culture. Critical DO levels required for<br />
warmwater fish have been reported to be about 5 mg/L (Boyd, 1990). The lowest monthly average SF<br />
DO level of 3.08 ± 0.34 mg/L was obtained in the morning in February 2004.<br />
Prior to riverine pumping activity in 2001 the turbidity of ring tank water was low with secchi depths<br />
in excess of 2.5 m. However after pumping this secchi depth was reduced to less than 0.2 m. While a<br />
degree of clay turbidity can prevent the formation of strong phytoplankton blooms, high levels of<br />
turbidity can be detrimental in fish culture. Phytoplankton growth in pond culture is beneficial as<br />
photosynthesis adds oxygen to the water during the day while at the same time algae consume<br />
ammonia produced by the fish. However, high levels of clay turbidity can have a detrimental impact<br />
on phytoplankton populations, oxygen consumption and oxygen production within the water column.<br />
The introduction of large volumes of highly turbid waters will first cause a ‘die back’ or ‘crash’ of<br />
plankton numbers. Algal crashes in pond aquaculture can contribute significantly to the biological<br />
oxygen demand (BOD) of the water body as dead plankton decomposes. At the same time as the algal<br />
die off is consuming oxygen, photosynthesis from surviving phytoplankton in this water is reduced as<br />
light penetration becomes limited to the top few centimetres of the water body.<br />
High levels of suspended sediments can be lethal to fish (Koehn & O'Connor, 1990). High<br />
concentrations of clay particles can cause gill clogging in fish and in severe cases, can result in gill<br />
damage. Any irritation to gill tissue can increase a fish’s susceptibility to bacterial gill disease by<br />
causing excessive gill mucus production, epithelial hyperplasia and hypertrophy. The net result of<br />
irritation, disease and damage is reduced efficiency of oxygen uptake and poor growth. In<br />
circumstances where low DO levels exist in combination with high levels of clay turbidity even mild<br />
gill clogging can result in significant levels of fish mortality.<br />
Flocculation using gypsum and aluminium sulphate (AlSO 4 ) can be used in pond aquaculture to<br />
remove excessive clay turbidity and permit algal growth. Aluminium sulphate added at a dose of<br />
between 15 and 30 mg/L will effectively remove clay turbidity from the water column while gypsum<br />
must be added at concentrations between 100 and 300 mg/L (Hargreaves, 1999). Both treatments can<br />
be temporary as they do address the source of the turbidity which at any time may be reintroduced to<br />
the ring tank with further pumping or resuspended with strong wind activity and sediment disturbance.<br />
The optimal pH range for silver perch culture is the same as for other warm water freshwater fish and<br />
should be maintained between 6.5 and 8.5. In this study the afternoon pH of surface waters changed<br />
little indicating a low level of algal productivity due to high levels of clay turbidity. Strong algal<br />
blooms are often accompanied by large diurnal swings in pH. Algae consume carbon dioxide during<br />
photosynthesis which reduces the buffering capacity of the water and increases the pH. High pH<br />
values (>10) should be avoided as they can have sub-lethal effects such as gill and eye (corneal)<br />
damage. In pond culture the addition of a carbon source to promote bacterial growth and reduce algal<br />
densities through competition for nutrients is one way of managing pH. Another more common<br />
method is water exchange which thins out the algal bloom and reduces pH. Both these methods are<br />
unlikely to be practical in ring tank aquaculture where water exchanges cannot easily be implemented<br />
and where carbon additions may be expensive because of the volume of water requiring treatment. The<br />
16
management of clay turbidity using flocculants in ring tanks must therefore consider that such activity<br />
may stimulate problematic algal blooms in a system where new water may only be introduced on a<br />
seasonal and opportunistic basis.<br />
Average ring tank water temperatures were typically seasonal with summer temperatures reaching<br />
27.4ºC and winter temperatures reaching 13ºC. Water temperatures were below 20ºC for 6 months<br />
from May to October in 2001. Optimum temperature for silver perch culture has been reported in the<br />
range of 23 to 28°C with rapid growth when temperatures exceed 20°C (Rowland and Bryant, 1995).<br />
Reduced growth does occur at temperatures below 20°C but no substantial growth has been recorded<br />
lower than 13°C (Barlow and Bock 1981). At optimum temperatures it would be expected for perch to<br />
reach market size in 12 - 24 months.<br />
Differences in both surface and ring tank floor measures of DO and temperature indicate that<br />
stratification of the ring tank was greatest in the afternoons during summer. Stratification occurs when<br />
sunlight heats the surface layers of the water body making them less dense. These upper layers of<br />
warmer water serve to trap cooler more dense water underneath. This effect is most evident in the<br />
afternoon when surface water is heated by the sun but at night these surface layers cool and mix with<br />
deeper waters reducing the degree of stratification. Thermal stratification also prevents mixing<br />
between highly oxygenated surface layers and deeper water resulting is marked differences in DO<br />
levels. The largest difference between the average surface and bottom DO in this study was 5.96 mg/L<br />
for afternoon readings in January 2003. While average DO readings in deeper water were<br />
comparatively lower than surface waters the stratification was not severe enough to constitute an<br />
immediate threat to the aquaculture operation. In severely stratified water bodies the deeper waters are<br />
completely depleted of oxygen. During storm events stratification can be broken and these deeper<br />
oxygen depleted waters become mixed with the shallow oxygenated surface layers. Often referred to<br />
as a ‘turnover’ event, the resultant reduction in the water bodies surface oxygen levels can result in<br />
significant, if not total, stock losses.<br />
The low concentration of DO at the bottom of the ring tank indicates that either there is some mixing<br />
occurring within the storage or the BOD in deeper waters was at the time insufficient to fully deplete<br />
available oxygen. The large surface area (4 ha) of the ring tank is likely to facilitate some level of<br />
regular mixing of water layers but it is unlikely to result in complete mixing of the entire storage on a<br />
continuous basis. It is likely that as the aquaculture activity continues, the accumulation of organic<br />
wastes in the ring tanks sediments will deplete available oxygen in deeper waters and increase the<br />
risks associated with a turnover event. Therefore, any determination of the aquaculture potential of a<br />
ring tank like that at Loch Eaton must consider the long term impacts of management regimes on the<br />
sediments. One management option is rotation of the area used for culture in line with fallowing<br />
principles used in sea-cage culture. Moveable production systems such as cages and floating raceways<br />
would enable fallowing but do not serve to break up the stratification itself. Mechanical<br />
destratification by means of upwelling or downwelling units should be considered when stratification<br />
becomes severe.<br />
Riverine pumping during periods of high flow are an essential means of securing water supplies for<br />
many cotton farmers and other irrigators in Queensland and New South Wales. This type of water<br />
harvesting is often opportunistic and is dictated by seasonal rainfall and river flow conditions.<br />
Pumping this water into the aquaculture ring tank in its raw form clearly had a negative impact on ring<br />
tank water quality to the extent that the conditions at times were unsuitable for intensive aquaculture.<br />
Using an alternative storage or modifying the existing pumping infrastructure, will enable low quality<br />
water to be first be directed into other storages, rather than passing through the aquaculture storage.<br />
This would reduce the impact of flood harvesting on water quality, enable controlled exchanges<br />
through the aquaculture storage and reduce the cost of treating clay turbidity by reducing the total<br />
exchange of water through the aquaculture ring tank. With respect to the Loch Eaton site, relocation of<br />
the aquaculture facility to the adjacent ring tank would achieve these outcomes.<br />
17
4. Production Systems and Growth<br />
4.1 Background<br />
The physical and operational issues faced when developing aquaculture in non-specific water bodies<br />
are often significantly different from those encountered when using specifically designed aquaculture<br />
ponds. Net cages are the most common form of culture in large reservoirs. However, extensive<br />
stocking of fingerling in reservoirs is also common where a managed fishery approach is used to<br />
harvest the stock. In Australia most aquaculture is undertaken on an intensive basis. Net cages are used<br />
in the barramundi industry, especially in the fingerling and juvenile phases, to help separate size<br />
classes, improve general husbandry practices, reduce bird predation and manage cannibalism in<br />
carnivorous species such as barramundi. Ring tanks are typically high walled structures which when<br />
full can be as deep as 7 m. Net cages can potentially operate effectively within this type of water<br />
infrastructure if water levels are maintained. Another option for intensive production is raceway<br />
culture. Floating raceway systems have been shown to be more cost effective than cage operations as<br />
they can operate at higher densities within a much smaller area with less labour (Yoo, Masser &<br />
Hawcroft, 1995 and Masser & Lazur, 1997). At Loch Eaton both net cage and floating raceway<br />
systems were used at different times of the farms development. The objective of this study was to<br />
monitor the farms use of these systems to determine which best suit the ring tank environment. This<br />
monitoring included assessing the growth, survival and food conversion rate (FCR) in both cages and<br />
raceways. A third objective was to assess the viability of extensive stocking of ring tanks might play in<br />
the development of aquaculture in cotton farm water storages.<br />
4.2 Materials and Methods<br />
4.2.1 Production Systems<br />
Three types of production system were employed in this study. Net cages were the first production<br />
system to be used on-farm and were established prior to commencement of this study. The second<br />
system, a floating raceway system, was in development during this study but by midway through the<br />
exercise it was the main production system used. The use of extensive stocking was also investigated<br />
in this study but this was not a major focus of the study.<br />
4.2.1.1 Cages<br />
Small 8 m 3 cages (Fig 4.2.1) were used for both silver perch and Murray cod juveniles while larger<br />
100 m 3 cages were used for silver perch juveniles and adults (Fig 4.2.2). All cages were covered in<br />
bird netting to reduce predation. Silver perch fingerlings supplied by commercial hatcheries were<br />
either stocked into a series of 10 t HDPE tanks or stocked directly into cages within the ring tank. The<br />
8 m 3 cages used for fingerlings were a 5 mm knotless mesh while two sizes of mesh, a 10 mm and<br />
20 mm, were used for the larger 100 m 3 nets. Fish in tanks were stocked at a rate averaging less than<br />
5 kg/m 3 . Water to the tanks was supplied on a flow through basis at ambient temperatures following<br />
degassing in a 20 m 3 header tank. Fingerlings were stocked into net cages at an initial rate averaging<br />
1,000 fish/m 3 but not exceeding 1,375 fish/m 3 . Fish were graded and restocked as dictated by growth<br />
and stocking strategies.<br />
4.2.1.2 Raceways<br />
The initial plastic raceways were fabricated from HDPE sheets and rotomoulded boxes welded<br />
together to form 7 and 14 m 3 raceways supported by plastic floats (Figs 4.2.3 and 4.2.4). The<br />
rotomoulded raceway was developed by Paul McVeigh in conjunction with Total Aquaculture<br />
Management Company (TAMCO) (Fig 4.2.5).<br />
18
Figure 4.2.1 Net cages 8m 3 used for silver perch and Murray cod fingerlings and juveniles<br />
Figure 4.2.2 Net cages 100m 3 used for silver perch grow out<br />
19
Figure 4.2.3 The first 7m 3 floating plastic raceway being stocked with silver perch fingerlings at<br />
Loch Eaton<br />
Figure 4.2.4 The first 14m 3 floating plastic raceways were constructed from HPDE sheets<br />
welded to rectangular pontoons that provided buoyancy<br />
20
Figure 4.2.5 The first 12m 3 TAMCO roto-moulded raceways in use at Loch Eaton<br />
Figure 4.2.6 A bank of uplifts (100mm) drives the water exchange through each of the raceway<br />
units<br />
21
Figure 4.2.7 Uplift, baffle board and end screen of raceways<br />
This raceway consists of two units, the uplift unit and the body of the raceway (Fig 4.2.5). The uplift<br />
unit has a set of sixteen 100 mm uplift chambers which are each fed with air from the main 50 mm<br />
manifold. Each of the air inlet orifices are 1/8 inch diameter and are set 80 cm from the water surface<br />
(Fig 4.2.6).<br />
A baffle (or eddy) board was placed 120 cm from the water entrance and extended 20 cm from the<br />
surface (Fig 4.2.7). The placement of this board helps facilitate downward rather than surface water<br />
flow. This assists the mixing of water within the raceways while at the same time prevents floating<br />
feeds from washing straight out the raceway unit. The internal flow characteristics of the raceways<br />
were assessed using a Sontek acoustic Doppler velocimeter (Sontek Pty Ltd, USA). Figures 4.2.8 and<br />
4.2.9 show the difference in raceway water flows when eddy boards are utilised. In these Figures,<br />
Distance refers to the distance along the raceway from the airlift end; Depth refers to water depth<br />
within the raceway; and Flow refers to the directional flow of water in cm/second (a negative Flow<br />
measure indicates that water is eddying at that point and flowing back towards the airlift end).<br />
Raceways were covered with shade cloth (70 per cent shade rating) as either a net panel (with eyelets<br />
and elastic) with a screen sewn into one end to allow feed delivery or as steel framed shade with oyster<br />
mesh fixed on some sections to allow viewing and feeding. Oyster mesh screens at the water entrance<br />
and exit prevented fish from escaping and wild fish from entering the culture unit. Cod were kept in a<br />
combination of different size cages, raceway and tanks dependent on the number of stock on hand and<br />
availability of culture units. For small numbers of stock, oyster mesh cages from 1 to 0.4 m 3 were<br />
used. All culture units were covered with bird netting.<br />
22
25<br />
20<br />
15<br />
Flow (cm/sec)<br />
10<br />
5<br />
0<br />
-5<br />
-10<br />
110<br />
100<br />
80<br />
Depth (cm)<br />
60<br />
40<br />
20<br />
1<br />
60<br />
160<br />
260<br />
360<br />
460<br />
560<br />
660<br />
Distance (cm)<br />
Figure 4.2.8 Water flow characteristics of raceways without an eddy board<br />
35<br />
30<br />
25<br />
20<br />
15<br />
Flow (cm/sec) 10<br />
5<br />
0<br />
-5<br />
-10<br />
-15<br />
110<br />
100<br />
80<br />
Depth (cm)<br />
60<br />
40<br />
20<br />
1<br />
160<br />
260<br />
60<br />
360<br />
460<br />
560<br />
660<br />
Distance (cm)<br />
Figure 4.2.9 Water flow characteristics of raceways with an eddy board placed 120cm from the<br />
water entrance and extended 20cm from the surface<br />
4.2.1.3 Extensive Stocking<br />
The potential for extensive culture in ring tanks was to be assessed through deliberate stocking of<br />
juvenile fish followed later by recapture efforts. However, a series of large escape events involving<br />
both silver perch and Murray cod from net cages in the early stages and later from some raceways<br />
made any co-ordinated stocking activity in this study unnecessary.<br />
Due to the need to recapture stock as live fish, the equipment used to assess recapture of free ranging<br />
fish focused on the use of trap nets in the form of lift nets and drum nets. Live fish fetch a better<br />
market price and also can be purged in clean tanks to rid them of any off flavour taints commonly<br />
associated with freshwater fish (Fig 4.2.10). The lift net used was modified from an existing 40 m 3<br />
cage net. The drum nets were 150 mm (stretched) knotted nylon mesh nets fitted with a polystyrene<br />
23
float to prevent drowning of air breathing animals such as turtles (Fig 4.2.11). The drum nets were set<br />
along the water edge both near the aquaculture operation and at other points around the ring tank.<br />
4.2.2 Fish Grading and Transfer<br />
Grading was used to regulate size class differences in stock and to manage the stocking densities<br />
within individual culture units. Size class frequency was established from individual fish weights and<br />
lengths obtained during weekly sub-sampling activities. From each culture unit 100 animals were<br />
netted, anaesthetised, weighed and measured before being revived and returned to their culture unit<br />
(cage or raceway).<br />
Stock was graded manually either with conventional box graders (Fig 4.2.12) or by push gate graders<br />
(Fig 4.2.13). Stock was lightly anaesthetised using AQUI-S to reduce stress and reduce potential<br />
damage. The volume of stock being moved between culture units was measured by displacement of<br />
the fish biomass. Floating HDPE bins supplied with oxygen were positioned inside each of the<br />
receiving culture units in order to measure this displacement. No more than 100 kg of stock were<br />
transferred into one of these bins at any one time. Stock health and oxygen consumption were<br />
constantly monitored in the displacement bins. Fish were transferred into each bin using soft mesh dip<br />
nets and in some cases, also involved the use of a transfer hopper (Fig 4.2.14). The transfer hopper<br />
was fitted with a 100 mm HDPE pipe and water was supplied via a 12V submersible pump. The last<br />
0.5 m of the transfer pipe was fitted with a dewatering sieve. Similar practices were used for<br />
harvesting market sized fish where fish of the desired size were separated by grading and then<br />
transferred to a 1,000 L transport tank.<br />
Figure 4.2.10 Purging tanks (10m 3 ) supplied with degassed bore water were used to clear silver<br />
perch of ‘off flavour’ taints<br />
24
Figure 4.2.11 Drum nets used to assess the potential for re-capturing ‘live’ silver perch and<br />
Murray cod stocked into the ring tank<br />
Figure 4.2.12 Box grader used for grading fingerling and juvenile silver perch and Murray cod<br />
25
Figure 4.2.13 Raceway push gate grader used to passively grade fish within the raceway and<br />
also to crowd fish for harvest and transfer activities<br />
Figure 4.2.14 Fish transfer hopper used to move fish during stocking, grading, stock transfer<br />
or harvesting activity<br />
26
4.2.3 Fish Growth<br />
Fish growth was monitored using weekly sub-sampling data and biomass data collected during<br />
stocking and harvesting activities.<br />
4.2.4 Feeding Practices<br />
Fish were fed to satiation with appropriately sized feed, delivered in at least three separate rations<br />
daily throughout the growing season and every three days during winter months. All feeds utilised<br />
were commercial fish diets with protein contents between 35 and 45 per cent. Feed inputs to each<br />
culture unit were recorded as quantity fed on a daily basis. A combination of both floating and sinking<br />
feeds were used through out the study period dependent on feed size and type of culture unit being<br />
used in conjunction with visual observations of feeding behaviour.<br />
4.2.5 Systems Maintenance<br />
Culture units (cages, tanks and raceways) were cleaned and maintained when possible. All units were<br />
kept covered to prevent bird predation. Units were thoroughly cleaned and maintained prior to<br />
stockings and between stock movements. Raceway uplift banks and screens were cleaned as required.<br />
4.2.6 Disease Monitoring and Treatments<br />
Fish suspected of suffering from pathogen related problems were examined using wet slide<br />
preparations and a light microscope (Olympus). Samples of fish from units with significant observed<br />
mortality were analysed at the Department of Primary Industries, Animal Research Institute Veterinary<br />
Laboratory at Yeerongpilly Brisbane as required.<br />
Fish requiring treatment for pathogens were given formalin or salt baths as required. During treatment<br />
supplemental aeration was supplied and stock was closely monitored for signs of stress, principally<br />
respiratory distress, and/or incidence of moribund fish.<br />
4.2.7 Purging and Sale of Fish<br />
Fish were purged for no less than 10 days in 10t HDPE tanks supplied with bore water at ambient<br />
temperatures of between 12 and 28ºC. This water was exchanged twice daily and salt added<br />
periodically to reduce pathogen loads and reduce post handling stress. Fish were principally sold live<br />
or euthanased in an ice slurry and sold whole. Some were slaughtered, filleted and frozen (as a shatter<br />
packed product) at a commercial seafood processor and sold through a local seafood retail outlet in<br />
Dalby.<br />
4.3 Results<br />
4.3.1 Production Systems<br />
Raceway production represented the major culture unit used for production of silver perch at this site.<br />
The first raceway was stocked in the beginning of May 2001 and all stock was transferred to raceways<br />
by the end of October in 2001, after which cages were no longer used. A total of 16 raceways were in<br />
operation at the completion of this study (Table 4.3.1).<br />
27
Table 4.3.1 Number and volume of net cages and floating raceways in operation at Loch Eaton<br />
from September 2000 through to March 2004<br />
2000 2001 2002 2003 2004<br />
Net Cages<br />
8m 3 cages 6 6 (October) 0 0 0<br />
100m 3 cages 3 2 (October) 0 0 0<br />
Raceways<br />
7m 3 (p’type) 0 3 1 0 0<br />
14m 3 (p’type) 0 3 3 1 0<br />
12m 3 0 0 3 3 6<br />
18m 3 0 0 6 6 7<br />
24m 3 0 0 0 1 3<br />
A total of 161,200 Silver Perch fingerlings were stocked during the course of the study (Table 4.3.2).<br />
Approximately 7,500 Murray Cod fingerlings were stocked in total and a single batch of 40,000<br />
Golden Perch fry were stocked for weaning trials late in late November 2002.<br />
The reason for moving towards raceway culture included the reduction in labour required to operate<br />
the system, improved management of stock and improved stock security. Significant bird strike and<br />
net damage problems were experienced with the net cages on an ongoing basis. However, two separate<br />
events involving the use of an inappropriately sized screen and a damaged screen in two raceways<br />
holding fingerlings in 2002 and 2003 resulted in the escape of large numbers of silver perch<br />
fingerlings.<br />
Table 4.3.2 List of known stock escape events at Loch Eaton, estimated numbers of fish lost<br />
and the observed cause of each escape event<br />
Year<br />
Silver Perch<br />
Murray Cod<br />
Stocked Escape* Cause Stocked Escape* Cause<br />
2000 21,000 2,000 Net damage 637 Net damage<br />
2001 70,000 23,000 Net damage 4,400 3,000 Net damage<br />
2002 70,200 50,000 Inappropriate 3,100<br />
raceway screen<br />
2003 96,000 10,000 Damaged raceway<br />
screen<br />
2004 - - 27,000<br />
4.3.2 Silver Perch<br />
Silver perch growth was highly variable through the course of this study but was generally poor during<br />
and following large riverine flood harvesting activities. Due to the developmental nature of the site<br />
there was very little replication of stocking activities. These results are therefore a descriptive account<br />
of stocking activities and growth as they occurred as net cage culture was being replaced with a<br />
floating raceway culture system.<br />
4.3.2.1 Net Cages<br />
The average rate of growth for silver perch were highest for a period lasting from late 2000 until<br />
February 2001 when water quality was the best recorded in this study. Animals stocked on 7/12/00 at<br />
into an 8 m 3 cage (C1) at an average size of 57.8 g reached 103.6 g after 42 days (Table 4.3.3). During<br />
the same period fish stocked in a 100 m 3 cage (C10) at an average weight of 5.9 g reached 23.6 g. Fish<br />
stocked at average sizes of 9.4 g in an 8m 3 cage (C2) and 8.8 g in a 100 m 3 cage (C11) reached<br />
respective averages of 36.5 and 26.2 g respectively. The rates of growth for these three cages of up<br />
7.1 per cent per day were not subsequently emulated in this sized fish in cages or raceways for the<br />
remainder of this study.<br />
Water quality deteriorated rapidly in early February 2001 following an extended riverine harvest<br />
event. The cages that had performed favourably to this point continued to increase their average body<br />
28
weights as water temperatures approached 20ºC in late April 2001 (section 3.4). The rate of growth<br />
slowed during this period (Table 4.3.4) with the highest being 3.5 per cent per day for new fingerlings<br />
stocked at over 1000 animals/m 3 (C12). Similar results were obtained for two groups of fish, average<br />
weight 3.1 g and 10.3 g, stocked on the 15/02/01 and the 03/02/01 respectively. The FCR for all cages<br />
were high with the lowest being 1:2.6 again for fingerlings at high density (C12).<br />
Growth of silver perch in cages between May and early September 2001 was minimal with rates up to<br />
1:9.1 in the nine net cages used (Table 4.3.5). In five of the cages FCR could not be calculated because<br />
the average weight of fish held in these cages actually decreased during the study period. The variable<br />
stock retention in net cages in the period from the 02/03/01 to the 27/09/01 reflected the overall<br />
difficulties associated with net cage culture in 2000 and 2001. Stock retention in net cages was as low<br />
as 36.4 per cent in net cages which in part contributed to the high FCR values observed in many cages<br />
even when growth was favourable. However, stock escape alone, even if late in the culture period,<br />
would not entirely explain the poor FCRs observed in all cages. A total of 3,913 kg of feed was used<br />
for an 803 kg gain in fish biomass for the three periods presented in Tables 4.3, 4.4 and 4.5. This<br />
represents an overall farm FCR of 1:4.9 for net cages. With such a high overall FCR then clearly<br />
operator overfeeding was a factor in this study.<br />
Due to issues concerning stock retention in cages and difficulties associated with treating winter<br />
diseases, all cage culture activities were ceased by October 2001.<br />
4.3.2.2 Raceways<br />
The first 7 m 3 prototype small raceway (SR1) was stocked on the 03/05/01 with 5,784 silver perch<br />
fingerlings, average weight 3.2 g. This equates to an initial stocking density of 2.6 kg/m 3 (Table 4.3.6).<br />
At the same time an 8 m 3 net cage (C8) was stocked with another 5,744 fish from the same stock,<br />
average weight 3.2 g, at a density of 2.3 kg/m 3 (Table 4.3.5). After 76 days the respective average<br />
weights in raceway and caged fish were 3.3 and 3.6 g. A second 7 m 3 raceway (SR2) was stocked on<br />
the 04/07/01 with 11,255 fish (average weight 7.6 g) to give a stocking rate of 1,608 fish/m 3 or<br />
12.1 kg/m 3 . The average size of these fish increased to 10.5 g in 14 days. Fish of the same approximate<br />
size (6.8 g) stocked at the same time in an 8 m 3 net cage (C9) actually decreased in size during the<br />
same 14 day period (Table 4.3.5). Stock retention in both the raceways (99.8 and 98.2 per cent) and<br />
their comparative cages (99.5 and 98 per cent) was high.<br />
29
Table 4.3.3 The length of culture period (Days), number per cubic meter (N/m 3 ), initial weight<br />
(IW), final weight (FW), initial stocking density (ISDkg/m 3 ), final stocking density (FSDkg/m 3 )<br />
and daily percentage growth (G%/day) for silver perch (Bidyanus bidyanus) held in 8 and<br />
100m 3 net cages from the 07/12/00 up to the 31/01/01<br />
Cage Start Finish Days N/m 3 IW FW ISD FSD G%/day<br />
(g) (g) (kg/m 3 ) (kg/m 3 )<br />
C1 07/12/00 31/01/01 42 125 57.8 103. 7.2 12.9 1.9<br />
6<br />
C2 07/12/00 31/01/01 42 300 9.4 36.5 2.8 10.9 6.9<br />
C3 07/12/00 31/01/01 42 35.6 5.9 23.6 0.2 0.8 7.1<br />
C4 07/12/00 31/01/01 42 47.4 8.8 26.2 0.4 1.4 4.7<br />
Table 4.3.4 The length of culture period (Days), number per cubic meter (N/m 3 , initial weight<br />
(IW), final weight (FW), initial stocking density (ISDkg/m 3 ), final stocking density (FSDkg/m 3 ),<br />
percent stock retention (%SR) and daily percentage growth (G%/day) for silver perch<br />
(Bidyanus bidyanus) held in 8 and 100m 3 net cages from the 30/01/01 up to 26/04/01 in 8 and<br />
100m 3 net cages. Where FCR values are not provided their calculation had been invalidated by<br />
a lack of growth, reduction in biomass through stock loss or both<br />
Cage Start Finish Days N/m 3 IW<br />
(g)<br />
FW<br />
(g)<br />
ISD<br />
(kg/m 3 )<br />
FSD<br />
(kg/m 3 )<br />
C1 31/01/01 26/04/01 85 125 123.3 165.7 17.7 7.8 37.5 0.4 -<br />
C2 23/01/01 01/03/01 37 1375 2.9 5.9 4.0 3.6 44.5 2.8 -<br />
C3 31/01/01 26/04/01 85 35.8 54 114.6 1.8 4.1 100 1.3 1:3.5<br />
C4 15/02/01 26/04/01 70 47.4 35 91.8 1.7 4.3 100 2.3 1:3.2<br />
C5 30/01/01 26/04/01 86 1,063 1.3 10.6 1.4 11.2 100 3.5 1:2.6<br />
C6 15/02/01 26/04/01 70 612.5 3.1 8.5 1.9 5.2 100 2.5 1:4.2<br />
C7 02/03/01 26/04/01 55 771.3 10.3 18.4 7.9 14.2 100 1.4 1:3.6<br />
%SR<br />
G%/<br />
day<br />
FCR<br />
Table 4.3.5 The length of culture period (Days), number per cubic meter (N/m 3 ), initial weight<br />
(IW), final weight (FW), initial stocking density (ISDkg/m 3 ), final stocking density (FSDkg/m 3 ),<br />
percent stock retention (%SR) and daily percentage growth (G%/day) for silver perch<br />
(Bidyanus bidyanus) held in 8 and 100m 3 net cages from the 02/03/01 up to 27/09/01 in 8 and<br />
100m 3 net cages. Where FCR values are not provided their calculation had been invalidated by<br />
a lack of growth, reduction in biomass through stock loss or both<br />
Cage Start Finish Days N/m 3 IW FW ISD FSD %SR G% /day FCR<br />
(g) (g) (kg/m 3 ) (kg/m 3 )<br />
C1 11/05/01 27/09/01 139 46.8 170.5 199.8 8.0 9.2 98.4 0.1 1:9.1<br />
C2 02/03/01 07/06/01 97 599 4.5 11.0 2.7 6.4 96.9 0.0 1:4.1<br />
C3 11/05/01 02/08/01 83 24 137.5 136.6 3.3 2.5 76.3 -0.0 -<br />
C4 11/05/01 02/08/01 83 47.4 94.6 110.9 4.48 1.9 36.8 0.2 -<br />
C5 11/05/01 04/07/01 54 1063 11.1 11.2 11.8 9.2 77.7 0.0 -<br />
C6 11/05/01 18/07/01 68 737.5 10.3 10.2 7.6 6.2 83.1 -0.0 -<br />
C7 11/05/01 27/09/01 139 771.3 18.1 29.6 13.9 20.8 91.0 0.5 1:1.6<br />
C8 03/05/01 18/07/01 76 718 3.2 3.6 2.3 2.6 99.5 0.2 1:7.3<br />
C9 04/07/01 18/07/01 14 896.6 6.8 6.5 6.1 5.7 98.0 -0.3 -<br />
30
Table 4.3.6 The length of culture period (Days), number per cubic meter (N/m 3 ), initial weight<br />
(IW), final weight (FW), initial stocking density (ISDkg/m 3 ), final stocking density (FSDkg/m 3 ),<br />
stock retention (%SR) and daily percentage growth (G%/day) for silver perch (Bidyanus<br />
bidyanus) from the 02/03/01 up to 27/09/01 in 7 and 14m 3 raceways<br />
R’way Start Finish Days N/m 3 IW FW ISD FSD %SR G%/day<br />
(g) (g) (kg/m 3 ) (kg/m 3 )<br />
SR1 03/05/01 18/07/01 76 826 3.2 3.3 2.6 2.8 99.8 0.1<br />
SR2 04/07/01 18/07/01 14 1608 7.6 10.5 12.1 16.4 98.2 2.8<br />
On the 02/08/01 all caged fish from C8 were transferred to SR1 to give a new stocking density of<br />
19.1 kg/m 3 or 3,709 fish/m 3 (Table 4.3.7). The second of the small raceways (SR2) was graded on the<br />
02/08/01 to reduce the numbers of fish to 5,543 and give an average weight of 20.4 g at a density of<br />
16.0 kg/m 3 . A third 14 m 3 raceway (MR1) was also stocked on the 02/08/01 with 129.6 g fish at a rate<br />
of 255 fish/m 3 or 33.1 kg/m 3 . Fifty six (SR1 and SR2) and 28 days later (MR1) the average weights of<br />
fish in all raceways had increased only marginally to 6.0, 22.2 and 142.1 g respectively. This equates<br />
to a daily growth rate of 0.3, 0.2 and 0.3 per cent. Mortality in the three units was minimal and stock<br />
retention was equivalent to 99.2, 99.1 and 97.6 per cent of fish stocked.<br />
On the 07/11/01 three 7 m 3 and three 14 m 3 raceways were re-stocked (Table 4.3.8). The three 7 m 3<br />
raceways were stocked at rates of 1,393 (SR1), 1,453 (SR2) and 977 (SR3) fish/m 3 with fish weighing<br />
15.9, 5.9 and 10.4 g respectively. These raceways were operated for 83 days before being harvested.<br />
At harvest, the average weights had increased to 35.3, 25.3 and 22.5 g respectively. The rates of<br />
growth in these three raceways were 1.5, 3.9 and 1.4 per cent per day. Survival was high in all<br />
raceways with the lowest being 92.9 per cent (SR1). The FCRs in these three 7 m 3 raceways were<br />
1:1.8, 1:1.5 and 1:4.1 respectively. The three 14 m 3 raceways were stocked with 69.7 (MR1), 31.1<br />
(MR2) and 198.3 g (MR3) fish. The respective numbers stocked were equal to 358, 1,063 and 332/m 3 .<br />
Survival was again high with 100, 92 and 100 per cent of stock retained at harvest. However, growth<br />
in raceways over this period was variable with average weights in MR1 and MR2 increasing to 98.5<br />
and 77 g while the average weight of fish in MR3 decreased to 189 g. The raceway with the highest<br />
rate of growth of 1.8 per cent per day (MR2) also returned an FCR of 1:1.6. In comparison the other<br />
14 m 3 raceway with 0.5 per cent per day growth (MR1), had an FCR of 1:6.9. In the raceway with no<br />
apparent growth 453 kg of feed was used for a net loss of biomass. This inconsistent FCR values for<br />
raceways during the period from 07/11/01 to 29/01/02 indicates significant operator over feeding in<br />
some instances. This may have been the result of poor feeding response and/or overfeeding by the<br />
operator in some raceways.<br />
On the 05/02/02 all raceways were graded and re-stocked with various size classes of fish<br />
(Table 4.3.9). A number of new TAMCO raceways were also added. In the only remaining 7 m 3<br />
raceway (SR3), 64.5 g fish were stocked at a rate of 165/m 3 giving a density of 10.6 kg/m 3 . At the<br />
same time similar sized fish averaging 68 g, were stocked into a larger 14 m 3 raceway (MR2) at a rate<br />
of 393/m 3 or 26.7 kg/m 3 . The 7m 3 raceway was harvested after 91 days on the 07/05/02 when fish<br />
weight averaged 132.8 g. This represents a growth rate of 1.3 per cent per day. Stock retention was<br />
high with only 14 mortalities observed and 979 fish harvested. The final operating density was<br />
18.6 kg/m 3 . The 14 m 3 raceway was harvested after 91 days with stock averaging 135.2 g. The final<br />
operating density in this raceway was 53.0kg/m 3 . Survival was again high with only 19 observed<br />
mortalities and 4,502 fish harvested. Growth in the 14 m 3 raceways did not appear to be detrimentally<br />
affected by an increase in density. Similar results were observed for 137 g and 140 g fish stocked at 76<br />
and 168fish/m 3 in identical 1m 3 raceways (MR4 and MR6). In this case, both raceways were stocked<br />
and harvested at the same time (after 91 days). Fish from the lower density raceway (MR4) averaged<br />
216.5 g and fish in the higher density raceway (MR6) averaged 232.2 g at harvest. Stock retention and<br />
therefore survival was unaffected by density with 95.0 and 99.8 per cent of stock being harvested from<br />
the low and high density raceways respectively.<br />
31
Stock retention was also high in the remaining raceways (MR 1, MR3, MR5, M1) over this period<br />
(05/02/02 – 07/05/02) (Table 4.3.9). The lowest stock retention rate of 83.8 per cent was in one of the<br />
new 12 m 3 TAMCO model raceways (M1) which was stocked with 43,632 fingerlings at 1.3 g each<br />
(M1).<br />
After 65 days 33,503 fish were harvested with an average weight of 7.2 g. The low rate of stock<br />
retention in this raceway was the result of 3,220 mortalities that were associated with a prophylactic<br />
treatment given to the stock during the latter part of the culture period. In the remaining three<br />
raceways (MR1, MR3, MR5), fish with average weights of 13.8, 30.7 and 253 g were stocked at rates<br />
of 984, 883 and 90 fish/m 3 respectively. The first of these raceways (MR1) was harvested after<br />
76 days with fish averaging 31.3 g. The second raceway (MR3) was harvested at an after 91 days with<br />
61.2 g average fish while the third raceway (MR5) was harvested after 76 days with 299 g fish. Rates<br />
of retention were equivalent to 99.1, 99.1 and 99.2 per cent respectively for these three raceways. The<br />
growth rates in these raceways were 0.4 (MR1), 1.1 (MR3) and 0.2 per cent per day (MR5).<br />
The FCR values for all raceways were above two for the period between 05/02/02 to 07/05/02. The<br />
highest FCR was recorded for the raceway with the largest fish (MR5). This raceway had an FCR of<br />
1:8.6. For fish with an average size of 299.3 g this high FCR value indicates a high degree of<br />
overfeeding. This raceway had a comparatively low stocking density of 90 fish/m 3 . The other high<br />
FCR values of 1:6.0 and 1:4.2 were obtained in raceways stocked at 76 (MR4) and 165fish/m 3 (SR3)<br />
respectively. In comparison, FCRs in raceways stocked at densities of 168 fish/m 3 for 140.0 g fish<br />
(MR6) and 393 fish/m 3 for 68 g fish (MR2) were 1:2.3 and 1:2.1 respectively. This data suggests that<br />
overfeeding in raceways may be a combination of differing fish feeding behaviour associated with<br />
feed response and operator feeding practices.<br />
The growth of all size classes of fish in raceways was minimal over the winter of 2002. From the<br />
19/07/02 until the 21/10/02 the average growth rate of fish was less than 0.24 ± 0.59 per cent per day<br />
(Table 4.3.10). The highest rate of growth was recorded in fish stocked at 19.9 g at a density of<br />
17.8 kg/m 3 (SR2). A reduction in average weight was recorded for the raceway stocked with the<br />
largest fish at 41.4 kg/m 3 (MR5). The combined net weight gain for all raceways over this period was<br />
794kg.<br />
On the 06/11/02 fish from all raceways were graded and stocked into similar size classes (Table<br />
4.3.11). All but one of the 14m 3 prototype raceways (MR4) had been superseded with new TAMCO<br />
raceways. Approximately 35,410 fish averaging 4.6 g were stocked into a 12 m 3 raceway (S4) at a<br />
density of 2,950 fish/m 3 (13.5 kg/m 3 ). On the 18/02/02, after 104 days, these fish averaged 33.2 g and<br />
reached a final density of 86 kg/m 3 . This represents an average daily growth of 6.0 per cent per day.<br />
Good rates of growth were also observed for 12.1 and 30.2 g fish stocked in two 12 m 3 raceways at<br />
densities of 804 fish/m 3 (S5) and 1,068 fish/m 3 (S6). These fish reached 46.9 and 74.8 g respectively<br />
after 104 days growing at rates of 2.8 (S5) and 1.4 per cent per day (S6). The final densities in these<br />
raceways were high at 52 and 116 kg/m 3 . In all three cases (S4, S5 and S6) survival was high with<br />
87.6, 95 and 99.3 per cent of the stock retained. Larger fish (IW average 62.4 and 131.2g) were also<br />
stocked at high densities (32.3 and 69.7 kg/m 3 ) in two 17.5 m 3 raceways (M1 and M2). The lower than<br />
expected stock retention of 78.9 per cent in M2 was the result of mortality experienced during a single<br />
prophylactic treatment on the 11/12/02.<br />
The high retention figures assisted in achieving relatively high final operating densities of 65.3 and<br />
81.4 kg/m 3 .<br />
Fish with average weights approaching 244.7 and 296.7 g were stocked into two raceways (M3 and<br />
MR4) at 59.4 and 39.2 kg/m 3 (Table 4.3.11). Although some growth was recorded, these raceways<br />
were regularly graded to remove market sized fish and so any figures concerning average weight are<br />
not an accurate indication of final weights.<br />
The FCR for all raceways during the period from 06/11/02 to 18/02/02 ranged between 1:1.3 and 1:4.7<br />
(Table 4.3.11). The lowest FCR values were obtained for 4.6 (S4), 12.1 (S5) and 30.2 g fish (S6)<br />
stocked at densities for their size class. The FCR’s for these raceways were 1:1.3, 1:2.1 and 1:1.6<br />
respectively. Fish stocked with an average weight of 62.4 g (M1) returned an FCR of 1:2.1. The worst<br />
32
FCR value of 1:4.7 was recorded in fish stocked at an average size of 121.1 g and harvested at 193 g<br />
after 98 days (M2). The low survival of 78.9 per cent may have contributed to the high FCR value in<br />
this raceway.<br />
Table 4.3.7 The length of culture period (Days), number per cubic meter (N/m 3 ), initial weight<br />
(IW), final weight (FW), initial stocking density (ISDkg/m 3 ), final stocking density (FSDkg/m 3 ),<br />
percent stock retention (%SR) daily percentage growth (G%/day) and food conversion ratio<br />
(FCR)for silver perch (Bidyanus bidyanus) from the 02/03/01 up to 27/09/01 in 7 and 14m 3<br />
raceways<br />
R’way Start Finish Days N/m 3 IW FW ISD FSD %SR G%/day FCR<br />
(g) (g) (kg/m 3 ) (kg/m 3 )<br />
SR1 02/08/01 27/09/01 56 3709 5.1 6.0 19.1 22.1 99.2 0.3 1:2.9<br />
SR2 02/08/01 27/09/01 56 784 20.4 22.2 16.0 17.1 99.1 0.2 1:5.6<br />
MR1 30/08/01 27/09/01 28 255 129.6 142.1 33.1 36.3 97.6 0.3 1:1.9<br />
Table 4.3.8 The length of culture period (Days), number per cubic meter (N/m 3 ), initial weight<br />
(IW), final weight (FW), initial stocking density (ISDkg/m 3 ), final stocking density (FSDkg/m 3 ),<br />
percent stock retention (%SR), daily percentage growth (G%/day) and food conversion ratio<br />
(FCR) for silver perch (Bidyanus bidyanus) from the 02/03/01 up to 27/09/01 in 7 and 14m 3<br />
raceways. Where FCR values are not provided their calculation had been invalidated by a lack<br />
of growth, reduction in biomass through stock loss or both<br />
R’way Start Finish Days N/m 3 IW FW ISD FSD %SR G%/day FCR<br />
(g) (g) (kg/m 3 ) (kg/m 3 )<br />
SR1 07/11/01 29/01/02 83 1393 15.9 35.3 22.2 45.7 92.9 1.5 1:1.8<br />
SR2 07/11/01 29/01/02 83 1453 5.9 25.3 8.7 36.7 100 3.9 1:1.5<br />
SR3 07/11/01 29/01/02 83 977 10.4 22.5 10.2 22.0 100 1.4 1:4.1<br />
MR1 07/11/01 29/01/02 83 358 69.7 98.5 25.0 35.3 100 0.5 1:6.9<br />
MR2 07/11/01 29/01/02 83 1063 31.1 77.0 33.1 75.2 91.9 1.8 1:1.6<br />
MR3 07/11/01 29/01/02 83 332 198.3 189.0 65.9 62.8 100 -0.1 -<br />
Table 4.3.9 The length of culture period (Days), number per cubic meter (N/m 3 ), initial weight<br />
(IW), final weight (FW), initial stocking density (ISDkg/m 3 ), final stocking density (FSDkg/m 3 ),<br />
percent stock retention (%SR), daily percentage growth (G%/day) and food conversion ratio<br />
(FCR) for silver perch (Bidyanus bidyanus) from the 05/02/02 up to 07/05/02 in 7 and 14m 3<br />
raceways as well as a single 12m 3 raceway<br />
R’way Start Finish Days N/m 3 IW FW ISD FSD %S G%/day FCR<br />
(g) (g) (kg/m 3 ) (kg/m 3 ) R<br />
SR3 05/02/02 07/05/02 91 165 64.5 132.8 10.6 18.6 84.8 1.2 1:4.2<br />
MR1 05/02/02 22/04/02 76 984 13.8 31.3 13.6 30.6 99.1 0.4 1:2.9<br />
MR2 05/02/02 22/04/02 76 393 68.0 135.2 26.7 53.0 99.7 1.3 1:2.1<br />
MR3 05/02/02 07/05/02 91 883 30.7 61.2 27.1 54.9 99.1 1.1 1:2.1<br />
MR4 05/02/02 07/05/02 91 76 137.0 216.5 10.4 15.7 95.0 0.6 1:6.0<br />
MR5 05/02/02 22/04/02 76 90 253.0 299.3 22.8 26.8 99.2 0.2 1:8.6<br />
MR6 05/02/02 07/05/02 91 168 140.0 232.2 23.5 42.5 99.8 0.7 1:2.3<br />
M1 03/03/02 07/05/02 65 3636 1.3 7.2 4.6 21.8 83.8 7.2 1:1.7<br />
33
Table 4.3.10 The length of culture period (Days), number per cubic meter (N/m 3 ), initial weight<br />
(IW), final weight (FW), initial stocking density (ISDkg/m 3 ), final stocking density (FSDkg/m3),<br />
percent stock retention (%SR), daily percentage growth (G%/day) and food conversion ratio<br />
(FCR) for silver perch (Bidyanus bidyanus) from the 19/07/02 up to 21/10/02 in 7 and 14m 3<br />
raceways. FCR values are not provided their calculation had been invalidated by a lack of<br />
growth or a reduction in biomass through stock loss<br />
R’way Start Finish Days N/m 3 IW<br />
(g)<br />
FW<br />
(g)<br />
ISD<br />
(kg/m 3 )<br />
FSD<br />
(kg/m 3 )<br />
SR2 19/07/02 21/10/02 94 891 19.9 37.1 17.8 33.0<br />
SR3 19/07/02 21/10/02 94 1844 9.5 16.7 17.5 30.8<br />
MR2 19/07/02 21/10/02 94 215 72.7 98.5 15.6 21.1<br />
MR3 19/07/02 21/10/02 94 191 142.9 177.6 27.3 33.9<br />
MR4 19/07/02 21/10/02 94 764 40.9 54.9 31.2 41.9<br />
MR5 19/07/02 08/10/02 81 133 311.8 296.6 41.4 39.3<br />
MR6 19/07/02 21/10/02 94 486 76.8 94.4 37.3 45.3<br />
MR7 19/07/02 21/10/02 94 3428 3.8 5.6 13.1 19.3<br />
MR8 19/07/02 21/10/02 94 205 165.6 190.7 33.9 39.0<br />
MR9 19/07/02 21/10/02 94 170 284.1 294.2 48.2 49.9<br />
Two 12 m 3 raceways (S1 and S2) were stocked with separate batches of fingerlings averaging 2.5 and<br />
1.5 g on the 11/03/03 and the 25/03/03 (Table 4.3.12). In the raceway with fish averaging 2.5 g (S1)<br />
the stocking density was 10.9 kg/ m 3 (4,364fish/m 3 ) while the smaller 1.5 g fish (S2) were stocked at<br />
5.7 kg/m 3 (3,833fish/m 3 ). Both raceways were harvested on the 15/04/03 (35 and 21 days after<br />
stocking). The average weights of fish at harvest were 5.5 and 3.8 g respectively. This equates to a<br />
daily increase in weight of 3.5 and 7.5 per cent per day. In both cases stock retention was high at 97.1<br />
and 98.7 per cent. The low FCR in the raceway with the fastest rate of growth (S2) may indicate that<br />
some benefit may be obtained from the natural productivity within the ring tank.<br />
On the 20/02/03 an additional four 12 m 3 raceways and four 17.5 m 3 raceways were graded and<br />
restocked with a total of 87,390 fish at various densities and size classes. The smallest fish with an<br />
average weight 15.4 g were stocked at a density of 6.4 kg/m 3 or 417 fish/m 3 in one of the 12 m 3<br />
raceways (S3). After 33 days the average size of fish had increased to 27.1 g. The next largest group of<br />
fish with an average weight of 23.8 g were re-stocked into another 12 m 3 raceway (S4) at a density of<br />
17.9 kg/m 3 or 750 fish/m 3 . These fish reached an average of 36.6 g after 33 days with little observed<br />
mortality. The two remaining 12 m 3 raceways (S5 and S6) were stocked with fish averaging 48.7 and<br />
51.9 g at a density of 69.6 and 70.4 kg/m 3 respectively. These raceways reached final average weights<br />
of 71.3 (S5) and 88.9 g (S6) after 33 days. The four 17.5 m 3 raceways were stocked with 120.4 (M1),<br />
161.3 (M2), 246.2 (M3) and 390.6 g (M4) average fish at rates of 81, 60.6, 92.6 and 53.4 kg/m 3<br />
respectively. These raceways were harvested and graded again after 33 days. The average weights at<br />
harvest were 119.6 (M1), 173.6 (M2), 224.1 (M3) and 408.43 g (M4). Mortality rates were again low<br />
with stock retention rates as equalling 99.7, 99.7, 97.4 and 98.8 per cent in M1, M2, M3 and M4<br />
respectively.<br />
The widely variable FCR values observed in raceways S5 and S6 stocked at similar densities, with<br />
approximately the same sized fish, is an indication of operator overfeeding in response to an apparent<br />
poor feed response. Feed input in S5 was 401 kg for the period from the 20/02/03 to the 25/03/03 for a<br />
net biomass gain of just 20.7 kg. In comparison, 376 kg of feed was fed to S6 for a net gain in biomass<br />
of 222.8 kg. The high %SR value and lack of growth in S5 indicates that feed management practices in<br />
this raceway were not adjusted to suit the feed response of the stock. Similarly poor growth and high<br />
rates of feeding also yielded poor FCR results in all four 17.5 m 3 raceways during this period with<br />
1,373 kg of feed being delivered for a combined loss of 20 kg of biomass.<br />
With the exception of two 12 m 3 raceways that were graded and stocked on the 22/04/03 and a single<br />
17.5 m 3 raceway that was stocked on the 08/04/03, all fish in the remaining four 12 m 3 and the four<br />
17.5 m 3 raceways were graded and restocked by the 13/05/03 (Table 4.3.13). Two of the 12 m 3<br />
raceways (S1 and S2) were restocked for the winter period with fish averaging 3.9 and 7.2 g at<br />
34
densities of 13.6 and 9.4 kg/m 3 . These fish averaged 19.2 and 14.5 g respectively after 251 and 160<br />
days. The other two 12 m 3 raceways (S4 and S5) were left empty until being restocked on the 13/05/03<br />
with 18.2 and 36.2 g fish at densities of 14.8 and 17.1 kg/m 3 . These animals average 31.3 (S4) and<br />
72.5g (S5) after 230 and 240 days respectively representing a growth rate of 0.3 and 0.4 per cent per<br />
day. On the 08/04/03, 68.0 g fish were stocked at a density of 68 kg/m 3 in a 12 m 3 raceway (S6).<br />
These fish averaged 92.9 g after 275 days, a growth rate of 0.1 per cent day. The resulting final<br />
operating density was 127.5 kg/m 3 . In comparison, 61.7 g fish stocked one month later at a rate of 49.8<br />
g/m 3 (M1) reached a similar final average weight of 97.1 after 230 days.<br />
In three of the 17.5 m 3 raceways 121.6 (M2), 128.4 (M3) and 183.2 g fish (M4) were stocked at<br />
densities of 50.3, 52.2, and 49.4 kg/m 3 respectively. The average weights increased to 166.6 g after<br />
195 days (M2) and 173.3 (M3) and 257.5 g (M4) after 265 days. The final operating densities in these<br />
raceways were 67.1, 44.8 and 53.8 kg/m 3 respectively. In the remaining 17.5 m 3 raceway (M5),<br />
253.8 g fish were stocked at a density of 68.3 kg/m 3 . The average weight of fish in this raceway fell<br />
after 230 days to 225.9 g. The largest fish, average 357.1 g, were stocked into a 23 m 3 raceway (L1).<br />
The lack of growth and reduction in stocking density in this raceway was a function of high mortality<br />
observed in this raceway and not from harvest of market sized fish.<br />
A series of riverine pumping events in late 2003 and January 2004 rapidly lowered dissolved oxygen<br />
levels to critical levels in the ring tank. The first of these events resulted in high mortalities in a<br />
number of raceways including those holding market sized fish of 400 g and above. For the week<br />
corresponding with riverine pumping from the 07/12/03 to the 20/12/03 there were in excess of 10,000<br />
mortalities. Of these only 61 or just under 1 per cent occurred in the small raceways (S1 to S6) during<br />
or after the water harvesting events. The 23 m 3 raceway L1 was carrying the largest fish and suffered<br />
the highest recorded mortality of 63.1 per cent. The next highest mortality level of 36.4 per cent was<br />
recorded in M3. However, these figures may have been higher as accurate figures of mortalities were<br />
not kept by some farm staff due to the urgency of removing dead fish from the raceways.<br />
4.3.2.3 Extensive Stocking<br />
Only small numbers of market sized silver perch were re-captured using hook and line and lift net.<br />
These were not commercial quantities and the process of collection was labour intensive and<br />
unreliable. No fish were recaptured in drum nets despite over 30 days of deployment.<br />
4.3.3 Murray Cod<br />
Three separate batches of Murray cod fingerlings were received at Loch Eaton during the course of<br />
this study. Difficulties were experienced with all three batches of fish. These difficulties were<br />
associated with low numbers of stock of distinct size classes as the result of stock loss to disease and<br />
also stock escape.<br />
On the 02/03/01 two 8 m 3 net cages were stocked with a single cohort of Murray cod fingerlings. The<br />
first cage was stocked with 2,520 fish (average weight of 2.10 g) and the second with 1,130 fish<br />
(average weight 1.20 g). The growth rate of these two cages averaged 5.29 per cent per day until<br />
harvest on the 26/04/01. However, as with silver perch in cages, stock retention was poor with only<br />
2,035 of the initial 3,650 fish returned. After grading and restocking, growth was slowed over the<br />
winter months and averaged just 0.17 per cent per day over the next 147 days. However, this growth<br />
rate was severely compromised by stock escape and mortality. On the 29/09/01 only 411 of the 2,035<br />
fish stocked in the two net cages were harvested. These were later released into the dam as their<br />
numbers were insufficient to warrant further grow out effort.<br />
4.3.4 Golden perch<br />
In October 2002 a single batch of 1g golden perch fingerlings were stocked directly into one 12.5 m 3<br />
raceway.<br />
35
4.3.5 Disease Detection and Treatment<br />
With respect to fish health, “winter disease” symptoms associated with the presence of the<br />
ectoparasites Trichodina sp., Chilodonella sp., Epistylis sp. and Ichthyophthirius multifiliis were<br />
detected on occasion in skin and gill scrapings examined during routine health checks. Two digenean<br />
parasite species were found, one distinct species in Murray Cod and one in silver perch. Flexibacter<br />
sp. was the only bacterial pathogen detected.<br />
Generally pathogen outbreaks were linked to occasions where poor environmental conditions persisted<br />
as the result of poor husbandry practices. The incidence and severity of any outbreak in a production<br />
unit were reduced once these issues where addressed.<br />
Presence of Flexibacter sp. and its associated symptoms were found in fingerlings of both Murray Cod<br />
and silver perch in 2002 within 24 hrs of delivery. On both occasions appropriate treatments were<br />
initiated.<br />
Table 4.3.11 The length of culture period (Days), number per cubic meter (N/m 3 ), initial weight<br />
(IW), final weight (FW), initial stocking density (ISDkg/m 3 ), final stocking density (FSDkg/m 3 ),<br />
percent stock retention (%SR), daily percentage growth (G%/day) and food conversion ratio<br />
(FCR) for silver perch (Bidyanus bidyanus) from the 06/11/02 up to 18/02/03 in 12 and 17.5m 3<br />
raceways as well as a single 14m 3 raceway. Where FCR values are not provided their<br />
calculation had been invalidated by a lack of growth, a reduction in biomass through stock<br />
loss, or a reduction in biomass from fish harvest<br />
R’way Start Finish Days N/m 3 IW FW ISD FSD %SR G%/day FCR<br />
(g) (g) (kg/m 3 ) (kg/m 3 )<br />
S3 28/01/03 18/02/03 21 - 8.6 15.4 - - - 3.7 -<br />
S4 06/11/02 18/02/03 104 2950 4.6 33.2 13.5 85.9 87.6 6.0 1:1.3<br />
S5 06/11/02 18/02/03 104 1125 12.1 46.9 14.2 52.1 95.0 2.8 1:2.1<br />
S6 06/11/02 18/02/03 104 1496 30.2 74.8 47.1 115.9 99.3 1.4 1:1.6<br />
M1 07/11/02 18/02/03 98 518 62.4 126.6 32.3 65.3 98.9 1.1 1:2.2<br />
M2 07/11/02 18/02/03 98 531 121.1 193.0 64.3 81.4 78.9 0.6 1:4.7<br />
M3 * 18/11/02 18/02/03 69 200 244.7 307.5 59.4 61.4 ¥ 99.5 ¥ 0.4 ¥ -<br />
MR4 * 18/11/02 18/02/03 69 132 296.7 383.6 39.3 49.6 ¥ 99.7 ¥ 0.4 ¥ -<br />
* Raceways that had stock removed as market sized fish.<br />
¥ Final figures adjusted for numbers of fish removed for market supply.<br />
36
Table 4.3.12 The length of culture period (Days), number per cubic meter (N/m 3 ), initial weight<br />
(IW), final weight (FW), initial stocking density (ISDkg/m 3 ), final stocking density (FSDkg/m 3 ),<br />
percent stock retention (%SR), daily percentage growth (G%/day) and food conversion ratio<br />
(FCR) for silver perch (Bidyanus bidyanus) from the 20/02/02 up to 25/03/03 in 12 and 17.5m 3<br />
raceways. Where FCR values are not provided their calculation had been invalidated by a lack<br />
of growth, a reduction in biomass through stock loss, or a reduction in biomass from fish<br />
harvest<br />
R’way Start Finish Days N/m 3 IW FW ISD FSD %SR G%/day FCR<br />
(g) (g) (kg/m 3 ) (kg/m 3 )<br />
S1 11/03/03 15/04/03 35 4364 2.5 5.5 10.9 24.1 97.1 3.5 1:1.9<br />
S2 25/03/03 15/04/03 21 3833 1.5 3.8 5.7 14.5 98.7 7.5 1:0.8<br />
S3 20/02/03 25/03/03 33 417 15.4 27.1 6.4 11.3 99.9 2.3 1:1.5<br />
S4 20/02/03 25/03/03 33 750 23.8 36.6 17.9 27.5 99.9 1.6 1:2.5<br />
S5 20/02/03 25/03/03 33 1429 48.7 49.3 69.6 71.3 99.9 0.1 1:19.4<br />
S6 20/02/03 25/03/03 33 1355 51.9 65.6 70.4 88.9 99.8 0.8 1:1.7<br />
M1 20/02/03 25/03/03 33 673 120.4 119.6 81 80.5 99.7 -0.0 -<br />
M2 20/02/03 25/03/03 33 376 161.3 173.6 60.6 65.2 99.7 0.2 1:6.3<br />
M3 20/02/03 25/03/03 33 376 246.2 224.1 92.6 84.3 97.4 -0.3 -<br />
M4 * 20/02/03 25/03/03 33 137 390.6 408.4 53.4 55.6 ¥ 98.8 ¥ 0.1 ¥ -<br />
* Raceways that had stock removed as market sized fish.<br />
¥ Final figures adjusted for numbers of fish removed for market supply.<br />
Table 4.3.13 The length of culture period (Days), number per cubic meter (N/m 3 ), initial weight<br />
(IW), final weight (FW), initial stocking density (ISDkg/m 3 ), final stocking density (FSDkg/m 3 ),<br />
percent stock retention (%SR), daily percentage growth (G%/day) and food conversion ratio<br />
(FCR) for silver perch (Bidyanus bidyanus) from the 08/04/03 up to 08/04/04 in 12, 17.5 and<br />
23m 3 raceways. Where FCR values are not provided their calculation had been invalidated by a<br />
lack of growth, a reduction in biomass through stock loss, or a reduction in biomass from fish<br />
harvest<br />
R’way Start Finish Days N/m 3 IW FW ISD FSD %SR G%/day FCR<br />
(g) (g) (kg/m 3 ) (kg/m 3 )<br />
S1 22/04/03 29/12/03 251 3525 3.9 19.2 13.6 67.5 99.7 1.6 1:0.9<br />
S2 22/04/03 29/09/03 160 1305 7.2 14.5 9.36 19.0 99.6 0.9 1:2.0<br />
S4 13/05/03 29/12/03 230 817 18.2 31.3 14.8 17.5 68.3 0.3 1:28.8<br />
S5 13/05/03 08/01/04 240 473 36.2 71 17.1 32.4 94.5 0.4 1:4.6<br />
S6 08/04/03 08/01/04 275 1355 68.0 92.9 92.5 127.5 92.7 0.2 1:2.2<br />
M1 13/05/03 29/12/03 265 807 61.7 97.1 49.8 69.7 88.9 0.1 1:5.5<br />
M2 13/05/03 08/01/04 195 414 121.6 166.6 50.3 67.1 97.4 0.2 1:3.2<br />
M3 13/05/03 08/01/04 265 407 128.4 173.3 52.2 44.8 63.6 0.1 -<br />
M4 13/05/03 08/01/04 265 270 183.2 257.5 49.4 53.8 77.3 0.2 1:23.6<br />
M5 13/05/03 08/01/04 275 263 253.8 225.9 68.3 43.9 73.9 0.0 -<br />
L1 * 13/05/03 08/01/04 80 137 357.1 314.1 48 17.7 ¥ 35.9 ¥ 0.0 -<br />
* Raceways that had stock removed as market sized fish.<br />
¥ Final figures adjusted for numbers of fish removed for market supply.<br />
4.4 Discussion<br />
In general, the growth of fish in raceways during this study was generally slower than that required for<br />
successful commercial culture. This was in part due to the poor water quality conditions present for the<br />
majority of the study period as the result of periodic riverine harvesting activities. The best growth<br />
rates for silver perch were generally obtained in summer months early in the study when water quality<br />
was at its best.<br />
37
The average rate of growth for silver perch was highest in net cages following their initial stocking in<br />
late 2000. During this period the average rate of growth of all animals below 50 g was 3.5 per cent per<br />
day while the rate of growth for animals above 50 g averaged 1.3 per cent per day. Animals stocked at<br />
an average size of 58 g reached 137 g after 10 weeks. During the same period fish stocked at an<br />
average weight of 9.4 g and 5.9 g reached 50 g and 35 g respectively after 10 weeks. However, these<br />
favourable rates of growth slowed after a major pumping event in February when water turbidity<br />
increased and dissolved oxygen levels decreased. Low DO levels stress fish, reduce feeding activity<br />
and lower feed conversion efficiencies (Diana, 1997). However, despite the comparative fall in growth<br />
rates after the February pumping event the average growth of caged fish was still generally better that<br />
that observed in the floating raceways during the same period in later years.<br />
The major issues associated with the use of net cages were the retention of fish and the generally poor<br />
FCR values. Although growth in cages was favourable the amount of feed used was high because of<br />
difficulties in feed delivery, feeding behaviour and also stock retention. Stock retention in net cages<br />
was as low as 36.4 per cent in cages that actually reached harvest. The loss of fish from cages during<br />
this study was approximately 25,000. Most were lost from cages holding small fish (
density of 94 kg/m 3 . Similarly, catfish grown at densities of 63.4 kg/m 3 have been reported as being<br />
achieved with FCR’s between 1.8 and 2.1 feed to satiation, and an average survival of 83.6 per cent<br />
(Yoo et al, 1995). The higher densities have been reported for catfish at 136-154 kg/m 3 (Masser,<br />
Wilcox, Yoo and Sonnenholsner, 1999). Additional studies conducted by the authors (Appendix 1)<br />
demonstrated the same raceway system as used in this study could be used to successfully growout<br />
barramundi (Lates calcarifer) while achieving significant operational cost savings with respect to feed<br />
use, labour and stock retention. In the case of barramundi, fish stocked in 14 m 3 raceways at 28.5 g<br />
were grown to 128.5 g in 75 days with a survival rate of 94.2 per cent and an FCR of 1.17. When<br />
compared to the farms cage culture results, the FCR, survival and labour costs in raceways were 65,<br />
15, and 59 per cent lower in raceways (Authors unpublished data). Similarly, although not achieved in<br />
this study, the culture of Murray cod in raceways is showing promise. A recent harvest of cod from a<br />
floating raceway operation established on a farm reservoir in southern Queensland recently began<br />
harvest of 1 to 2 kg Murray cod in its second year of operation (Matteo Barchesi, pers comm). Another<br />
farm has been established for freshwater eels (Anguilla reinhardtii) using the same technology as Loch<br />
Eaton on an irrigation storage in coastal south east Queensland. This system is also performing well<br />
with eels over 1 kg being produced at densities of 87 kg/m 3 and above (Samuel Bell, pers comm).<br />
In this study, the performance of silver perch in floating raceways was detrimentally affected by the<br />
prevailing water quality conditions at Loch Eaton. The performance of this species under more<br />
favourable conditions should be investigated. However, species such as Murray cod may be better<br />
suited to the floating raceway system because of their proven performance at culture densities in<br />
excess of 80-150 kg/m³ (VDPI). While the cage trials for Murray cod attempted in this study were<br />
encouraging, stock losses due to escape prevented the collection of data beyond the juvenile stage.<br />
Future establishment of aquaculture facilities in cotton catchments within the Murray Darling basin<br />
should consider the Murray cod as the prime species of investigation if intensive systems like the<br />
floating raceway technology are to be used.<br />
Although the raceways did generally maintain high densities of fish during periods when DO levels<br />
were chronically low, significant stock mortalities were observed on at least one occasion when<br />
oxygen levels fell rapidly in response to a large riverine pumping event. Additional oxygen<br />
supplementation capacity has been installed in other floating raceway systems for emergency<br />
applications and is likely to have alleviated the acute oxygen debt experienced during the harvest of<br />
flood waters in this study. Alternatively, more appropriate placement of the aquaculture operation<br />
would serve to buffer the system from the introduction of large volumes of poorly oxygenated water.<br />
At Loch Eaton this would involve relocating the aquaculture operation from the ring tank that receives<br />
water during events to the adjacent ring tank cell which is filled via overflow from the receiving ring<br />
tank (Fig 4.4.1). This would enable some settlement and oxygenation of water within the receiving<br />
ring tank while decreasing the total water exchange through the aquaculture storage. In addition, when<br />
water levels are low farms like Loch Eaton could pass groundwater through the aquaculture ring tank<br />
in order to further improve water quality. However, the use of groundwater in this way would only be<br />
recommended if it occurred in conjunction with irrigation events so as to reduce water losses. The<br />
storage of groundwater in above ground ring tanks for extended periods will result in significant losses<br />
due to seepage and evaporation. In some cases the additional pumping costs and infrastructure<br />
required to deliver groundwater to the aquaculture ring tank may be prohibitive. In these situations the<br />
correct placement of the aquaculture operation in ring tanks receiving surface waters becomes critical<br />
as does a consistent and reliable surface water flow.<br />
39
R<br />
E<br />
Figure 4.4.1 Existing (E) and recommended (R) locations of aquaculture facilities and pumping<br />
infrastructure at Loch Eaton. Relocation of the floating raceway facility from the primary ring<br />
tank to the adjacent storage would serve to buffer the aquaculture facility from acute falls in<br />
dissolved oxygen as the result of harvesting large volumes of oxygen deficient, highly turbid<br />
flood waters<br />
Although over the course of the study it was observed that the raceways were more secure against bird<br />
strike and frequency of stock escape, the higher numbers of fingerlings held in each raceway meant<br />
that just two events represented a larger loss of stock than were experienced with cages. Over 60,000<br />
fingerlings were lost in two separate events. The first was related to operator error where a large<br />
meshed screen was used for small fingerlings at stocking resulting in the escape of an estimated<br />
50,000 fish. The second was related to a damaged rear screen which permitted the escape of over<br />
10,000 fingerlings. The cause of this event was unknown but prompted a review of the securing of the<br />
plastic oyster mesh screen to the raceways. Both events do highlight the higher risk associated with<br />
running high densities of fish in raceways located in open water bodies.<br />
While the growth of silver perch in this study was generally lower than that required for a successful<br />
commercial operation it did highlight the benefits and constraints of the two systems most likely to be<br />
applied. In this instance net cages returned favourable rates of growth but proved problematic with<br />
respect to stock retention, food conversion, disease management and labour requirements. Their use<br />
also restricted the farms irrigation capacity with respect to the volume of water required to enable their<br />
operation. The drop of the larger net cages required the ring tank water level to maintained essentially<br />
at capacity or al least 6 m to allow 1m clearance from the bottom of the storage. In contrast the<br />
floating raceways remained operational even when water levels had fallen to less than 2 m. In terms of<br />
the impact of the aquaculture on the whole of farm operation the ability to utilise more of the ring tank<br />
water for irrigation is a significant advantage for the raceway system over cage culture. In addition, the<br />
advantages observed in this and other studies concerning the productivity of raceways means that food<br />
conversion, labour costs and stock losses can all be reduced through the use of floating raceways<br />
instead of net cages.<br />
When proposing to develop aquaculture in cotton storages it is recommended that the ability to<br />
maintain water quality be considered with respect to the placement and operation of the aquaculture<br />
40
facility. Regardless of the type of production systems being employed the success of the aquaculture<br />
operation will depend upon appropriate planning and management of the farms integration to avoid<br />
issues of poor water quality, lack of water, overstocking, poor growth or survival.<br />
41
5. Pesticide Monitoring and Residues<br />
5.1 Background<br />
The presence of large well serviced water infrastructure on irrigated farms makes integrated<br />
aquaculture a potentially significant diversification activity. However, the development of the cotton,<br />
grains and sugarcane industries has relied on the use of a variety of pesticides, herbicides and<br />
defoliants applied either aerially, by ground spray rigs or directly to the soils themselves. A recent<br />
study by Muller et al, 2000, demonstrated that pesticide contamination was widespread in irrigation<br />
areas in Queensland. Many agricultural chemicals will accumulate rapidly through the food chain,<br />
especially in aquatic environments.<br />
Farms that use, or have used these chemicals in the past are at risk of producing product contaminated<br />
through at levels that pose food safety and market access issues. Unlike many other food products, the<br />
maximum residue limit (MRL) for many environmentally persistent compounds, have not been set for<br />
fish. The MRL is the maximum permissible residue limit for agricultural or veterinary chemicals that<br />
are listed for use on a particular product. For products where the MRL has not been set an extraneous<br />
residue limit (ERL) applies. The ERLs are for compounds that originate from environmental sources<br />
of contamination rather than from application of these agents directly or indirectly to the crop. The<br />
ERL for pesticides in fish are set at the reliable limit of quantification (Table 5.1.1.).<br />
Table 5.1.1 Extraneous Residue Limits (ERL) for agricultural chemicals in whole fish (minus<br />
gut) according to Food Standards Australia New Zealand, Australia New Zealand Food<br />
Standards Code (FSANZ, 2006)<br />
Chemical ERL (mg/kg)<br />
Aldrin & Dieldrin 0.1<br />
BHC 0.1<br />
Chlordane 0.05<br />
DDT 1<br />
HCB 0.1<br />
Heptachlor 0.05<br />
Lindane 1<br />
Fish are highly susceptible to the effects of pesticide contamination (Table 5.2.1). The 96 hr LC50 for<br />
endosulpfan exposure for native fish has been reported to lie between 0.2 μg/l for bony bream<br />
(Nematolsa erebi) to 2.4 μg/l silver perch (Bidyanus bidyanus) (Sunderam et al, 1992). During storm<br />
events endosulfan levels as high as 1.3 μg/l have been recorded in cotton growing regions (Muschal<br />
and Cooper, 1998). In addition to the sometimes lethal consequences of pesticide contamination, sublethal<br />
exposures result in the rapid bio-accumulation and concentration of those chemicals and their<br />
breakdown products. Bio-concentration occurs when fish absorb the compound directly from the water<br />
only while bio-accumulation refers to the build up of residues through the food chain (trophic transfer)<br />
and from the water (Macek et.al., 1979). Bio-magnification occurs when the level of residue increases<br />
through the food chain within two-trophic levels (Macek et.al., 1979).<br />
Different species of fish have been observed to have different patterns of residue build-up as a result of<br />
their feeding behaviour (trophic level). In the case of many now banned but persistant organochlorine<br />
(OC) compounds (aldrin, DDT, lindane, heptachlor etc), residues build up to levels often many<br />
thousand times higher than those observed in sediments and other biota. They can remain in the<br />
animal’s fat deposits for many years, if not its life. The build up of such residues can pose significant<br />
dangers to other wildlife (particularly birds) and also humans (most notably pregnant women). On the<br />
other hand, other less persistent compounds such as the organophosphate (OPs) and synthetic<br />
pyrethroids (SPs) do not generally bio-concentrate or accumulate, but if they do, they can be readily<br />
42
oken down and their metabolites and rapidly cleared. The rate of this clearance is dependent on<br />
temperature, feeding behaviour and solubility of the contaminating chemical (fat or water soluble).<br />
The potential risk of contaminated aquaculture product reaching the market must be understood and<br />
managed for the development of aquaculture in cotton catchments to proceed. While the exposure of<br />
native fish to environmental contaminants such as agricultural chemicals has been documented<br />
(Hunter, 1992 and Connell, Miller and Anderson, 2002), the study of bio-concentration and rate of<br />
depuration of OCs, OPs and SP compounds in farmed Australian native fish has not been reported.<br />
The objective of this study was to collect and analyse the edible portion of farm raised silver perch<br />
(B. bidyanus) to determine if residues from pesticides used on farm could be detected. The primary<br />
agents of concern were endosulfan and chlorpyrifos. Endosulfan is the only OC insecticide still<br />
permitted for use on crops in Australia. It has a reported half life of 50 days in soil and can be<br />
metabolised to form endosulfan sulphate, diol, ether, hydroxyether and lactone assuming exposure is<br />
below lethal levels (EXTOXNETa and IPCS INCHEM). In fish the lethal concentration can be as low<br />
as 1.2 ug/L (EXTOXNETa).<br />
Other OC compounds that were previously used in agriculture before being banned include DDT,<br />
dieldrin, endrin, chlordane, heptachlor and aldrin. These agents have relatively long half lives, are<br />
stable in soils and are relatively stable in sunlight. DDT was the most widely used OC which, while<br />
economical, was banned because of its long half life in the environment and the detrimental effect is<br />
accumulation had on wildlife and potentially human health (Ware, 1986). Chlorpyrifos is an OP which<br />
is still widely used in agriculture. The use of chlorpyrifos in the Australian cotton industry is<br />
decreasing. The use of chlorpyrifos has been reduced through the better management of pests through<br />
integrated pest management practices and the use of genetically selected, pest resistant cotton strains<br />
such as Ingard and Bolgard. The sensitivity and effect of fish species to chlorpyrifos varies with<br />
different tolerances displayed by different species (Racke, 1993).<br />
Bioaccumulation studies have been performed in a number of fish species but none with silver perch.<br />
No information exists in regard to the actual rate of elimination from Australian native fish species for<br />
the agents to be studied. There is no information on the rate of elimination of breakdown products<br />
such as DDE (dichlanodiphenyl dichloroethylene) in native fish and no information on the elimination<br />
of βHCH (Beta hexachlorocyclohexane) in any fish species (USEPA, 2000). The only alternative to<br />
these studies is to use estimates of accumulation rates in non-native fish species, tested under different<br />
environmental conditions and protocols. While this information is valuable in providing some<br />
background for developing a model of pesticide bioaccumulation, it cannot be relied upon to<br />
determine the actual risk or absolute rate of bio-concentration of these products under culture<br />
conditions. In addition the rate of elimination and the effectiveness of purging practices may also be<br />
also highly dependent on culture conditions and diligence of the operator.<br />
The results of this study will however further the understanding of the risks associated with integrating<br />
aquaculture with cotton farming activities in Australia.<br />
5.2 Materials and Methods<br />
5.2.1 Pesticide Monitoring<br />
To assess the effectiveness of management practices introduced to prevent contamination of cultured<br />
fish, in situ monitoring of the aquaculture ring tank and its water supply were conducted. As part of<br />
this monitoring extensively (free range) and intensively (cage/pond) raised silver perch were assessed<br />
for pesticide residues on a monthly basis for a two year period. In addition, in vivo studies of pesticide<br />
uptake and clearance in farmed fish were conducted. The rate of pesticide elimination and the role of<br />
purging on clearance rates were investigated using silver perch. The agents used in these trials were<br />
selected on the basis of their environmental persistence.<br />
43
5.2.1.1 Pesticide Application and Use<br />
The list of chemical used on farm during the monitoring period and their active constituents are<br />
presented in Table 5.2.1. The monitoring period commenced in February 2001 and was completed in<br />
May 2003. The list of compounds tested for is provided in Table 5.2.2 and 5.2.3. Although many of<br />
these compounds are not presently used on cotton they may be persistent in the environment as a result<br />
of previous use or be present in water from the catchment and supplied to the ring tank during<br />
pumping.<br />
Table 5.2.1 List of agri-chemicals used at Loch Eaton from February 2001 to May 2003<br />
Agent<br />
Toxicity to fish<br />
Bio-accumulates / bioconcentrates<br />
in fish<br />
Reference<br />
amitraz Medium - High No PAN, 2006<br />
bifenthrin Very Highly No PAN, 2006<br />
chlorfenapyr Very Highly Yes (low) ACC, 1997<br />
chlorpyrifos High Yes PAN, 2006<br />
β-cyfluthrin Very Highly No PMEP, 2006<br />
cypermethrin Medium - High Yes PAN, 2006<br />
deltamethrin Medium - High Yes PAN, 2006<br />
diuron Low - Medium Yes PAN, 2006<br />
ethephon Not Acutely Toxic No PAN, 2006<br />
ethion Medium - High No PAN, 2006<br />
indoxacarb (25:75) Medium - High No USEPA, 2006<br />
mepiquat present as mepiquat chloride Not Acutely Toxic No PAN, 2006<br />
thidiazuron Slightly Toxic No PAN, 2006<br />
Table 5.2.2 List of organochlorine, organophosphate and pyrethroid compounds included in<br />
analytical testing of riverine and ring tank water samples<br />
Organochlorine Organophosphate Synthetic pyrethroid<br />
Aldrin Azinphos Ethyl Ametryne<br />
alpha-BHC Azinphos Methyl Atrazine<br />
alpha-Endosulfan Carbaryl Atrazine Desethyl<br />
beta-BHC Diazinon Atrazine Desisopropyl<br />
beta-Endosulfan Dichlorvos Pendimethalin<br />
Chlorpyrifos Dimethoate Prometryne<br />
Chlordane EPTC Propazine<br />
delta-BHC Fenamiphos Simazine<br />
Dieldrin<br />
Fenitrothion<br />
Endosulfan Sulphate<br />
Fenthion<br />
Endrin<br />
Malathion<br />
Heptachlor<br />
Methidathion<br />
Heptachlor epoxide<br />
Methyl Parathion<br />
Hexachlorobenzene (HCB)<br />
Omethoate<br />
Lindane (gamma-BHC)<br />
Parathion<br />
Methoxychlor<br />
Profenofos<br />
Metolaclor<br />
DDD<br />
DDE<br />
DDT<br />
Tri-allate<br />
Trifluralin<br />
44
Table 5.2.3 List of organochlorine, organophosphate and synthetic pyrethroid compounds<br />
included in analytical testing of fish samples<br />
Organochlorine Organophosphate Triazine & other<br />
Aldrin Bromophos ethyl alpha Cypermethrin<br />
alpha-BHC Carbophenothion beta-cyfluthrin<br />
alpha-Endosulfan Chlorfenvinphos Bifenthrin<br />
beta-BHC Chlorpyrifos Cyfluthrin<br />
beta-endosulfan Chlorpyrifos-ethyl Cyhalothrin<br />
Chlordane Chlorpyrifos-methyl Cypermethrin<br />
DDD Coumaphos Deltamethrin<br />
DDE Diazinon Fenvalerate<br />
DDT<br />
Dichlorvos<br />
Dieldrin<br />
Dimethoate<br />
Endosulfan sulphate<br />
Ethion<br />
Endrin<br />
Fenitrothion<br />
HCB<br />
Fenthion<br />
Heptachlor<br />
Frenchlorphos<br />
Heptachlor epoxide<br />
Malathion<br />
Lindane<br />
Methidathion<br />
Methoxychlor<br />
Oxychlordane<br />
Parathion<br />
Parathion-methyl<br />
Pirimiphos-methyl<br />
Profenofos<br />
5.2.1.2 Water<br />
Monthly water samples were collected from the ring tank and the adjacent river. These samples are<br />
collected and stored in acid washed 1 L glass Schott bottles fitted with a teflon lid. The samples were<br />
either forwarded immediately for analysis or frozen at -20°C to ensure volatilisation of sensitive<br />
compounds did not occur. In the event that pesticides were applied to adjacent crops by aerial<br />
application, a sample from both the river and the ring tank was obtained prior to application,<br />
immediately following application, and for several successive days in order to assess the risk<br />
associated with pesticide spray drift. All water samples were analysed by the Department of Primary<br />
Industries and Fisheries (DPI&F) Leslie Research Centre, Toowoomba or by Australian Government<br />
Analytical Laboratories (AGAL), Cannon Hill. The list of compounds tested for is provided in<br />
Table 5.2.2.<br />
5.2.1.3 Fish<br />
Monthly fish samples were collected in order to monitor the pesticide uptake by the aquaculture stock.<br />
A sample of six fish per month was collected from the largest and oldest available size class, and when<br />
available, free-range fish caught from the ring tank were also collected. All fish samples were frozen<br />
whole at -20°C until analysis. All fish samples were analysed as whole carcass, minus gut, and as<br />
edible portion (fillet) as per the analysis criteria established by the National Residue Survey (NRS)<br />
(DAFF, 2001). The list of compounds tested for is provided in Table 5.2.3.<br />
5.3 Pesticide Bio-concentration and Depuration<br />
5.3.1 Agents<br />
The OCs and OPs used in the trial were heptachlor, dieldrin, endosulphan sulphate, chlorpyrifos, p,p-<br />
DDE, o,p-DDE, metolachlor, lindane and β-BHC. Standards were obtained from the (DPI&F), Leslie<br />
Research Centre Toowoomba. All fish were exposed to a 1μg/L concentration of each of the agents.<br />
All standards were at least 97 per cent pure. A working solution was made-up to service the trial by<br />
dissolving agents in acetone to form a stock solution. The working solution was then added to each<br />
tank to create 1 μg/L concentration of each pesticide.<br />
5.3.2 Fish<br />
A total of 216 purged fish with an average weight of 450 g were purchased from Arthur Raptis and<br />
Sons (fish wholesalers), Brisbane. Fish were first held in two separate acclimation tanks for four days<br />
45
prior to the commencement of the trial as temperature was increased from the ambient temperature of<br />
22ºC to 25ºC and from ambient to 15ºC. No feed was provided throughout the trial. Three fish were<br />
exposed to agents for 24 hrs before the commencement of the trial to monitor survival and ensure<br />
exposure levels were not toxic.<br />
5.3.3 Treatments<br />
The first treatment was maintained at 25ºC to imitate summer conditions and the second treatment was<br />
held at 15ºC to imitate winter temperatures. An exposure time of 96 hours was used during the bioconcentration<br />
period and a dose of 1μg/L for both temperature treatments. The pesticide bioconcentration<br />
and depuration trial using silver perch, Bidyanus bidyanus, exposed each treatment to a<br />
1 μg/l dose of either heptachlor, dieldrin, endosulphan sulphate, chlorpyrifos, p,p-DDE, o,p-DDE,<br />
metolachlor, lindane and βBHC at 15 and 25ºC for a period of 96 hrs. This was followed by a<br />
depuration period of up to 28 days.<br />
5.3.4 Sampling and Analysis<br />
A control sample consisting of three fish was taken at time zero and analysed to ensure that no residue<br />
was pre-existing in fish before trial commencement. To monitor pesticide uptake, three fish were<br />
removed from each replicate at 12, 24, 48, 72, and 96-hour intervals from both treatments. To monitor<br />
pesticide clearance, fish were held for 28 days while samples were collected at time intervals of 1, 3, 5,<br />
7, 14, 28 days. Samples collected were pooled and comprised of three fish from each individual<br />
replicate. All fish sampled were humanely euthanased and immediately frozen. Analysis of sample<br />
fish was conducted by AGAL. Samples were supplied at regular intervals in batches of three whole<br />
fish/bag. The gut was removed by AGAL and the three fish were homogenised into one and tested for<br />
the nine individual pesticides. Results were returned in units of mg/kg for each pesticide.<br />
5.3.5 System and Husbandry<br />
Trials were conducted in triplicate with three 700 L tanks containing 24 fish each utilised for each<br />
treatment. Adsorption of the pesticide to foreign sources within tanks was minimised by using solid<br />
fibreglass tanks fitted with ceramic air stones. A 100 per cent water exchange was conducted daily<br />
with the stock solution re-added at the concentration required using the stock solution. The<br />
concentration of each agent in was analysed.<br />
All fish were exposed to the same conditions and culture environment. Under these conditions, the fish<br />
showed no clinical signs of injury or stress during the exposure period. Prior to commencement of<br />
depuration period, all tanks used during the bio-concentration period were removed, thoroughly<br />
washed and rinsed with acetone twice. The floor of the study area was washed down and scrubbed<br />
with powdered activated carbon. All equipment was washed or replaced including new air stones, nets<br />
and sampling equipment.<br />
Due to a suspected parasitic infection, some mortality occurred on day eight and day nine of the<br />
depuration period in 15ºC treatment. The salinity of all tanks was increased from 0ppt to 10 ppt in<br />
order to treat the infestation. This had a positive effect on fish behaviour and no more mortality was<br />
observed throughout the remainder of the trial.<br />
All wastewater from the trial was pumped to an outside tank and exposed to direct sunlight. This water<br />
was treated for 24 hrs with powdered activated carbon (PAC) at a rate of 100 mg/L. The water was<br />
then drained, the PAC collected in a fine mesh sieve and dispatched for commercial incineration.<br />
46
5.4 Results<br />
5.4.1 Pesticide Monitoring<br />
5.4.1.1 Water<br />
The most likely pathway for the contamination of cultured fish is via the water column. A total of 29<br />
fish samples were collected from February 2001 to May 2003. No OC or pyrethroid compounds were<br />
detected in the flesh of silver perch farmed in net cages or in raceways. Similarly these compounds<br />
were not detected in free ranging fish from the ring tank. According to records, no DDT or other now<br />
banned OC’s have ever been used on this farm. Since pyrethroids do not bio-accumulate in fish, it was<br />
expected that these compounds would remain below the limit of quantification.<br />
A total of 61 water samples from the ring tank and 15 from the adjacent river were collected and<br />
analysed. The compounds that were detected in order of decreasing occurrence in ring tank samples<br />
were atrazine, metolachlor , atrazine desethyl, prometryne, chlorpyrifos and atrazine desisopropyl<br />
(Table 5.4.1). By comparison, the compounds detected in river samples were (in order of decreasing<br />
occurrence) atrazine, metolachlor, simazine, prometryne, and atrazine desethyl (Table 5.4.2). The<br />
timing of these detections is illustrated in Figures 5.4.1 and 5.4.2.<br />
Chlorpyrifos was detected in ring tank water on the 02/02/02 at a level of 0.53μg/L. The concentration<br />
of this agent decreased over subsequent sampling events and was below the limit of detection 12 days<br />
later on the 14/02/02. Chlorpyrifos was not detected in river water samples collected at the same time.<br />
The detection of chlorpyrifos in ring tank water did not correspond with Loch Eaton’s spraying<br />
activities. A review of farm records and those of their neighbours indicates a spray event on an<br />
adjacent property was the likely source of chlorpyrifos contamination. No similar events were<br />
subsequently detected.<br />
Table 5.4.1 Ranges of agents detected in Ring tank water<br />
Detected Agent<br />
Range (µg/L)<br />
Atrazine 0.10 to 6.06<br />
Atrazine desethyl 0.12 to 0.70<br />
Chlorpyrifos 0.01 to 0.53<br />
Metolachlor 0.030 to 1.49<br />
Prometryne 0.02 to 0.30<br />
Atrazine desisopropyl 0.1 to 0.1<br />
Table 5.4.2 Ranges of agents detected in River water<br />
Detected Agent<br />
Range (µg/L)<br />
Atrazine 0.05 to 16.92<br />
Metolachlor 0.03 to 3.39<br />
Simazine 0.17 to 0.30<br />
Prometryne 0.03 to 0.38<br />
Atrazine desethyl 0.06 to 0.96<br />
5.4.1.2 Fish<br />
A single detection of chlorpyrifos was recorded in fish collected during the 2001-02 cotton season.<br />
Chlorpyrifos in free range and caged silver perch were 0.072 and 0.210 mg/kg respectively on the<br />
04/02/02. The level of chorpyrifos in ring tank water at this time was 0.53 μg/L. No mortalities were<br />
recorded in cultured or extensively stocked fish that were associated with the chlorpyrifos event. All<br />
subsequent fish samples had no detectable level of chlorpyrifos residue (free range, caged or raceway<br />
fish).<br />
47
5.4.2 Pesticide Bio-concentration and Depuration<br />
Uptake and clearance trials for OC and OP compounds in farmed silver perch demonstrated that<br />
standard purging practices can be used to clear OP compounds such as chlorpyrifos but not<br />
environmentally persistent OC compounds such as p,p-DDE, o,p-DDE, βBHC, lindane, heptachlor<br />
and dieldrin (Figs 5.4.3 and 5.4.4).<br />
The uptake of DDE was rapid at 25ºC climbing from 0.08mg/kg at 48hrs to 0.36mg/kg on third day of<br />
purging (Fig 5.4.4). The concentration of heptachlor also peaked after 3 days at 0.12mg/kg in the 25ºC<br />
treatment while βBHC, lindane and dieldrin levels reached their respective peaks of 0.15, 0.15 and<br />
0.27 mg/kg at the 96hrs exposure mark. In a similar pattern, DDE and heptachlor concentrations in the<br />
15ºC treatment were highest during the purging period reaching 0.28 and 0.12 mg/kg respectively<br />
(Fig 5.4.3). The concentrations of βBHC, lindane and dieldrin all peaked at a concentration of<br />
0.12mg/kg.<br />
The concentration of chlorpyrifos in the 25ºC treatment peaked at 0.09 mg/kg at 96 hrs exposure and<br />
fell to below the Limit of Quantitation (LOQ) by the 14th day of the elimination period. Chlorpyrifos<br />
levels in the 15ºC treatment reached the equivalent of their peak concentration of 0.08 mg/kg after<br />
96 hrs of exposure. The time taken to reach levels below the LOQ was 28 days in the 15ºC treatment.<br />
0.8<br />
7<br />
0.7<br />
6<br />
Other Pesticides (ug/L)<br />
0.6<br />
0.5<br />
0.4<br />
0.3<br />
0.2<br />
5<br />
4<br />
3<br />
2<br />
Atrazine & Metalochlor (ug/L)<br />
0.1<br />
1<br />
0<br />
0<br />
1/02/03<br />
1/01/03<br />
1/12/02<br />
1/11/02<br />
1/10/02<br />
1/09/02<br />
1/08/02<br />
1/07/02<br />
1/06/02<br />
1/05/02<br />
1/04/02<br />
1/03/02<br />
1/02/02<br />
1/01/02<br />
1/12/01<br />
1/11/01<br />
Chlorpyrifos Atrazine Desethyl Atrazine Desisopropyl Prometryne Metalochlor Atrazine<br />
Figure 5.4.1 Pesticide levels in ring tank water from November 2001 until March 2003<br />
48
Other Pesticides (ug/L)<br />
3.5<br />
3.25<br />
3<br />
2.75<br />
2.5<br />
2.25<br />
2<br />
1.75<br />
1.5<br />
1.25<br />
1<br />
0.75<br />
0.5<br />
0.25<br />
0<br />
17<br />
16<br />
15<br />
14<br />
13<br />
12<br />
11<br />
10<br />
9<br />
8<br />
7<br />
6<br />
5<br />
4<br />
3<br />
2<br />
1<br />
0<br />
Atrazine & Metalochlor (ug/L)<br />
1/02/03<br />
1/01/03<br />
1/12/02<br />
1/11/02<br />
1/10/02<br />
1/09/02<br />
1/08/02<br />
1/07/02<br />
1/06/02<br />
1/05/02<br />
1/04/02<br />
1/03/02<br />
1/02/02<br />
1/01/02<br />
1/12/01<br />
1/11/01<br />
Metalochlor Atrazine Desethyl Atrazine Desisopropyl Prometryne Simazine Atrazine<br />
Figure 5.4.2 Pesticide levels in river water from November 2001 until March 2003<br />
0.3<br />
0.25<br />
0.2<br />
ug/L<br />
0.15<br />
0.1<br />
0.05<br />
0<br />
0 1 2 3 4 5 6 7 8 9 10 11 12 13 14 15 16 17 18 19 20 21 22 23 24 25 26 27 28 29 30 31 32<br />
Days<br />
Metolachlor Chlorpyriphos DDE Dieldrin<br />
beta BHC gamma BHC (Lindane) Heptachlor Endosulfan sulphate<br />
Figure 5.4.3 Concentration of pesticides in muscle tissue of silver perch (Bidyanus bidyanus)<br />
maintained at 15ºC and exposed to 1 μg/L heptachlor, dieldrin, endosulfan sulphate,<br />
chlorpyrifos, p,p-DDE, o,p-DDE, metolachlor, lindane and β-BHC for 96hrs then transferred to<br />
clean water for a period of up to 28 days<br />
49
0.4<br />
0.35<br />
0.3<br />
0.25<br />
ug/L<br />
0.2<br />
0.15<br />
0.1<br />
0.05<br />
0<br />
0 1 2 3 4 5 6 7 8 9 10 11 12 13 14 15 16 17 18 19 20 21 22 23 24 25 26 27 28 29 30 31<br />
Days<br />
Metolachlor Chlorpyriphos DDE Dieldrin<br />
beta BHC gamma BHC (Lindane) Heptachlor Endosulfan sulphate<br />
Figure 5.4.4 Concentration of pesticides in muscle tissue of silver perch (Bidyanus bidyanus)<br />
maintained at 25ºC and exposed to 1 μg/L heptachlor, dieldrin, endosulfan sulphate,<br />
chlorpyrifos, p,p-DDE, o,p-DDE, metolachlor, lindane and β-BHC for 96hrs then transferred to<br />
clean water for a period of up to 28 days<br />
Concentrations of metolachlor and endosulfan sulphate were below the FSANZ ERL’s of 0.05 mg/kg<br />
(FSANZ, 2006). Studies on fish exposed to metolachlor indicate that very little is accumulated and<br />
that any accumulated material is excreted rapidly when fish are placed in clean water (USEPA, 1997).<br />
Endosulfan bio-accumulates in fish but will be eliminated over time if the animal is placed in noncontaminated<br />
waters. The failure to detect endosulfan in any form in this study indicates that the<br />
concentration used in this study were insufficient to result in bio-concentration of endosulfan to<br />
detectable levels in muscle tissues. Samples of the water from treatment tanks returned endosulfan<br />
levels of 1.4 and 1.1μg/L after 4 and 18 hrs after inoculation. Similarly, metolachlor levels were 1.2<br />
and 0.93 μg/L after 4 and 18 hrs post inoculation.<br />
5.5 Discussion<br />
Of the seven compounds that were found to be present in ring tank water (Metolachlor , simazine,<br />
atrazine, atrazine desethyl, atrazine desisopropyl, prometryne and simazine) only chlorpyrifos was<br />
applied on farm during the monitoring period. The detection of chlorpyrifos did not correspond with<br />
any spray event as a result of spraying activity conducted on Loch Eaton. It is likely that the single<br />
detection of chlopyrifos was associated with an activity conducted on a neighbouring property. Spray<br />
drifts can result from rapid shifts in wind direction and/or a surface temperature inversion. An<br />
inversion or change in wind direction could potentially permit drift of pesticides for up to 500 m from<br />
its point of application (Craig, Woods and Dorr, 1998). The other compounds observed in this study,<br />
primarily pyrethroid compounds, are most likely to have been introduced during water harvesting<br />
events from the adjacent Condamine River.<br />
Atrazine and its breakdown products atrazine desethyl and atrazine desisopropyl were detected in<br />
67 per cent and 95 per cent of the water samples from the river and the ring tank. Atrazine is a pre and<br />
post-emergent herbicide that is widely used for the control of some annual grasses and broadleaf<br />
weeds. It is not used in irrigated agriculture and is present as the result of run-off from other more<br />
diffuse land uses (Muschal and Cooper, 1998). Since water is pumped directly from the river at Loch<br />
Eaton, atrazine is introduced into the ring tank during these pumping events that often accompany<br />
50
flood events. The high levels of atrazine in river water samples compared to ring tank samples,<br />
demonstrates this pattern of movement.<br />
Atrazine degrades more rapidly under anaerobic compared to aerobic soil conditions (Goswami and<br />
Green 1971). In the aqueous phase, the products of atrazine biotransformation are reported to peak<br />
after 25 days and then decline (Seybold et.al., 2001). The concentrations of these products, atrazine<br />
desethyl and atrazine desisopropyl, peaked after the pumping events as did the atrazine levels<br />
themselves. Atrazine levels declined between events and it is likely that this decline contributed to<br />
ongoing detection of atrazine desethyl and atrazine desisopropyl. These products bind strongly with<br />
soil (Seybold and Mersie 1996) and it is likely that this binding with soil, rather than any continued<br />
breakdown, accounts for a large proportion of the observed decreases in these metabolites over time.<br />
While atrazine does not bio-accumulate in fish it can have physiological consequences including<br />
effects on haematocrit, other serum components, the liver, osmoregulation and respiration (Prasad<br />
et.al., 1991; Egaas et.al., 1993; Hussein et.al., 1996). Fish exposed to 3 and 6 mg/L of atrazine display<br />
clinical signs of stress including increased respiration rates, slow down of reflexes, erratic swimming<br />
and reduced feed intake (Hussein et. a., 1996). The atrazine LC50 value for fish has been reported to be<br />
between 3 and 18.8 mg/L and varies according to species and environmental conditions (Pluta 1989;<br />
Neskovic et al, 1993; Hussein et.al., 1996). In this study, the highest concentration of atrazine<br />
observed in ring tank water was 6.06 μg/L. This is lower than levels reported to cause mortality in fish<br />
but levels as low as 10 μg/L have been reported as causing amplitude changes (increases in respiration<br />
which is a sign of stress) and fatty liver degeneration in rainbow trout (Barnhart, 1969; Huessein et.al.,<br />
1996). No information exists concerning the sensitivity of silver perch and other native fish such as<br />
Murray cod to atrazine. This study did not have capacity to identify if atrazine levels in ring tank water<br />
had any deleterious effect on fish behaviour or growth. It is recommended that further studies be<br />
conducted using native fish to determine if sub-lethal exposures, such as those observed in this study,<br />
result in any clinical signs of stress or physiological degeneration that can impact fish behaviour<br />
and/or growth.<br />
Metolaclor was also detected in ring tank samples after pumping events but at lower levels than were<br />
observed in the river. Under aerobic conditions in the laboratory the half life of metalochlor is<br />
210 days. In anerobic wetland soils the half life for metolachlor is reported to be 62 days (Seybold and<br />
Mersie 1996). This compares to 38 days for atrazine under the same conditions. Metalochlor levels in<br />
the ring tank fell between pumping events and was not detected after August 2002. The bioconcentration<br />
of metalochlor in fish is considered not to be important as the compound is rapidly<br />
depurated by fish held in clean water (USEPA, 1997). No metalochlor was detected in fish samples<br />
collected at the same time as the detection of this agent in ring tank water. Prometryne was also not<br />
detected in any fish samples collected from the ring tank but it was detected in 48 per cent of ring tank<br />
and 27 per cent riverine water samples during the monitoring period.<br />
Simazine was detected in ring tank water but not in riverine samples at that time. Simazine does not<br />
bio-accumulate in fish (Kidd and James, 1991). The LC50 dose for simazine for rainbow trout is<br />
reported as being 100 mg/L which is about 6,000 times higher than the levels observed in this study<br />
(EXTOXNETb). Simazine is used to control many broadleaf weeds and annual grassess and like<br />
atrazine can remain in the aquatic environment for an extended period. The levels and incidence of<br />
simazine detection would not appear to pose any threat to aquaculture. Other SP compounds that were<br />
used on-farm but not tested for during the monitoring activities include cypermethrin and indoxacarb.<br />
Cypermethrin is highly toxic to fish, has a half life in soil of 30 days, but is extremely lipophilic and is<br />
immobile in soils and is rapidly metabolised by animals (NPTN, 1998; EXTOXNETc). The LC50 for<br />
cypermethrin is cypermethrin in rainbow trout is 0.0082 mg/L (EXTOXNETc). Indoxacarb is<br />
considered moderately to highly toxic to fish on an acute basis with LC50 values of between 24 and<br />
1300 μg/L. Indoxacarb, it’s isomers and associated degradates are moderately to very highly toxic to<br />
freshwater and marine fish on an acute basis with LC50s ranging from 0.024 to >1.3 mg/L (Moncada,<br />
2003).<br />
51
There were no detections of endosulfan in water samples from the river, ring tank or fish collected<br />
during this monitoring exercise. Endosulfan has not been found to bio-accumulate in fish populations<br />
between cotton growing seasons but any detection in aquaculture product (>0.05mg/kg) would be a<br />
violation of the FSANZ guidelines. Studies show that pond LC50 values for silver perch (3.2 and<br />
4.4 μg/L (Patra et.al., 1995a; Patra et.al., 1995b) are similar to laboratory LC50 values of 2.4 μg/L<br />
(Sunderam et.al., 1992). The lack of detection of endosulfan in this study is encouraging and is<br />
indicative of a reduction in the use of this chemical and others by the cotton industry in recent years.<br />
Endosulfan use peaked on an industry level in the 1998/99 season but in the 2003/04 season its use<br />
had fallen by significantly (Bruce Pyke, pers. Comm..). The decline in the concentration of endosulfan<br />
in cotton gin trash collected from the 1998/99 and 2003/04 seasons, illustrate the dramatic reduction in<br />
endosulfan use on farms growing Bolgard cotton. No endosulfan sprays were used on Loch Eaton<br />
during this monitoring period. Other factors that account for the reduction in pesticide use in the<br />
cotton industry include the widespread adoption and success of the industries Best Management<br />
Practices (BMPs) and Integrated Pest Management (IPM) practices. The reduction in endosulfan use<br />
across the industry represents a reduced risk of both on and off farm environmental contamination.<br />
This is important for the future development of aquaculture in cotton catchments.<br />
Chlorpyrifos was detected in ring tank water samples from the 02 of February to 14th of February<br />
2002. This event corresponded with the detection of chlorpyrifos in unpurged fish taken from both<br />
intensively reared stock (raceways) and free range fish. Chlorpyrifos is highly toxic to fish and also<br />
has the capacity to bio-accumulate and concentrate in fish (Varo et.al., 2000). LC 50 values for<br />
freshwater are typically below 100 μg/L, with bluegill sunfish sensitive at around 2 μg/L<br />
(NRA, 2000). Bio-concentration factors (BCF) for chlorpyrifos in fish are reported between 58 and<br />
5100 (Racke, 1993). However, despite its capacity to bioconcentrate, this compound can be rapidly<br />
depurated by fish if they are placed in clean water (Racke, 1993). This is typically the practice used by<br />
growers when purging stock prior to marketing. By placing fish in clean water growers are aiming to<br />
remove any off flavour taints that may be present. The monitoring of market ready Loch Eaton fish<br />
conducted in this study, that is the monitoring of fish that had been purged for up to 14 days, had no<br />
detectable level of chlorpyrifos or any other chemical residue.<br />
The capacity of fish to uptake and then clear chlopyrifos was demonstrated in the bio-concentration<br />
and depuration study. The concentration of chlorpyrifos at 25ºC reached 90 μg/kg by the 96th hour of<br />
exposure but was not present at detectable levels (
St George, Emerald and Dawson cotton growing regions (Muller, et.al.; 2000). Of the 103 sediment<br />
samples tested in that study, DDT products were detected in 74 samples (Muller, et.al.; 2000). The<br />
highest concentration was recorded in the Dawson River region with 240 ng/g dry weight of DDT<br />
detected. As stated previously, agents like DDT (DDD, DDE) are rapidly bio-magnified through the<br />
food chain and fish can bio-accumulate these compounds to relatively high levels as a result. As a<br />
consequence of their persistence in the aquatic environment, DDT, DDD and DDE have been reported<br />
in wild fish populations in Queensland even after their use had been banned (Roach and Runcie,<br />
1998). The half lives these compounds are between 3 and 15 years. The use of chlorohydrocarbon<br />
pesticides such as DDT was progressively banned from the 1970s with DDT being banned completely<br />
in Australia in 1987 (Connell, et.al., 2002). No sediment samples were analysed in this study.<br />
However, no DDT, DDD or DDE was detected in water or fish samples from the ring tank. The bioconcentration<br />
and depuration study demonstrated that if the likes of DDE was absorbed by silver perch<br />
it would not be eliminated during normal purging practices. This is to be expected as although DDT<br />
bio-transforms rapidly in fish (days) to form mainly DDE (Suedel et.al., 1994), this compound has a<br />
long half life in fish. The bio-concentration of compounds like DDE increases as the fat content of the<br />
species increases (Das et.al., 2002). As a comparison, the half life in the fat of beef cattle is 6-12<br />
weeks (AQIS, 1998).<br />
The bio-concentration study also demonstrated that other persistent OC compounds (heptachlor,<br />
lindane, βBHC and dieldrin) accumulate rapidly in silver perch to levels in excess of their ERLs.<br />
Heptachlor is highly toxic to fish with 96hr LC50 values of between 5.3 and 23 μg /L for freshwater<br />
and marine fish (EXTOXNETd). It has been found in fish at concentrations up to 37,000 times the<br />
level found in surrounding waters (WHO, 1984.). In this study heptachlor levels reached 120 times<br />
those in the water after 96 hrs of exposure. Similar rates of bio-concentration were observed in<br />
lindane, βBHC and dieldrin all of which were not eliminated during the depuration period. These<br />
levels are all above the ERLs set by FSANZ for these compounds in fish.<br />
The information from this study supports other published data concerning the bio-concentration and<br />
elimination of OC compounds in fish. Once contaminated, it is unlikely that the stock will be rendered<br />
suitable for sale.<br />
Despite the favourable results observed in this study and the declining volume of use of pesticides by<br />
the industry, the major risk to aquaculture development on cotton farms remains that of pesticide<br />
contamination. This risk would be highest in ring tanks that are not favourably located and where<br />
pesticide concentrates in run-off from fields. Ring tanks that are located in the middle of farms are at<br />
an increased risk of encountering spray drift issues than ring tanks that back onto riverine areas,<br />
undeveloped farmland or housing. Many farms have constructed ring tanks that collect from many<br />
sources including rivers, creeks, groundwater and also from their farms irrigation tailwater and surface<br />
water run-off. Using these ring tanks for aquaculture without modifying its water harvesting<br />
infrastructure to exclude run-off and tailwater would create risks of fish kills and/or contamination.<br />
Awareness of previous land and chemical use practices is clearly important as is the adoption of new<br />
farm management strategies that are considerate of the fish farming operation. It should be noted that<br />
the absence detectable levels of persistent OC compounds in either soil or water might not necessarily<br />
indicate a “clean” site. As demonstrated in this study and others, some compounds can bio-accumulate<br />
in fish to levels well in excess of environmental concentrations.<br />
New guidelines for the assessment of sites for aquaculture have been published by DPI&F in the guide<br />
‘Site identification for aquaculture- assessment of chemical contamination in site selection’ (DPI&F,<br />
2005).<br />
Issues related to pesticide residues in farm produce are likely to become more apparent as<br />
community/consumer awareness surrounding food safety increases. Only regular, whole of industry<br />
based testing of aquaculture products will address consumer concerns over their safety. The only<br />
products that are routinely tested for chemical residues at present are those destined for export<br />
markets. Tuna (Thunnus maccoyii) and salmon (Salmo salar) are the only fish species that are<br />
incorporated in the National Residue Survey (NRS) of residues in aquaculture products at present.<br />
53
While further expansion of the integrated aquaculture sector is likely, this sector must continue to<br />
assess the risks posed by pesticide use and implement quality assurance programs to ensure its product<br />
is recognised as not only environmentally sensitive but is safe and of a high quality.<br />
54
6. Integrated Production Decision Tool<br />
6.1 Description<br />
A spreadsheet based decision tool (Fig 6.1.1) was developed during this study to enable potential<br />
proponents to determine the benefit and cost of diversifying their existing operations. The decision<br />
tool is an excel based package that enables proponents to estimate the capital investment, on-going<br />
operating costs, the risks and their impacts (such as the crop failure and disease), the influence on<br />
water quality, and fluctuation in market prices. It can aid existing farmers to develop their own<br />
production model and estimate the impact of investment and operational decisions on their operations<br />
profitability. Farmers can observe the impact of price changes on profitability for inputs such as feed,<br />
fingerlings, electricity, packaging and transport. It can also be used to evaluate improvements in<br />
genetics and other methods of stock improvement, evaluate the benefits and risks of a farms<br />
expansion, change in production style, or even the viability of value adding. For further information<br />
regarding this product please ring the DPI&F Call Centre on 13 25 23 or contact the author at<br />
bill.johnston@dpi.qld.gov.au<br />
31/05/2007 35<br />
Agency for Food and Fibre Sciences<br />
Figure 6.1.1 Example of spreadsheet based decision tool<br />
55
7. General Discussion<br />
The integration of aquaculture with cotton production using irrigation storages is a challenging one.<br />
The outcomes of this study demonstrate both the importance of choosing the right production system,<br />
placing it in the most appropriate location and managing it correctly. The location of the storage is<br />
common to any cage or raceway system as it impacts on the quality of water available for aquaculture<br />
and the potential for introduction of pesticides. Another factor governing the success of any<br />
aquaculture operation is the management of an integrated farm, the associated identification of training<br />
needs and skills development of new and existing staff. Integrated operations with shared farm labour<br />
will require additional investment in aquaculture training. Despite the challenges faced in this study,<br />
the potential for development of integrated farming in Queensland’s irrigation industry is high. The<br />
infrastructure and water resources that have been established by the irrigation sector are significant<br />
and constitute a major avenue for the growth of aquaculture in the state.<br />
In this study, the primary factor preventing the successful development of the aquaculture enterprise<br />
was the inability to adequately manage water quality. The general quality of water within the<br />
aquaculture ring tank was severely degraded by opportunistic riverine water harvesting events. The<br />
reduction in dissolved oxygen levels and increase in turbidity not only resulted in stock mortalities in<br />
the short term but also suppressed feeding responses and growth for extended periods. In light of this<br />
experience, it is recommended that future proponents of integrated aquaculture in cotton catchments<br />
protect themselves from similar water quality complications as the result of flood harvesting. On the<br />
Loch Eaton site this might be achieved by relocating the raceway structure to the adjacent ring tank.<br />
The site used in this study was selected because it had the most reliable water supply, did not receive<br />
tailwater and also had an adjacent bore water supply. However, the adjacent rink tank was built after<br />
this trial was established. It is similar in dimension to the existing aquaculture storage (4 ha), is<br />
designed to fill by overflow from the primary receiving storage and is drained through a gate valve<br />
located at the base of the storage. The use of this storage would enable aquaculture operations to be<br />
buffered from the impacts of water harvesting. It would also allow controlled application of<br />
flocculants to incoming water to further reduced the impact of high turbidity levels on dissolved<br />
oxygen concentrations within the aquaculture storage.<br />
While the impacts of water harvesting on water quality were significant, the use of floating raceways<br />
had benefit with respect to maintaining high densities of fish in a secure and serviceable structure. The<br />
raceway systems provided some protection against low oxygen levels and maintained high densities of<br />
fish. These high densities were possible because of the high rates of water exchange which was<br />
achieved using a low head airlift system with flow rates of up to 180 L/min/uplift. The food<br />
conversion ratio and growth data collected in this study indicate that while water quality did impact on<br />
fish growth there were clear instances where feeding practices impacted the performance on the<br />
system. Unlike species like barramundi (Lates calcarifer), silver perch do not typically feed at the<br />
surface. In this study the lack of feeding response may have impacted on the daily feeding regime. If<br />
the floating raceway system is to be used for silver perch production in the future, a means of more<br />
accurately determining when fish become satiated is required. Also, while high densities of fish can be<br />
maintained, the raceways must be maintained in a clean state and the fish must be monitored regularly<br />
to identify and manage any disease outbreaks.<br />
Despite problems experienced with water quality and fish growth in this study the major risk to<br />
aquaculture development on cotton farms is pesticide contamination. The risk is highest for ring tanks<br />
that are not favourably located exposing the fish to contaminated water or spray drift. The application<br />
of farm chemicals was managed favourably in this study. However, the potential for future<br />
contamination events remains, the proponents of integrated production in cotton catchments will<br />
benefit from the industries ongoing reduction in chemical use if it is maintained in the future.<br />
Therefore, while this study highlighted a number of practical issues associated with integrating<br />
aquaculture into a working cotton farm, it did demonstrate the potential of this approach for future<br />
integrated developments.<br />
56
The finding of this study can be summarized as:<br />
• Water quality was generally favourable for aquaculture although flood pumping events can result<br />
in detrimental increases in turbidity which lower dissolved oxygen levels.<br />
• The use of chemical agents such as chlorpyrifos by the cotton industry can be managed to prevent<br />
residue accumulation in fish farmed on cotton farms.<br />
• A variety of culture techniques can be used to intensively rear fish on cotton farms although<br />
systems like floating raceways (as used in this study) will require less water to maintain than cages<br />
or ponds.<br />
• Floating raceways (as used in this study) can maintain high densities of fish in a secure and<br />
serviceable environment.<br />
• Silver perch may not be as suited to intensive culture in floating raceways as species like Murray<br />
cod.<br />
It is recommended that irrigators seeking to introduce aquaculture into their existing farming<br />
enterprises investigate:<br />
• The impact of retaining up to 3m of water within the aquaculture storage on the farms irrigated<br />
crops.<br />
• The risk associated with servicing a new and highly technical farming enterprise.<br />
• The cost of additional training requirements for new and existing staff.<br />
• The minimum size that the aquaculture enterprise must achieve compared to the capacity that<br />
exists within their farm infrastructure.<br />
• The species that is optimal for their proposed system (extensive, semi-intensive of intensive).<br />
• The ability of the farm to maintain water supplies indefinitely.<br />
It is clear from this study that while the aquaculture potential of these regions and infrastructure is<br />
high, there are existing issues concerning the methods and timing of water harvesting, the species<br />
used, the method of farming and the associated demands on the farm operators. The level of intensity<br />
and scale of production must be well matched to the skill of the proponent and the available<br />
infrastructure. Considered placement of the aquaculture operation will determine the success of the<br />
operation and its ability to expand. In conclusion, the irrigation industry is well placed to invest in the<br />
production of additional crops from their available water resources and infrastructure, the cotton<br />
industry is particularly well placed because of its commitment to environmental management and<br />
sustainability.<br />
57
Appendix<br />
Floating Raceway Technology<br />
and its application in the<br />
Barramundi Industry<br />
Dr Adrian Collins<br />
Bribie Island Aquaculture Research Centre<br />
DEPARTMENT OF PRIMARY INDUSTRIES<br />
What is a Floating Raceway?<br />
• Floating raceways are in<br />
pond versions of traditional<br />
land based raceways.<br />
• Roto-moulded product.<br />
• Produced in Queensland by<br />
Bushman’s s tanks – Modular<br />
Plastic Raceways (MPR(<br />
MPR’s).<br />
58
2 medium raceways<br />
– 18m 3 volume<br />
2 small raceways<br />
–13m 3 volume<br />
Access pontoons<br />
Sugarland Barramundi P/L<br />
MPR Characteristics<br />
Double skinned plastic hull<br />
Sectional – uplift section<br />
– chamber sections<br />
Stainless steel gate frames<br />
Bank of air uplifts<br />
Serviced by land based<br />
blower and backup<br />
infrastructure<br />
59
Why Raceways?<br />
McVeigh Brothers P/L – Dalby Qld.<br />
Integration of aquaculture with irrigated crop<br />
farming as a first use of available water.<br />
Utilising their irrigation reservoir for fish<br />
culture – 5000ML of farm water storage.<br />
Started with net cages for production of Native<br />
Fish - Small cages – 2 m 3<br />
- Large cages – 40 m 3<br />
60
Problems with cages<br />
McVeigh Brothers P/L – Dalby Qld.<br />
Predators – birds, rats and turtles damaging<br />
cages, resulting in mortality/stock loss.<br />
Fouling – Algal growth on cages required<br />
frequent net cages.<br />
Disease – Winter diseases required frequent<br />
salt/formalin treatment.<br />
Durability – Net cage material and cage collars.<br />
61
Alternative but Adaptable System<br />
McVeigh Brothers P/L – Dalby Qld.<br />
Liked the security and productivity of intensive<br />
systems – raceways.<br />
Investigated the concept of floating raceways<br />
in their reservoir.<br />
Collaborated with Bushmans Tanks P/L to<br />
develop Plastic Floating raceways.<br />
62
End Screen<br />
Baffle Board<br />
Uplifts<br />
Water Flow (no eddy)<br />
25<br />
20<br />
15<br />
Flow (cm/sec)<br />
10<br />
5<br />
0<br />
-5<br />
-10<br />
110<br />
100<br />
80<br />
Depth (cm)<br />
60<br />
40<br />
20<br />
1<br />
210<br />
360<br />
510<br />
60<br />
660<br />
Distance (cm)<br />
64
Water Flow (eddy)<br />
Flow (cm/sec)<br />
35<br />
30<br />
25<br />
20<br />
15<br />
10<br />
5<br />
0<br />
-5<br />
-10<br />
-15<br />
110<br />
100<br />
80<br />
Depth (cm)<br />
60<br />
40<br />
20<br />
1<br />
160<br />
60<br />
260<br />
360<br />
460<br />
560<br />
660<br />
Distance (cm)<br />
65
External screen<br />
Air supply chamber<br />
External screen<br />
Internal screen<br />
66
End gates - changeable<br />
67
Barramundi Trials<br />
• Sugarland Barramundi P/L<br />
Four MPR’s to be stocked with varying<br />
densities and size classes of fish.<br />
The MPR results to be compared to cage<br />
controls.<br />
Performance of fish (growth, FCR, survival,<br />
disease).<br />
Productivity comparison (labour to yield) and<br />
cost benefit analysis.<br />
Barramundi Trials – MPR’s<br />
• Sugarland Barramundi P/L<br />
2 small raceways - Stock on 24/5 with 35g fish<br />
- 3200 fish each<br />
- Density = 8kg/m 3<br />
Target SR’s – 200g average at a density of 50kg/m3<br />
2 medium raceways - Stocked on 18/6 with 120g fish<br />
- 2300 fish each<br />
- Density = 16kg/m 3<br />
Target MR’s – 600g average at a density of 80kg/m3<br />
68
35 g average fish – 3200 each<br />
120 g average fish – 2300 each<br />
Barramundi Trials – Cages<br />
• Sugarland Barramundi P/L<br />
2 Net Cages - Stock on 24/5 with 35g fish<br />
(control for 2 small raceways)<br />
- 800 fish each<br />
- Density = 4kg/m 3<br />
Target SR’s – 200g average at a density of 25kg/m3<br />
2 Net Cages - Stocked 18/6 with 120g fish<br />
(control for 2 medium raceways)<br />
- 480 fish each<br />
- Density = 8kg/m 3<br />
Target MR’s – 600g average at a density of 40kg/m3<br />
69
System Cages MPR’s<br />
Stocking<br />
Capacity<br />
Densities for fingerlings – 50 kg m -3<br />
Densities in small net cages may reach 50 kg<br />
net cages typically operate at 10 kg m kg m -3 100 kg m -3<br />
m -3 for market sized fish while larger circular Densities for plate sized fish up to<br />
Grading<br />
Feeding<br />
Fish Health<br />
Security<br />
Operation<br />
Durability<br />
Cost Benefit<br />
Fish have to be hand graded or pumped to a<br />
grading machine.<br />
Feed waste through wind, wave action and<br />
loss through floor.<br />
Fish must be removed from nets or nets<br />
bagged requiring high labour input and stress<br />
to fish.<br />
Predators/vermin can damage cages or fish<br />
directly and result in stock mortalities or<br />
escape<br />
High density cages still require paddle wheels<br />
to aerate and move water.<br />
Cages must be regularly cleaned, repaired<br />
and replaced.<br />
Relatively cheap to set up but limiting in<br />
productivity with relatively high ongoing<br />
operational and labour costs.<br />
Fish can be graded within the<br />
raceway using a ‘push grader’ or<br />
‘slide gate’.<br />
Feed can be accurately delivered<br />
with uneaten feed easily observed..<br />
As with tanks fish can be treated and<br />
observed without removing or unduly<br />
stressing them.<br />
Predator and vermin proof.<br />
The blower serves to operate the<br />
airlifts which moves water more<br />
efficiently than paddlewheels.<br />
MPR are made from materials with a<br />
20yr life.<br />
Capital requirement but potentially<br />
improved profitability.<br />
Potential Uses of MPR’s<br />
Nursery System<br />
Can MPR’s hold larger numbers of fingerlings<br />
and juveniles rather than in tanks/cages?<br />
Growout System<br />
Can Barramundi be grown in MPR’s at density<br />
to plate size?<br />
What are the cost benefits and industry implications?<br />
70
Paul McVeigh<br />
Mark Fantin<br />
Doug Young<br />
71
References<br />
American Cyanamid Company (ACC). 1997. An Aquatic Organism Ecological Risk Assessment for<br />
Chlorfenapyr in Cotton. http://www.epa.gov/opprd001/chlorfenapyr/toc.htm<br />
American Public Health Association (APHA). 1995. Standard methods for the examination of water<br />
and wastewater. American Public Health Association, American Water Works Association, and Water<br />
Pollution Control Federation. 19th edition, Washington, D.C.<br />
Australian Bureau of Statistics (ABS). 2006. http://www.abs.gov.au/<br />
Australian Government Bureau of Meteorology (AGBOM). 2006. http://www.bom.gov.au/<br />
Australian Quarantine and Inspection Service (AQIS). 1998. Program Principles and Guidelines,<br />
National Organochlorine Residue Management Program, 2nd Edition.<br />
Barchesi M. of Kilcoy Fishery Company Pty. Ltd. 2005. Personal communication.<br />
Barlow, C.G and Bock, K. 1981. Fish for Farm Dams. NSW Fisheries, Sydney.<br />
Barnhart, R.A. 1969. Effects of certain variables on hematological characteristics of rainbow trout.<br />
Transactions of the American Fisheries Society. 98:411-418.<br />
Bell, S. of Head Over Eels Pty. Ltd. 2006. Personal communication.<br />
Boyd, C.E. 1990. Water Quality in Ponds for Aquaculture. Alabama Agricultural Experiment<br />
Station, Auburn University, Alabama.<br />
Condamine-Balonne Water Committee. (CBWC). 2002. Water Quality Objectives for the<br />
Condamine-Balonne Catchment. Development of Local Water Quality Objectives for the Condamine-<br />
Balonne Catchment Project- Technical Report. Condamine-Balonne Water Committee Inc., Dalby,<br />
Queensland.<br />
Connell, D.W., Miller, G. and Anderson, S. 2002. Chlorohydrocarbon pesticides in the Australian<br />
marine environment after banning in the period from the 1970s to 1980s. Marine Pollution Bulletin<br />
45, pages 78-83.<br />
Constable, G.A., Llewellyn, D.J. and Reid, P.E. 1998. Biotechnology risks and benefits: the Ingard<br />
cotton example. Proceedings of the Australian Agronomy Conference, Australian Society of<br />
Agronomy.<br />
Cotton Australia. http://www.cottonaustralia.com.au/<br />
Cotton Research and Development Corporation (CRDC). 2005. Annual Report 2004–05.<br />
www.crdc.com.au<br />
Craig, I. Woods N. and Dorr, G. 1998. A simple guide to predicting aircraft spray drift. Crop<br />
Protection vol. 17 No.6. pp. 415-482.<br />
Dalton, P., Raine, S. and Broadfoot, K. (2001). Best management practices for maximising whole farm<br />
irrigation efficiency in the cotton industry. Final Report for CRDC Project NEC2C. National Centre<br />
for Engineering in Agriculture Publication 179707/2, USQ, Toowoomba.<br />
72
Das, B., Sharif, Y., Khan, K., Das, P., and Shaheen S.M. 2002. Organochlorine pesticide residues in<br />
catfish, Tachysurus thalassinus (Ruppell, 1835), from the South Patches of the Bay of Bengal.<br />
Environmental Pollution 120 (2002) 255–259.<br />
Department of Agriculture Fisheries & Forestry (DAFF). 2001. Report on the Australian National<br />
Residue Survey Results 2000-2001.<br />
Department of Primary Industries and Fisheries (DPI&F). 2005. Site identification for aquacultureassessment<br />
of chemical contamination in site selection. State of Queensland, QI05078.<br />
Diana, J. 1997. Feeding Strategies. In: Egna, H.S. and Boyd C.E. (eds) Dynamics of Pond<br />
Aquaculture. CRC Press, New York, pp245-262.<br />
Environmental Protection Agency (EPA). 2006. Wetland mapping and classification project.<br />
http://www.epa.qld.gov.au/nature_conservation/habitats/wetlands/wetland_ An estimate of the storage<br />
capacity for the catchment in private storages was made based on the spatial dataset "1:100,000<br />
Mapping of Wetlands for the Condamine River catchment".<br />
Egaas, E., Skaare, J.U., Svendsen, N.O., Sandvik, M., Falls, J.G., Dauterman, W.C., Collier, T.K. and<br />
Neland, J. 1993. A comparative study of effects of atrazine on xenobiotic metabolizing enzymes in<br />
fish and insect, and of the in vitro phase II atrazine metabolism in some fish, insects, mammals and<br />
one plant species. Comparative Biochemistry and Physiology C 106(1):141-149.<br />
Extension Toxicology Network Pesticide Information Profiles (EXTOXNET). 2006a.<br />
http://extoxnet.orst.edu/pips/endosulf.htm<br />
Extension Toxicology Network Pesticide Information Profiles (EXTOXNET). 2006b.<br />
http://extoxnet.orst.edu/pips/simazine.htm<br />
Extension Toxicology Network Pesticide Information Profiles (EXTOXNET). 2006c.<br />
http://extoxnet.orst.edu/pips/cypermet.htm<br />
Extension Toxicology Network Pesticide Information Profiles (EXTOXNET). 2006d.<br />
http://extoxnet.orst.edu/pips/heptachl.htm<br />
Food Standards Australia New Zealand (FSANZ). 2006. Australia New Zealand Food Standards<br />
Code –2006 http://www.foodstandards.gov.au/foodstandardscode/<br />
Gavine, F and Gooley, G. 2003. Resources, Systems and Species for Australian Integrated Agri-<br />
Aquaculture Systems. In Gooley, G. J. and Gavine, F. M. (eds) Integrated Agri-Aquaculture Systems<br />
A Resource Handbook for Australian Industry Development. A report for the Rural Industries<br />
Research and Development Corporation Publication No. 03/012 Project No. MFR-2A<br />
Gooley, G. J. and Gavine, F. M. 2003. Integrated Agri-Aquaculture Systems- A Resource Handbook<br />
for Australian Industry Development, RIRDC Project No. MFR-2A.<br />
Goswami, K.P., and R.E. Green. 1971. Microbial degradation of the herbicide atrazine and its 2-<br />
hydroxy analog in submerged soils. Environmental Science and Technology. 5:426–429<br />
Grabe, S.W., Spencer, A., Spa, T. and Cunningham, D. 2002. Design and Evaluation of Large Scale<br />
In Pond Raceway. Poster presentation.<br />
Hargreaves, J. A. l999. Control of clay turbidity in ponds. Southern Regional Aquaculture Center<br />
Pub. No. 460. Mississippi State University.<br />
Hedlund RT. 1973. Bioconcentration of chlorpyrifos by mosquito fish in a flowing system.<br />
DowElanco, Indianapolis, IN. [unpublished study as cited in Racke 1993]<br />
73
Herbert, B. and Graham, P. 2004a. Weaning of the golden perch, Macquaria ambigua ambigua,<br />
Percicthyidae, onto prepared diets. Journal of Applied Aquaculture 15(3/4):163-171. Austasia<br />
Aquaculture .<br />
Herbert, B.W. and Graham, P.A. 2004b.Use of Artemia Frozen Zooplankton and Artificial Food for<br />
Weaning Fingerlings of the Freshwater Fish Golden Perch Macquaria ambigua ambigua<br />
(Percichthyidae). Asian Fisheries Science 16(1).<br />
Hussein, S.Y., El-Nasser, S. and Ahmed, M. 1996. Comparative Studies on the Effects of Herbicide<br />
Atrazine on Freshwtaer Fish Oreochromis niloticus and Chrysichthyes auratus at Assiut, Egypt.<br />
Bulletin of Environmental Contamination and Toxicology, 57:503-510.<br />
Hunter, H.M. 1992. Agricultural Contaminants in Aquatic Environments; a review. Queensland<br />
Department of Primary Industries and Fisheries, Brisbane, QB92002.<br />
International Programme on Chemical Safety (IPCS) INCHEM. 2006<br />
http://www.inchem.org/documents/jmpr/jmpmono/v067pr14.htm<br />
Kelly, M.A. and Kohler, C.C. 1997. Climate, Site and Pond Design. In Egna, H.S. and Boyd, C.E.<br />
(eds). Dynamics of Pond Aquaculture. CRC Press New York.<br />
Kidd, H. and James, D.R. Eds. The Agrochemicals Handbook, Third Edition. Royal Society of<br />
Chemistry Information Services, Cambridge, UK, 1991 (as updated).8-7.<br />
Koehn J.D. and W. G. O'Connor, 1990. Biological Information for Management of native freshwater<br />
fish in Victoria. Dept. of Conservation and Environment, Freshwater Fish Management Branch,<br />
Arthur Rylah Institute for Environmental Research. 165 pp.<br />
Macek, K.J., Petrocelli, S.R., and Sleight, B.H. III. 1979. Consideration in assessing the potential for,<br />
and significance of, biomagnification of chemical residues in aquatic food chains. In: Marking, L.L.,<br />
Kimerle R.A. (eds) Aquatic Toxicology, ASTM STP 667. Amecrican Society for Testing and<br />
Materials. Pp251-268.<br />
Masser, M.P. and Lazur, A. 1997. In-pond Raceways. South Regional Aquaculture Centre<br />
http://www.msstate.edu/dept/srac/publicat.htm<br />
Masser, M.P., Wilcox, W.D., Yoo, K.H., and Sonnenholsner, S.A. 1999. The In-Pond Raceway At<br />
Auruban University: A Historical Perspective. Aquaculture America 1999 Book of Abstracts, pp114-<br />
115, U.S. Chapter of The World Aquaculture Society, January 27-30, Florida.<br />
Mc Veigh,P. 2003. Integrated Cotton- Native Fish. In Gooley, G. J. and Gavine, F. M. (eds)<br />
Integrated Agri-Aquaculture Systems A Resource Handbook for Australian Industry Development. A<br />
report for the Rural Industries Research and Development CorporationPublication No. 03/012 Project<br />
No. MFR-2A.<br />
Mersie, W., and C. Seybold. 1996. Adsorption and desorption of atrazine, deethylatrazine,<br />
deiosopropylatrazine, and hyrdroxyatrazine on levy wetland soil. Journal of Agricultural and Food<br />
Chemistry. 44:1925–1929.<br />
Moncada, A. 2003. Environmental Fate Of Indoxacarb. Department of Pesticide Regulation,<br />
California. http://www.cdpr.ca.gov/docs/empm/pubs/fatememo/indoxacarb.<strong>pdf</strong><br />
74
Müller , J.F., S Duquesne, Jack. Ng, G.R. Shaw, K. Krrishnamohan, K. Manonmanii, M.Hodge &<br />
G.K. Eaglesham. 2000. Pesticides in Sediments From Queensland Irrigation Channels and Drains.<br />
Marine Pollution Bulletin, Volume 41, Issues 7-12, Pages 294-301.<br />
Muschal, M., and Cooper, B. 1998. Regional level monitoring of pesticides and their behaviour in<br />
rivers. In: Minimising the impacts of pesticides on the riverine environment: Key findings from<br />
research with the cotton industry—1998 Conference: Land and Water Resources Research and<br />
Development Corporation, p 44.<br />
Napier, G.M., Fairweather, P.G., and Scott, A. 1998. Records of fish kills in inland waters of NSW<br />
and Queensland in relation to cotton pesticides. WETLANDS (Australia) 17(2).<br />
National Pesticide Telecommunications Network (NPTN). 1998. http://npic.orst.edu/<br />
National Registration Authority for Agricultural and Veterinary Chemicals (NRA). 2000. The NRA<br />
Review of CHLORPYRIFOS, September 2000 Volume 1. Canberra.<br />
http://www.apvma.gov.au/chemrev/chlorpyrifos_summary.<strong>pdf</strong><br />
Neskovic, N.K., Elezovic, I., Karan, V., Budimir, M. 1993. Acute and sub acute toxicity of atrazine<br />
to carp (Cyprinus carpio L.). Ecotoxicology and Environmental Safety 25(2):173-82.<br />
Patra R, Chapman JC, Gehrke PC & Lim RP 1995a. Effects of sub-lethal concentrations of endosulfan<br />
on the critical thermal maxima of freshwater fish. Poster abstract PW113. In Proceedings Second<br />
SETAC World Congress (16th Annual Meeting) Vancouver BC, 5−9 November 1995.<br />
Pesticide Action Network (PAN) Pesticides Database. 2006. http://www.pesticideinfo.org/Index.html<br />
Pesticide Management Education Program (PMEP). 2006. http://pmep.cce.cornell.edu/<br />
Pluta, H.J. 1989. Toxicity of several xenobiotics and waste water effluents measured with a new fish<br />
early life stage test. German Journal for Applied Zoology 76: 195-220.<br />
Prasad, A.T., Scrinivas, T., Rafi, G.M. and Reddy, D.C. 1991. Effect in vivo of atrazine on<br />
haematology and O2 consumption in fish Tilapia mossambica. Biochem International 23(1):157-161.<br />
Primary Industries and Resources South Australia (PIRSA). 2003 Aquaculture potential of Australian<br />
native finfish. FactSheet: 14/99. www.pir.sa.gov.au/factsheets<br />
Pyke, B. of Australian Cotton Research and Development Corporation. Personal communication.<br />
Racke, K.D, 1993. Environmental fate of chlorpyrifos. In Ware, G.W. Reviews of Environmental<br />
Contamination and Toxicology, Volume 131, 1993, Pages 1-150.<br />
Roach, A. C, and Runcie, J. 1998. Levels of Selected Chlorinated Hydrocarbons in Edible Fish<br />
Tissues from Polluted Areas in the Georges/Cooks Rivers and Sydney Harbour, New South Wales,<br />
Australia, in Marine Pollution Bulletin, Vol 36, No.5:323-344.<br />
Rowland, S.J., Allan, G.L., Hollis, M., and Pontifex, T. 2004. Production of silver perch (Bidyanus<br />
bidyanus) fingerlings at three stocking densities in cages and tanks. Aquaculture 229,193-202.<br />
Rowland, S.J., Allan, G.L., Hollis, M., and Pontifex, T. 1995. Production of the Australian<br />
freshwater silver perch Bidyanus bidyanus (Mitchell), at two densities in earthern ponds. Aquaculture<br />
130,317-218.<br />
Rowland, S.J. and Bryant, C. eds. 1995. Silver Perch Culture. Turtle Press Pty. Ltd.<br />
75
Seybold, C.A., Mersie W, and McNamee, C. 2001. Anaerobic Degradation of Atrazine and<br />
Metolachlor and Metabolite Formation in Wetland Soil and Water Microcosms. Journal of<br />
Environmental Quality 30:1271-1277.<br />
Seybold, C.A., and W. Mersie. 1996. Adsorption and desorption of atrazine, deethylatrazine,<br />
deisopropylatrazine, hydroxyatrazine, and metolachlor in two soils. Journal of Environmental Quality.<br />
25:1179–1185.<br />
Suedel, B.C., J.A. Boraczek, R.K. Peddicord, P.A. Clifford, and T.M. Dillon. 1994. Trophic transfer<br />
and biomagnification potential of contaminants in aquatic ecosystems. Reviews of Environmental<br />
Contamination and Toxicology 136:21-89.<br />
Sunderam, R.I.M., Cheng, D.M.H. and Thompson, G.B. 1992. Toxicity of endosulfan to native and<br />
introduced fish in Australia. Environmental Toxicology & Chemistry 11:1469-1476.<br />
The Australian Cotton Grower (ACG). 2002. Cotton YearBook 2002. The Australian Cotton<br />
Grower, Toowoomba.<br />
Tsuda, T., Kojima, H., Harada, H., Nakajim, A., and Aoki, S. 1997. Relationships of<br />
Bioconcentration Factors of Organophoshate Pesticides Among Species of Fish. Comparative<br />
Biochemistry & Physiology vol116C no.3:213-218.<br />
United States Environmental Protection Agency (USEPA). 1987. Pesticide Fact Sheet Number 106:<br />
Metolachlor. Office of Pesticides and Toxic Substances, Washington, DC, 1987.10-101.<br />
United States Environmental Protection Agency (USEPA). 2000. Guidance for Assessing Chemical<br />
Contaminant Data for Use In Fish Advisories. http://www.epa.gov/waterscience/fish/guidance.html<br />
United States Environmental Protection Agency (USEPA). 2006. Pesticide Fact Sheet ‘Indoxacarb’.<br />
http://www.epa.gov/opprd001/factsheets/indoxacarb.<strong>pdf</strong><br />
Varo, I., Serrano, R., Pitarch, F., Amat, F., Lopez, J., and Navarro, J.C. 2000. Toxicity and<br />
bioconcentration of Chlorpyrifos in aquatic organisms: Artemia parthenogenetica (Crustacea),<br />
Gambusia affinis, and Aphanius iberus (Pisces). Bulletin of Environmental Contamination and<br />
Toxicology, 65:623-630.<br />
Victorian Department of Primary Industries (VDPI). 2006. http://www.dpi.vic.gov.au/<br />
Wan, P., Santerre. C.R. and Deardoff, D.C. 2000. Chlorpyrifos in Catfish (Ictalarus punctatus)<br />
Tissue. Bulletin of Environmental Contamination and Toxicology, 65:84-90.<br />
Ware, G.W. 1986. Fundamentals of Pesticides. 2nd ed. Thomas Publications, California.<br />
World Health Organization (WHO). 1984. Environmental Health Criteria 38: Heptachlor. Geneva,<br />
Switzerland, 6-59.<br />
Yoo, K.H., Masser M.P., and Hawcroft, B.A.,. 1995. “An In-pond Raceway System Incorporating<br />
Removal of Fish Wastes.” Aquacultural Engineering, 14, 175-187.<br />
76
Integrated Agri-Aquaculture<br />
Demonstration Facility<br />
Using irrigation storages for intensive native fish culture<br />
RIRDC Publication No. 09/060<br />
There are many thousands of hectares of water storage on<br />
cotton farms in Australia. This report shows how the water<br />
infrastructure developed by the cotton industry for such large<br />
scale irrigation may also have potential for development of<br />
aquaculture. The introduction of an additional cropping<br />
opportunity may have significant economic, environmental<br />
and social benefits. It does however, also face several<br />
operational challenges that stem from the need to manage<br />
these water bodies and the farm’s other activities in a more<br />
intensive and considered fashion.<br />
This report is targeted at irrigators who may be interested<br />
in diversifying their business by integrating commercial<br />
aquaculture with irrigated agriculture. It focuses on a<br />
demonstration site in the cotton industry in Queensland,<br />
but contains valuable information for potential investors<br />
throughout Australia.<br />
The Rural Industries Research and Development Corporation<br />
(RIRDC) manages and funds priority research and translates<br />
results into practical outcomes for industry.<br />
Our business is about developing a more profitable, dynamic<br />
and sustainable rural sector. Most of the information we<br />
produce can be <strong>download</strong>ed for free or purchased from our<br />
website: www.rirdc.gov.au, or by phoning 1300 634 313 (local<br />
call charge applies).<br />
Most RIRDC books can be freely <strong>download</strong>ed<br />
or purchased from www.rirdc.gov.au or by<br />
phoning 1300 634 313 (local call charge<br />
applies).<br />
www.rirdc.gov.au<br />
Contact RIRDC:<br />
Level 2<br />
15 National Circuit<br />
Barton ACT 2600<br />
PO Box 4776<br />
Kingston ACT 2604<br />
Ph: 02 6271 4100<br />
Fax: 02 6271 4199<br />
Email: rirdc@rirdc.gov.au<br />
web: www.rirdc.gov.au