When Healing Becomes Educating, Vol. 6 - Waldorf Research Institute
When Healing Becomes Educating, Vol. 6 - Waldorf Research Institute
When Healing Becomes Educating, Vol. 6 - Waldorf Research Institute

Create successful ePaper yourself
Turn your PDF publications into a flip-book with our unique Google optimized e-Paper software.
“Vaccination—a Crime against Our Children?” (Erfahrungsheilkunde Feb.<br />
1991, from which most of the following graphs are taken), and his chapter in<br />
S. Delarue’s book on vaccination—The Unbelievable Error (Hirthhauer-Verlag,<br />
Munich 1990). Of course, these titles will be very irritating to believers<br />
in conventional medicine. He has another article in a reprint from the<br />
German Journal for Homeopathy Nr. 1, 1989, which is entitled “Vaccination<br />
Is Not Protective, Vaccination Is Useless, Vaccination Is Harmful,” and it<br />
gives a detailed description of almost all kinds of inoculation and of the<br />
more or less intentionally misleading advertising, erroneous data, statistical<br />
sources of error and especially the consequences of inoculation injuries with<br />
numerous illustrated cases.<br />
Obviously vaccination is still a very murky field which is dominated<br />
by the strongest lobby, just as in atomic energy. But the field is not quite<br />
as opaque as the atomic energy one, for the available statistical material<br />
enables even a layman to gain an overview and to make a judgment, in spite<br />
of all the inaccuracies due to the unwillingness of doctors to make reports,<br />
etc. This can be seen in the following curves which Buchwald published and<br />
which mainly come from the Federal Bureau of Statistics in Wiesbaden and<br />
from other reliable sources.<br />
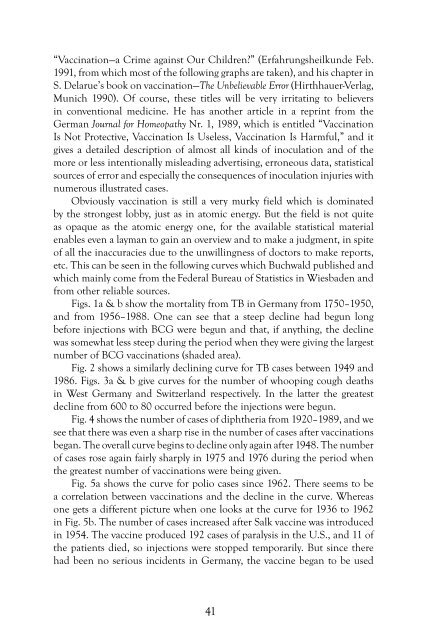
Figs. 1a & b show the mortality from TB in Germany from 1750–1950,<br />
and from 1956–1988. One can see that a steep decline had begun long<br />
before injections with BCG were begun and that, if anything, the decline<br />
was somewhat less steep during the period when they were giving the largest<br />
number of BCG vaccinations (shaded area).<br />
Fig. 2 shows a similarly declining curve for TB cases between 1949 and<br />
1986. Figs. 3a & b give curves for the number of whooping cough deaths<br />
in West Germany and Switzerland respectively. In the latter the greatest<br />
decline from 600 to 80 occurred before the injections were begun.<br />
Fig. 4 shows the number of cases of diphtheria from 1920–1989, and we<br />
see that there was even a sharp rise in the number of cases after vaccinations<br />
began. The overall curve begins to decline only again after 1948. The number<br />
of cases rose again fairly sharply in 1975 and 1976 during the period when<br />
the greatest number of vaccinations were being given.<br />
Fig. 5a shows the curve for polio cases since 1962. There seems to be<br />
a correlation between vaccinations and the decline in the curve. Whereas<br />
one gets a different picture when one looks at the curve for 1936 to 1962<br />
in Fig. 5b. The number of cases increased after Salk vaccine was introduced<br />
in 1954. The vaccine produced 192 cases of paralysis in the U.S., and 11 of<br />
the patients died, so injections were stopped temporarily. But since there<br />
had been no serious incidents in Germany, the vaccine began to be used<br />
41