Solar PV Atlas: Solar Power in Harmony with Nature - WWF
Solar PV Atlas: Solar Power in Harmony with Nature - WWF
Solar PV Atlas: Solar Power in Harmony with Nature - WWF

Create successful ePaper yourself
Turn your PDF publications into a flip-book with our unique Google optimized e-Paper software.
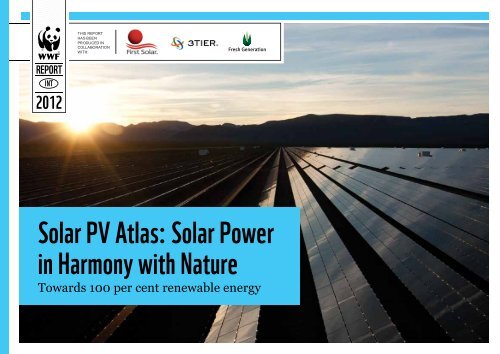
<strong>Solar</strong> <strong>PV</strong> <strong>Atlas</strong>: <strong>Solar</strong> <strong>Power</strong><br />
<strong>in</strong> <strong>Harmony</strong> <strong>with</strong> <strong>Nature</strong><br />
Towards 100 per cent renewable energy
<strong>Solar</strong> <strong>PV</strong> <strong>Atlas</strong>: PARTNERS<br />
<strong>WWF</strong><br />
FIRST SOLAR<br />
3TIER<br />
FRESH GENERATION<br />
<strong>WWF</strong> is one of the world’s largest<br />
and most experienced <strong>in</strong>dependent<br />
conservation organizations, <strong>with</strong> over 5<br />
million supporters and a global network<br />
active <strong>in</strong> more than 100 countries.<br />
<strong>WWF</strong>’s mission is to stop the degradation<br />
of the planet’s natural environment and<br />
to build a future <strong>in</strong> which humans live <strong>in</strong><br />
harmony <strong>with</strong> nature, by conserv<strong>in</strong>g the<br />
world’s biological diversity, ensur<strong>in</strong>g that<br />
the use of renewable natural resources is<br />
susta<strong>in</strong>able, and promot<strong>in</strong>g the reduction<br />
of pollution and wasteful consumption.<br />
The Global Climate & Energy Initiative<br />
(GCEI) is <strong>WWF</strong>’s global programme<br />
address<strong>in</strong>g climate change and a move<br />
to 100% renewable energy through<br />
engagement <strong>with</strong> bus<strong>in</strong>ess, promot<strong>in</strong>g<br />
renewable and susta<strong>in</strong>able energy, scal<strong>in</strong>g<br />
green f<strong>in</strong>ance and work<strong>in</strong>g nationally<br />
and <strong>in</strong>ternationally on low carbon<br />
frameworks.<br />
Avenue du Mont-Blanc<br />
1196 Gland<br />
Switzerland<br />
www.panda.org<br />
Founded <strong>in</strong> 1999, First <strong>Solar</strong> has become<br />
the world’s premier provider of fully<br />
<strong>in</strong>tegrated solar solutions, creat<strong>in</strong>g valuedriven<br />
renewable energy projects that<br />
represent the lead<strong>in</strong>g edge of utility-scale<br />
solar technology and <strong>in</strong>novation.<br />
Hav<strong>in</strong>g constructed and commissioned<br />
many of the world’s largest, state-ofthe-art<br />
photovoltaic (<strong>PV</strong>) power plants<br />
<strong>in</strong> operation today, First <strong>Solar</strong> has<br />
established a portfolio of customers<br />
that <strong>in</strong>clude some of the world’s most<br />
sophisticated energy buyers. The firm’s full<br />
service approach ensures the successful<br />
delivery of clean, affordable solar<br />
power and spans the entire value cha<strong>in</strong>,<br />
<strong>in</strong>clud<strong>in</strong>g module manufactur<strong>in</strong>g; project<br />
development; eng<strong>in</strong>eer<strong>in</strong>g, procurement,<br />
and construction (EPC); f<strong>in</strong>anc<strong>in</strong>g; and<br />
operations and ma<strong>in</strong>tenance (O&M).<br />
350 West Wash<strong>in</strong>gton St., Suite 600<br />
Tempe, AZ 85281<br />
United States<br />
www.firstsolar.com<br />
3TIER helps the global energy market<br />
manage renewable energy risk. A<br />
pioneer <strong>in</strong> w<strong>in</strong>d and solar generation risk<br />
analysis, 3TIER uses weather science<br />
to frame the risk of weather-driven<br />
variability – anywhere on Earth, across<br />
all time horizons. With offices serv<strong>in</strong>g<br />
North America, Europe, the Middle East,<br />
Africa, India, Lat<strong>in</strong> America, and the Asia<br />
Pacific region, 3TIER has global reach<br />
<strong>with</strong> services spann<strong>in</strong>g renewable energy<br />
project feasibility, energy market<strong>in</strong>g and<br />
asset management.<br />
2001 Sixth Avenue, Suite 2100<br />
Seattle, WA 98121<br />
United States<br />
www.3tier.com<br />
Work<strong>in</strong>g to expedite a global shift to<br />
susta<strong>in</strong>able energy economies, Fresh<br />
Generation provides resource, market,<br />
and policy analysis to <strong>in</strong>crease the speed,<br />
efficiency, and cost-effectiveness of<br />
renewable energy adoption. Founded <strong>in</strong><br />
2009, Fresh Generation has experience<br />
<strong>in</strong> both large- and small-scale renewable<br />
energy development. The firm has served<br />
high-profile clients <strong>in</strong> media, energy and<br />
security.<br />
1616 H St. NW Suite 900<br />
Wash<strong>in</strong>gton, DC 20006<br />
United States<br />
www.freshgeneration.com<br />
ISBN 978-2-940443-63-5<br />
Front cover photo: © First <strong>Solar</strong><br />
Copper Mounta<strong>in</strong>, Nevada, USA<br />
Sempra Energy us<strong>in</strong>g First <strong>Solar</strong> modules<br />
(58 MW)<br />
1
<strong>Solar</strong> <strong>PV</strong> <strong>Atlas</strong><br />
CONTRIBUTORS<br />
Editors <strong>in</strong> Chief:<br />
Pr<strong>in</strong>cipal Writer:<br />
Pr<strong>in</strong>cipal Cartographer:<br />
Special thanks to:<br />
Jean-Philippe Denruyter and Lettemieke Mulder<br />
Allison Archambault<br />
Christian Sarason<br />
Michael Anderson, Ceren Ayas, Bryn Baker,<br />
Gwen Bender, Leo Bottrill, Maria De Lope,<br />
Karen Drozdiak, Saliem Fakir, May Guerraoui,<br />
Nyoman Iswarayoga, Tish K<strong>in</strong>g, Aarti Khosla,<br />
Yaprak Kurtsal, Laura Luckhurst, Faouzi Maamouri, Ben<br />
Mahler, Richard McLellan, Al<strong>in</strong> Moncada,<br />
Susana Moriera, Abhishek Nath, Mustafa Özgür Berke, TS<br />
Panwar, Vanessa Perez-Cirera,<br />
Voahirana Randriambola, Indra Sari Wardhani,<br />
Chris Sewell, Jay A. Scouten, Aurelie Shapiro,<br />
W<strong>in</strong>slow Sheffield, Stephan S<strong>in</strong>ger, Christoph Ste<strong>in</strong>, Todd<br />
Stone, Maja Wessels, Katr<strong>in</strong> W<strong>in</strong>dolf, and<br />
Richard Worth<strong>in</strong>gton.<br />
2
<strong>Solar</strong> <strong>PV</strong> <strong>Atlas</strong><br />
<strong>Solar</strong> <strong>PV</strong> <strong>Atlas</strong>: CONTENTS<br />
Executive summary 6<br />
100 per cent RENEWABLE ENERGY BY 2050 8<br />
MAPS AND PROFILES 12<br />
Indonesia 12<br />
Madagascar 17<br />
Madhya Pradesh, India 21<br />
Mexico 25<br />
Morocco 31<br />
South Africa 35<br />
Turkey 40<br />
ELECTRICITY CONSUMPTION IN 2050 44<br />
Efficiency and electrification 44<br />
Access and equity 44<br />
ELECTRICITY IN HARMONY WITH NATURE: PHOTOVOLTAICS 46<br />
APPENDICES 50<br />
Annex 1: About this atlas – data, assumptions and process 50<br />
Annex 2: Impact categories for utility-scale solar <strong>PV</strong> 54<br />
Annex 3: Development example –Desert Sunlight 56<br />
Glossary 57<br />
Notes and references 60<br />
© Ala<strong>in</strong> Compost / <strong>WWF</strong>-Canon<br />
4
SOLAR ATLAS: EXECUTIVE SUMMARY<br />
Renewable energy requires land. But just<br />
how much?<br />
This atlas illustrates some answers for<br />
one sector, solar photovoltaic electricity,<br />
<strong>in</strong> seven different regions.<br />
The Energy Report, published by <strong>WWF</strong><br />
<strong>in</strong> 2010, called for renewable energy to<br />
meet all global energy needs by 2050.<br />
While a balanced portfolio of renewable<br />
energy sources will ultimately fill global<br />
energy needs, this atlas considers solar<br />
photovoltaic electricity. Today, solar photovoltaic<br />
electricity, sometimes called just<br />
<strong>PV</strong>, provides 0.1 per cent of total global<br />
electricity generation. However, <strong>PV</strong> has<br />
seen an average annual growth rate of<br />
more than 40 per cent s<strong>in</strong>ce 2000. Now a<br />
well-established, commercially available<br />
and reliable technology, it has significant<br />
potential for long-term growth <strong>in</strong> nearly<br />
all world regions now and <strong>in</strong> the com<strong>in</strong>g<br />
decades.<br />
The atlas considers electricity demands <strong>in</strong><br />
seven diverse regions and calculates the<br />
area (land or roof) that would be needed<br />
for <strong>PV</strong> to meet these demands. In each<br />
of these cases, less than one per cent of<br />
the region’s total land cover would be<br />
required to host solar <strong>PV</strong> panels <strong>in</strong> order<br />
to meet one hundred per cent of the region’s<br />
projected electricity needs <strong>in</strong> 2050,<br />
tak<strong>in</strong>g <strong>in</strong>to account solar resources and<br />
predicted electricity consumption and<br />
demographic changes.<br />
While it is unlikely that all electricity will<br />
come from solar <strong>PV</strong> <strong>in</strong> 2050, this “100<br />
per cent” scenario serves to illustrate that<br />
even us<strong>in</strong>g very conservative numbers<br />
for calculations, the maximum amount of<br />
space solar <strong>PV</strong> could need, on the ground<br />
and on build<strong>in</strong>gs, is relatively low. In a<br />
realistic global portfolio of renewable energy<br />
generation technologies, <strong>PV</strong> will very<br />
likely require far less land than illustrated<br />
here. Several credible scenarios suggest<br />
that solar <strong>PV</strong> could provide about 30 per<br />
cent of global total electricity <strong>in</strong> 2050. Of<br />
course, grid <strong>in</strong>tegration, storage and balanc<strong>in</strong>g<br />
are important issues to address for<br />
renewable energy to be successful. These<br />
topics are beyond the scope of the atlas<br />
but are covered <strong>in</strong> The Energy Report by<br />
<strong>WWF</strong>.<br />
With its selection of diverse areas, the<br />
atlas illustrates that <strong>PV</strong> technology, when<br />
well-planned, does not conflict <strong>with</strong><br />
conservation goals. On a macro level, no<br />
country or region must choose between<br />
solar <strong>PV</strong> and space for humans and<br />
nature. Quite the opposite. As climate<br />
change threatens humans and the environment,<br />
it is more important than ever<br />
to work for the efficient and wide-scale<br />
adoption of well sited, responsibly and<br />
effectively operated renewable energy<br />
generation facilities. Environmental<br />
protection and renewable energy can and<br />
must develop <strong>in</strong> parallel.<br />
5
<strong>Solar</strong> <strong>PV</strong> <strong>Atlas</strong><br />
At the local level, there has been some concern<br />
that <strong>PV</strong> development could conflict <strong>with</strong><br />
livelihood and conservation goals. While these<br />
concerns are important to consider, research<br />
has consistently found that, when developed<br />
responsibly, ground-mounted and roof-mounted<br />
solar <strong>PV</strong> power plants provide considerable<br />
economic and environmental benefits. <strong>PV</strong> solar<br />
manufacturers, project developers, policy makers,<br />
and other relevant parties should convene a<br />
multi-stakeholder <strong>in</strong>itiative to establish global,<br />
sector-wide guidel<strong>in</strong>es for responsible community<br />
engagement and land management.<br />
Each region selected for this atlas holds great solar<br />
resource. Resource availability alone, however,<br />
does not def<strong>in</strong>e markets. Policy also shapes<br />
a nation’s energy supply, and, despite considerable<br />
obstacles to overcome, there is room for<br />
optimism <strong>in</strong> each of the selected regions. From<br />
bold targets to t<strong>in</strong>y first steps, the policies noted<br />
<strong>in</strong> this atlas show potential for large and susta<strong>in</strong>able<br />
solar market development if expanded and<br />
enacted well.<br />
© First <strong>Solar</strong><br />
6
100 per cent Renewable Energy by 2050: Our future is renewable<br />
<strong>WWF</strong> has a vision<br />
of a world that<br />
is powered by 100<br />
per cent renewable<br />
energy sources by<br />
the mIddle of this<br />
century.<br />
<strong>WWF</strong>, The Energy<br />
Report : 100 per cent<br />
Renewable by 2050<br />
The way we produce and use energy<br />
today is not susta<strong>in</strong>able. Our ma<strong>in</strong> fossil<br />
fuel sources – oil, coal and gas – are f<strong>in</strong>ite<br />
natural resources. Furthermore they are<br />
the ma<strong>in</strong> contributors to climate change,<br />
and the race to the last “cheap” fossil<br />
resources evokes disasters for the natural<br />
environment. Nuclear energy poses its<br />
own threats to humanity and the environment<br />
and rema<strong>in</strong>s cost-prohibitive when<br />
full costs are considered. In the develop<strong>in</strong>g<br />
world, regional and local desertification<br />
is caused by the depletion of fuelwood<br />
that is often used very <strong>in</strong>efficiently<br />
caus<strong>in</strong>g substantive <strong>in</strong>door pollution and<br />
millions of deaths annually. A fully susta<strong>in</strong>able<br />
renewable power supply is the<br />
only way we can secure energy for all and<br />
avoid environmental catastrophe. <strong>WWF</strong><br />
has a vision of a world that is powered by<br />
100 per cent renewable energy sources by<br />
the middle of this century.<br />
Already the world is mov<strong>in</strong>g quickly <strong>in</strong><br />
this direction. Figures recently released<br />
estimate that renewable energy sources<br />
supplied 16.7 per cent of global f<strong>in</strong>al<br />
energy consumption <strong>in</strong> 2010, and modern<br />
clean sources of electricity – like<br />
w<strong>in</strong>d and solar – are grow<strong>in</strong>g at impressive<br />
rates. 1 Though it currently provides<br />
just 0.1 per cent of total global electricity<br />
generation, 2 solar <strong>PV</strong> has been grow<strong>in</strong>g<br />
the fastest of all renewable energy technologies,<br />
<strong>with</strong> operat<strong>in</strong>g capacity <strong>in</strong>creas<strong>in</strong>g<br />
by an average of 58 per cent annually<br />
between 2006 and 2011. 3<br />
We stand at an excit<strong>in</strong>g moment of transition<br />
when renewable energies are compet<strong>in</strong>g<br />
head-to-head <strong>with</strong> long-subsidized<br />
fossil and nuclear power. People around<br />
the world are grasp<strong>in</strong>g the importance<br />
of a clean and susta<strong>in</strong>able energy future<br />
while clean technology prices are dropp<strong>in</strong>g<br />
and policy makers are restructur<strong>in</strong>g<br />
markets.<br />
This atlas builds upon the The Energy<br />
Report, published by <strong>WWF</strong> <strong>in</strong> 2010,<br />
which calls for renewable energy to meet<br />
all global energy needs by 2050. Published<br />
jo<strong>in</strong>tly <strong>with</strong> that report, an energy<br />
scenario by Ecofys * illustrates one path<br />
to atta<strong>in</strong><strong>in</strong>g that goal and shows how a<br />
comb<strong>in</strong>ation of efficiency measures and<br />
renewable generation, us<strong>in</strong>g today’s technologies,<br />
can meet global energy needs to<br />
unlock a future of low carbon prosperity.<br />
*The <strong>WWF</strong> Energy Report and the Ecofys Energy<br />
Scenario are available for free download at<br />
www.panda.org/energyreport<br />
7
<strong>Solar</strong> <strong>PV</strong> <strong>Atlas</strong><br />
F<strong>in</strong>al energy (EJ/a)<br />
400 Nuclear<br />
Coal<br />
Natural gas<br />
350<br />
Oil<br />
Bio: Algae<br />
300<br />
Bio: Crops<br />
Bio: Comp.Fell<strong>in</strong>gs*<br />
250<br />
Bio: Traditional<br />
Bio: Resid.&Waste<br />
200<br />
Hydropower<br />
Geo: Heat<br />
150<br />
Geo: Electricity<br />
<strong>Solar</strong> thermal<br />
Conc. solar: Heat<br />
100<br />
Conc. solar: <strong>Power</strong><br />
Photovoltaic solar<br />
50<br />
Wave & Tidal<br />
W<strong>in</strong>d: Off-shore<br />
0<br />
W<strong>in</strong>d: On-shore<br />
2000 2010 2020 2030 2040 2050<br />
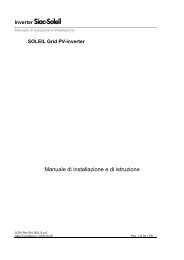
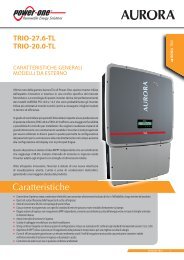
Figure 1: Global ENERGY Supply<br />
Ecofys projects that nearly all global energy needs could come from renewables<br />
by 2050. In this scenario, total energy consumption would fall by about<br />
15 per cent by 2050 compared to today <strong>with</strong> efficiency measures hav<strong>in</strong>g a<br />
stronger trend <strong>in</strong>fluence than population growth. Source: The Energy Report,<br />
December 2010.<br />
Space for humans<br />
and nature<br />
<strong>WWF</strong> strongly believes that renewable energy<br />
can develop <strong>in</strong> harmony <strong>with</strong> humans and nature.<br />
While a balanced portfolio of renewable energy<br />
sources will ultimately fill global energy needs, this<br />
atlas provides some colourful examples for one<br />
major technology, solar photovoltaic electricity.<br />
A series of maps gives a high-level perspective<br />
on how renewable energy development, human<br />
development and biodiversity conservation can go<br />
hand <strong>in</strong> hand. The nature of this exercise is not to<br />
analyse where exactly solar parks should be developed<br />
or to discuss which specific areas should be<br />
protected but simply to illustrate how much space<br />
would be required for the development of solar <strong>PV</strong>.<br />
As reference we also highlight currently identified<br />
biodiversity hotspots, protected areas, and areas<br />
where high numbers of people now live.<br />
On a macro level, no country or region must<br />
choose between solar <strong>PV</strong> and space for humans<br />
and nature. Quite the opposite. As climate change<br />
threatens humans and the environment, it is more<br />
important than ever to work for the efficient and<br />
wide-scale adoption renewable energy generation<br />
facilities which are sited and operated responsibly.<br />
8
Less than one per cent<br />
POPULATION DENSITY<br />
SOLAR RESOURCE<br />
Environmental protection and renewable<br />
energy can and must develop <strong>in</strong> parallel.<br />
This atlas looks at Indonesia, Madagascar,<br />
Mexico, Morocco, South Africa,<br />
Turkey, and the Indian state of Madhya<br />
Pradesh. The regions represent diverse<br />
geographies, demographics, natural<br />
environments, economies and political<br />
structures. They receive different average<br />
levels of sunsh<strong>in</strong>e, and all show vast<br />
potential for widespread development<br />
of solar <strong>PV</strong>. By curat<strong>in</strong>g this selection<br />
of places, we hope to illustrate that <strong>PV</strong><br />
technology, when well-planned, does not<br />
conflict <strong>with</strong> conservation goals.<br />
As the solar irradiance maps illustrate, the sun<br />
sh<strong>in</strong>es brightly for these selected locations. We<br />
illustrate that <strong>in</strong> each of these cases less than<br />
one per cent of the region’s total land<br />
cover would be required to host solar<br />
<strong>PV</strong> generation <strong>in</strong> order to meet one<br />
hundred per cent of the region’s projected<br />
electricity needs <strong>in</strong> 2050, tak<strong>in</strong>g<br />
<strong>in</strong>to account predicted electricity consumption<br />
and demographic changes.<br />
While it is unlikely that all electricity will come<br />
from solar <strong>PV</strong> <strong>in</strong> 2050, this “100 per cent”<br />
scenario serves to illustrate that the maximum<br />
amount of space solar <strong>PV</strong> could need, on the<br />
ground and on build<strong>in</strong>gs, is relatively low. In<br />
a realistic global portfolio of different renewable<br />
energy generation technologies, <strong>PV</strong> will<br />
very likely require far less land than illustrated<br />
here. For <strong>in</strong>stance, the Ecofys scenario suggests<br />
that solar <strong>PV</strong> will provide about 30 per<br />
cent of global total electricity <strong>in</strong> 2050.<br />
Of course, grid <strong>in</strong>tegration, storage and balanc<strong>in</strong>g<br />
are important issues to address for<br />
renewable energy to be successful. These topics<br />
are beyond the scope of the atlas but are<br />
covered <strong>in</strong> The Energy Report.<br />
Land required for<br />
<strong>PV</strong> to meet 100 per<br />
cent of electricity<br />
production<br />
In 2010<br />
In 2050<br />
Land required for<br />
<strong>PV</strong> to meet 100 per<br />
cent of electricity<br />
production<br />
In 2010<br />
In 2050<br />
kWh / m 2 / day<br />
2 4 6 8<br />
Protected Areas<br />
Population Density > 100/km 2<br />
Population Density > 1000/km 2<br />
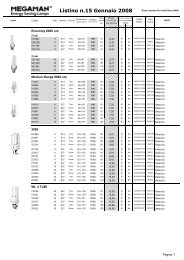
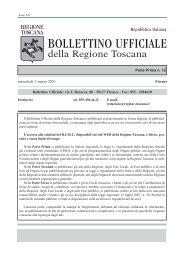
Figure 2: Example atlas maps<br />
For Madagascar, one of the atlas focus regions,<br />
the almost <strong>in</strong>visibly small red square on the maps<br />
above illustrates the total surface area needed for<br />
<strong>PV</strong> production to equal all of the country’s current<br />
electricity production. The larger blue square<br />
represents the surface area required to meet 100 per<br />
cent of projected electricity consumption <strong>in</strong> 2050.<br />
These squares are shown next to currently identified<br />
protected zones and densely-populated areas (left)<br />
and next to the country’s solar resource (right). The<br />
solar resource shows values for global horizontal<br />
irradiance (GHI). 4<br />
9
<strong>Solar</strong> <strong>PV</strong> <strong>Atlas</strong><br />
LESS THAN ONE<br />
PER CENT OF EACH<br />
REGION’S LAND COVER<br />
WOULD BE REQUIRED<br />
TO HOST SOLAR<br />
<strong>PV</strong> GENERATION IN<br />
ORDER TO MEET 100<br />
PER CENT OF THAT<br />
REGION’S PROJECTED<br />
ELECTRICITY NEEDS<br />
IN 2050.<br />
As we look at the “solar boxes” drawn on the<br />
maps and th<strong>in</strong>k about different land uses, we<br />
shouldn’t forget that other human activity and<br />
conventional energy also require land. The<br />
built environment–build<strong>in</strong>gs and roads–has<br />
already claimed much land that now has roofs,<br />
awn<strong>in</strong>gs, and other potential for shade strutures<br />
that could host <strong>PV</strong>. No additional land is<br />
required for such co-location of <strong>PV</strong> <strong>with</strong> these<br />
exist<strong>in</strong>g structures. New ground-mounted <strong>PV</strong><br />
systems often offer remarkable economy of<br />
land for the value of electricity they produce.<br />
As comparison, ground-mounted <strong>PV</strong> systems<br />
<strong>in</strong> areas of high <strong>in</strong>solation require less land<br />
than the coal-fuel cycle coupled <strong>with</strong> surface<br />
m<strong>in</strong><strong>in</strong>g to produce the same amount of electricity.<br />
5<br />
“GROUND-MOUNT <strong>PV</strong> SYSTEMS IN AREAS OF HIGH<br />
INSOLATION REQUIRE LESS LAND THAN THE COAL-<br />
FUEL CYCLE COUPLED WITH SURFACE MINING”<br />
In each of the selected regions, ground-mounted<br />
solar photovoltaic plants hold huge potential<br />
but need to be carefully sited. Given the<br />
very limited amount of total land (and/or roof<br />
space) required for even 100 per cent of total<br />
electricity needs from <strong>PV</strong>, it is clear that there<br />
is enough space for solar <strong>PV</strong> <strong>in</strong> each of the<br />
selected regions <strong>with</strong>out develop<strong>in</strong>g large-scale<br />
plants <strong>in</strong> protected areas or other areas that are<br />
not suitable for social, economic, technical or<br />
environmental reasons. In those zones, solar<br />
<strong>PV</strong> would be limited to small applications for<br />
local needs. Indeed, well-sited solar energy <strong>in</strong>stallations<br />
of all sizes can go hand <strong>in</strong> hand <strong>with</strong><br />
protection of biodiversity.<br />
Each region selected for this atlas holds great<br />
solar resource. Resource availability alone,<br />
however, does not def<strong>in</strong>e markets. Policy also<br />
shapes a nation’s energy supply, and despite<br />
considerable obstacles to overcome, here too<br />
we found reason for optimism <strong>in</strong> the selected<br />
regions. From bold targets to t<strong>in</strong>y first steps,<br />
the policies noted <strong>in</strong> this atlas show potential<br />
for large and susta<strong>in</strong>able solar market development<br />
if expanded and enacted well.<br />
10
<strong>Solar</strong> <strong>PV</strong> <strong>Atlas</strong>: Indonesia<br />
INDONESIA<br />
Less than one third of<br />
one per cent (0.27 per<br />
cent) of Indonesia’s land<br />
would need to host solar<br />
<strong>PV</strong> generation <strong>in</strong> order<br />
to meet 100 per cent of<br />
the country’s projected<br />
electricity needs <strong>in</strong> 2050.<br />
With a population of almost 250 million,<br />
Indonesia is the world’s fourth-most<br />
populous nation. In 2010 gross domestic<br />
product (GDP) per capita was US$4,394,<br />
and 12.5 per cent of the population <strong>in</strong><br />
2011 was below the national poverty<br />
l<strong>in</strong>e. 1 As of 2011, 71 per cent of residents<br />
had access to electricity. 2 Indonesia is the<br />
world’s third-largest emitter of greenhouse<br />
gasses (GHG), <strong>with</strong> 3.01 billion<br />
metric tons of greenhouse gases emitted<br />
<strong>in</strong> 2007, a comb<strong>in</strong>ed result of energy<br />
production and deforestation. 3<br />
mounta<strong>in</strong>ous regions. In the low-ly<strong>in</strong>g<br />
regions there are numerous coastal ecosystems<br />
<strong>in</strong>clud<strong>in</strong>g sand dunes, estuaries,<br />
mangroves, coral reefs and tidal flats.<br />
In addition, 60 per cent of Indonesia’s<br />
landmass is covered by forest. The rapid<br />
development and <strong>in</strong>dustrialization of<br />
Indonesia has led to massive (and often<br />
illegal) deforestation and wildfires that<br />
threaten many of the <strong>in</strong>digenous species<br />
and ecosystems <strong>in</strong> addition to contribut<strong>in</strong>g<br />
to 85 per cent of its annual GHG<br />
emissions. 5<br />
port. Well planned renewable energy will<br />
not only improve access to susta<strong>in</strong>able<br />
energy for all but will also reduce emissions<br />
and help protect biodiversity.<br />
Electric Sector Profile (2010 and 2011)<br />
Installed Capacity*<br />
Total generation<br />
Average Residential Electricity<br />
Price<br />
Electricity consumption/<br />
capita<br />
29.27 GW<br />
183,421 GWh<br />
US$0.065/kWh<br />
620 kWh<br />
Indonesia is an archipelago nation<br />
located <strong>in</strong> Southeast Asia, between the<br />
Indian and Pacific Oceans. It is second<br />
only to Brazil <strong>in</strong> terms of biodiversity and<br />
second to Australia <strong>in</strong> number of endemic<br />
species. Its tropical climate supports<br />
approximately 17 per cent of all species<br />
<strong>in</strong> the world <strong>with</strong> 515 mammal species,<br />
122 species of butterflies, 600 species of<br />
reptiles, 1,531 species of birds, 270 species<br />
of amphibians and 28,000 flower<strong>in</strong>g<br />
plants. 4 The majority of Indonesia is<br />
comprised of coastal lowlands, although<br />
several of the nation’s larger islands have<br />
However, <strong>in</strong> recent years the Indonesian<br />
government has shown that it is committed<br />
to chang<strong>in</strong>g these statistics. As a non-<br />
Annex 1 signatory of the Kyoto Protocol,<br />
Indonesia is not bound to adhere to the<br />
treaty’s regulations, but the government<br />
affirmed its commitment to reduc<strong>in</strong>g<br />
emissions at the 2009 G20 F<strong>in</strong>ance M<strong>in</strong>isters<br />
and Central Bank Governors Summit.<br />
6 The government has committed to<br />
reduce GHG emissions by 26 per cent<br />
below the bus<strong>in</strong>ess-as-usual scenario<br />
by 2020 and has <strong>in</strong>dicated a 41 per cent<br />
reduction target <strong>with</strong> <strong>in</strong>ternational sup-<br />
Average electricity consumption/capita<br />
<strong>in</strong> IEA<br />
countries (2009)<br />
Coal<br />
Oil<br />
Natural gas<br />
Hydro<br />
Geothermal<br />
9,200 kWh<br />
Electricity Generation Mix (2011)<br />
42 per cent<br />
32 per cent<br />
24 per cent<br />
8 per cent<br />
3 per cent<br />
* Only reflects 2011 PLN owned and rented<br />
capacity.<br />
11
<strong>Solar</strong> <strong>PV</strong> <strong>Atlas</strong><br />
Electricity sector<br />
Eighty-five per cent of electricity supply comes<br />
from coal, oil and natural gas powered plants.<br />
Off-grid capacity <strong>in</strong> 2010 was 6.4 GW, split evenly<br />
between renewable and non-renewable (diesel)<br />
sources. 7<br />
In 2011 Indonesia’s total <strong>in</strong>stalled capacity of<br />
electricity reached 37 GW, <strong>with</strong> approximately<br />
78 per cent of production com<strong>in</strong>g from PLN, the<br />
state-owned utility. 8 The unbundl<strong>in</strong>g of PLN’s<br />
assets began <strong>in</strong> 1995, and <strong>in</strong> 2009, the Electricity<br />
Law 30/2009 allowed for electricity supply<br />
and distribution to be licensed to privately owned<br />
Independent <strong>Power</strong> Producers (IPPs). However,<br />
PLN still has the “right of first priority” for any<br />
new production projects and still owns the current<br />
power grid.<br />
Indonesia is fac<strong>in</strong>g an electricity supply crisis<br />
<strong>with</strong> roll<strong>in</strong>g blackouts dur<strong>in</strong>g peak demand<br />
periods. Energy demand is expected to grow by<br />
9 per cent annually over the next decade, and<br />
by 2020 the government plans to have 90 per<br />
cent of households connected to the grid. 9 At the<br />
current rate, annual energy demand <strong>in</strong> 2050 is<br />
projected to reach 2.6 billion GWh. PLN is not<br />
expected to have the f<strong>in</strong>ancial means to meet the<br />
<strong>in</strong>creases <strong>in</strong> demand (PLN received US$4.9 bln<br />
<strong>in</strong> subsidies from the government <strong>in</strong> 2009), so<br />
<strong>in</strong>creased production will fall ma<strong>in</strong>ly on IPPs. 10<br />
Indonesia’s most recent energy policy was formalized<br />
<strong>in</strong> Energy Law 30/2007, but many of its<br />
provisions have yet to be concretely def<strong>in</strong>ed. The<br />
law calls for the formation of goals regard<strong>in</strong>g utilization<br />
and use of energy resources, security of<br />
supply, energy conservation and protection of the<br />
environment <strong>with</strong> regard to energy use, pric<strong>in</strong>g<br />
and <strong>in</strong>ternational cooperation. Additionally the<br />
law mandates the creation of a National Energy<br />
Council whose tasks <strong>in</strong>clude: draft<strong>in</strong>g a national<br />
energy policy, declar<strong>in</strong>g measures to resolve the<br />
current energy crisis and provid<strong>in</strong>g guidance<br />
and management on implementation of policies<br />
regard<strong>in</strong>g energy R&D and the <strong>in</strong>creas<strong>in</strong>g role of<br />
IPPs, which currently provide less than 5 per cent<br />
of Indonesia’s electricity. 11<br />
Currently about 15 per cent of on-grid capacity<br />
comes from renewable energy (RE) sources,<br />
ma<strong>in</strong>ly <strong>in</strong> the form of large-scale hydroelectric<br />
and geothermal facilities developed by PLN. Over<br />
the past five years, RE electricity generation <strong>in</strong><br />
Indonesia has <strong>in</strong>creased by more than 5 per cent<br />
annually. Recently private developers have entered<br />
the Indonesian market after a down period<br />
follow<strong>in</strong>g the Asian f<strong>in</strong>ancial crisis. 12<br />
The total technical potential for renewable capacity<br />
from hydropower, biomass, geothermal and<br />
m<strong>in</strong>i/micro hydro is estimated at 155 GW, which,<br />
assum<strong>in</strong>g the current overall capacity factor of 66<br />
per cent, could add around 900 TWh. By comparison,<br />
the electricity demand is expected to be<br />
around 600 TWh <strong>in</strong> 2025 (assum<strong>in</strong>g 9 per cent<br />
annual growth).<br />
Due to its location on the Pacific “R<strong>in</strong>g of Fire”<br />
Indonesia could <strong>in</strong>stall natural hydrothermal<br />
systems of about 27-31 GW. Enhanced Geothermal<br />
Systems (EGS) could <strong>in</strong>crease greatly this<br />
potential. <strong>WWF</strong>’s R<strong>in</strong>g of Fire programme seeks<br />
large-scale expansion of geothermal (i.e., 9.5 GW<br />
by 2025) <strong>in</strong> Indonesia through the creation of<br />
enabl<strong>in</strong>g policy frameworks and build<strong>in</strong>g local<br />
capacity. <strong>Solar</strong> resources are abundant, and solar<br />
energy could contribute significantly to the<br />
generation mix if fully utilised. 13<br />
As is expected, achiev<strong>in</strong>g the potential generation<br />
capacity faces several major obstacles. For example,<br />
of Indonesia’s nearly 76 GW of hydroelectric<br />
potential, 46 per cent is concentrated <strong>in</strong> the<br />
prov<strong>in</strong>ce of Papua, far from areas of demand and<br />
<strong>in</strong> the midst of vast mounta<strong>in</strong> ranges, ra<strong>in</strong>-forests<br />
and ecologically protected areas. 14 These factors<br />
INDONESIA<br />
12
INDONESIA<br />
would make development of generation facilities<br />
and transmission <strong>in</strong>frastructure particularly<br />
challeng<strong>in</strong>g.<br />
Enter<strong>in</strong>g the Indonesian RE market is not a<br />
simple endeavour, but the opportunity is worth<br />
consideration. There is clear political will<strong>in</strong>gness<br />
to promote this market. In its proposal to parliament,<br />
the National Energy Council set a target<br />
of hav<strong>in</strong>g 39.5 per cent of Indonesia’s electricity<br />
supply come from RE sources by 2050. 15 Vision<br />
25/25, an unofficial target <strong>in</strong> Indonesia’s latest<br />
draft on new energy policy, calls for 25 per cent<br />
of total energy produced <strong>in</strong> 2025 to come from<br />
renewable sources. Notably, PLN has called for<br />
at least 57 per cent of total green energy production<br />
capacity to be IPP provided by 2019. 16<br />
Due to its climate—both environmental and<br />
governmental—Indonesia appears to be a prime<br />
area for <strong>in</strong>vestment <strong>in</strong> RE production systems.<br />
RE Source Installed capacity (2010)<br />
Hydroelectric 2.3 GW<br />
Geothermal<br />
600 MW<br />
Biomass<br />
500 MW<br />
W<strong>in</strong>d<br />
30 MW<br />
<strong>Solar</strong><br />
17 MW<br />
The government’s commitment to improv<strong>in</strong>g<br />
electricity quality and access for its people,<br />
particularly by <strong>in</strong>vit<strong>in</strong>g IPPs <strong>in</strong>to the market, will<br />
provide significant opportunities for RE growth.<br />
There are several major issues to overcome, <strong>in</strong>clud<strong>in</strong>g<br />
the highly <strong>in</strong>efficient and unreliable grid<br />
currently <strong>in</strong> place and the viability of deliver<strong>in</strong>g<br />
RE generated <strong>in</strong> remote areas to consumers, but<br />
they can largely be mitigated by the implementation<br />
of solar, not only throughout rural Indonesia,<br />
but also <strong>in</strong> high-population areas.<br />
<strong>Solar</strong> <strong>PV</strong><br />
<strong>Solar</strong> energy has a significant and unique potential<br />
<strong>in</strong> Indonesia. It is well suited to both largeand<br />
small-scale production, which is favoured<br />
by the Indonesian government and PLN as it can<br />
easily be <strong>in</strong>stalled <strong>in</strong> remote villages. The effect<br />
of this is two-fold. Many of these remote villages<br />
currently rely on diesel generators for electricity<br />
so replac<strong>in</strong>g them <strong>with</strong> solar systems would<br />
significantly reduce GHG emissions and could<br />
save the logistical difficulty of add<strong>in</strong>g such remote<br />
areas to the power grid. It is often the most<br />
economical option as well.<br />
In Indonesia’s densely populated cities, where<br />
roll<strong>in</strong>g blackouts generally last several hours<br />
each day, a similar approach could reduce the<br />
stra<strong>in</strong> on the current grid and elim<strong>in</strong>ate blackouts.<br />
With an efficient deployment process and<br />
upgrades to the grid, solar power could significantly<br />
contribute to electricity production <strong>in</strong><br />
Indonesia. The Indonesian government appears<br />
to realize this; <strong>in</strong> 2009, Indonesia distributed<br />
77,433 <strong>PV</strong> solar home systems of 50 W peak<br />
modules to <strong>in</strong>dividual households, and n<strong>in</strong>e<br />
<strong>PV</strong> array systems of 150 kW peak each to communities<br />
<strong>in</strong> rural and remote areas throughout<br />
Indonesia. Similar numbers were distributed <strong>in</strong><br />
2008. 17 Susta<strong>in</strong>ability of these programs is questionable,<br />
as on-go<strong>in</strong>g service is often neglected.<br />
The conditions for solar <strong>PV</strong> are excellent across<br />
the Indonesian islands <strong>with</strong> mounta<strong>in</strong>ous regions<br />
receiv<strong>in</strong>g some of the best sun <strong>in</strong> the<br />
country. The country’s annual average <strong>in</strong>solation<br />
is 5.2 kWh/m2/day.<br />
A total of just 725 square kilometres of solar<br />
panels would generate enough electricity to meet<br />
Indonesia’s total current electricity generation.<br />
Because population and per capita electricity<br />
consumption are expected to rise <strong>in</strong> the com-<br />
13
<strong>Solar</strong> <strong>PV</strong> <strong>Atlas</strong><br />
POPULATION DENSITY<br />
Land required for <strong>PV</strong> to meet 100<br />
per cent of electricity production<br />
In the year 2010<br />
In the year 2050<br />
INDONESIA<br />
<strong>in</strong>g years, 4,900 square kilometres of<br />
land dedicated to solar production would<br />
be required to meet 100 per cent of the<br />
country’s total electricity needs <strong>in</strong> 2050.<br />
Concentrated <strong>in</strong>to one location, this land<br />
would represent a square of about 70<br />
kilometres on each side. The solar map<br />
shows the area of land needed for 2010<br />
generation (red square) as well as land<br />
use needed to meet electricity demand <strong>in</strong><br />
2050 (blue square). In other words, even<br />
based on very conservative estimates, less<br />
than one third of one per cent (0.27 per<br />
cent) of Indonesia’s land would need to<br />
host solar <strong>PV</strong> generation <strong>in</strong> order to meet<br />
100 per cent of the country’s projected<br />
electricity needs <strong>in</strong> 2050. This projection<br />
assumes that those liv<strong>in</strong>g <strong>in</strong> Indonesia are<br />
consum<strong>in</strong>g the projected global average<br />
amount of electricity for 2050, which is<br />
more than 6.5 times current per capita<br />
consumption.<br />
Protected Areas<br />
Population Density > 100/km 2<br />
Population Density > 1000/km 2<br />
SOLAR RESOURCE<br />
Land required for <strong>PV</strong> to meet 100<br />
per cent of electricity production<br />
In the year 2010<br />
725 km 2<br />
In the year 2050<br />
725 km 2<br />
4897 km 2<br />
4897 km 2<br />
2 4 6 8<br />
kWh / m 2 / day<br />
2 4 6 8<br />
kWh / m 2 / day<br />
14
15<br />
Sunset <strong>in</strong> Madagascar © Mart<strong>in</strong> Harvey / <strong>WWF</strong>-Canon
<strong>Solar</strong> <strong>PV</strong> <strong>Atlas</strong><br />
<strong>Solar</strong> <strong>PV</strong> <strong>Atlas</strong>: MADAGASCAR<br />
Less than one-fifth of one<br />
per cent (0.13 per cent)<br />
of Madagascar’s land<br />
would need to host solar<br />
<strong>PV</strong> generation <strong>in</strong> order<br />
to meet 100 per cent of<br />
the country’s projected<br />
electricity needs <strong>in</strong> 2050.<br />
The Republic of Madagascar is home<br />
to approximately 22.6 million people<br />
(2012). 1 In 2009, the country’s per<br />
capita GDP was US$438. 2 Most of the<br />
population has no access to electricity<br />
and cooks <strong>with</strong> biomass fuels.<br />
Madagascar’s electricity sector is relatively<br />
limited. Eighty per cent of Madagascans<br />
lack access to electricity, 3 and<br />
rural dwellers are particularly worse<br />
off <strong>with</strong> 93 per cent lack<strong>in</strong>g access to<br />
electricity. Without access to electricity,<br />
Madagascans use kerosene and batterybased<br />
devices for light<strong>in</strong>g and electricity.<br />
Though effective stop-gaps, these<br />
solutions have significant health and<br />
environmental costs associated <strong>with</strong> <strong>in</strong>door<br />
combustion and the disposal of the<br />
batteries. Traditional biomass for cook<strong>in</strong>g<br />
is putt<strong>in</strong>g a heavy burden on people<br />
and the environment. Eighty per cent of<br />
wood consumption is for firewood and<br />
charcoal, represent<strong>in</strong>g 18 million cubic<br />
metres annually, a large share of which<br />
is harvested at unsusta<strong>in</strong>able levels. 4<br />
The country is highly dependent on expensive<br />
oil imports for transport and for<br />
a large share of its electricity. In 2010<br />
imports of petroleum products grew to<br />
US$472 million. 5 In response to ris<strong>in</strong>g<br />
global oil prices, the government and<br />
the Norwegian Petroleum Directorate<br />
(NPD) agreed to develop the country’s<br />
energy production sector. Though NPD<br />
suspended its work <strong>in</strong> 2009 due to political<br />
<strong>in</strong>stability, plans for oil and unconventional<br />
oil exploration cont<strong>in</strong>ue.<br />
The dependency on pollut<strong>in</strong>g energy<br />
sources is socially and economically<br />
problematic, and it threatens one of<br />
Madagascar’s major assets: biodiversity.<br />
Split from the African cont<strong>in</strong>ent<br />
more than 160 million years ago, the<br />
island developed its own dist<strong>in</strong>ct ecosystems<br />
and extraord<strong>in</strong>ary wildlife. Approximately<br />
92 per cent of Madagascar’s<br />
reptiles, 68 per cent of its plant life and<br />
98 per cent of its land mammals, <strong>in</strong>clud<strong>in</strong>g<br />
lemurs, exist naturally nowhere<br />
else on Earth. The world’s fourth-largest<br />
island, cover<strong>in</strong>g more than 144 million<br />
acres, Madagascar is comprised of<br />
lush lowland ra<strong>in</strong>forests and mounta<strong>in</strong>s<br />
along the eastern coast, dry forests <strong>in</strong><br />
the west, volcanic mounta<strong>in</strong>s <strong>in</strong> the<br />
north and the Sp<strong>in</strong>y Forest <strong>in</strong> the south.<br />
The climate is tropical along the coast,<br />
temperate <strong>in</strong>land, and arid <strong>in</strong> the south,<br />
support<strong>in</strong>g a great range of biodiversity.<br />
Susta<strong>in</strong>able renewable energy and energy<br />
efficiency can contribute, as part of a<br />
broad set of measures, to both promote<br />
Malagasy socioeconomic development<br />
and reduce the energy sector’s environmental<br />
footpr<strong>in</strong>t. RE can reduce Madagascar’s<br />
costly dependence on imported<br />
oil, kerosene, disposable batteries, and<br />
traditional biomass while develop<strong>in</strong>g<br />
remote off-grid or m<strong>in</strong>i-grid electricity<br />
access.<br />
Recent government pledges for Susta<strong>in</strong>able<br />
Energy for All have yet to play out<br />
but fit a clear need.<br />
MADAGASCAR<br />
16
Electricity sector<br />
There are currently 115 small and midsized<br />
power plants operat<strong>in</strong>g <strong>in</strong> Madagas-<br />
produced from hydropower. 8 There are<br />
Renewable electricity is currently ma<strong>in</strong>ly<br />
car <strong>with</strong> a total capacity of 406 MW 6 and a few isolated and relatively small w<strong>in</strong>d<br />
annual output of 1.2 million MWh. Twentyone<br />
of these plants are part of the only two there is significant additional renewable<br />
and solar projects on the island. However,<br />
<strong>in</strong>terconnected grids (IG): Antananarivo energy potential. Presently, Madagascar is<br />
IG and Fianarantsoa IG. <strong>Power</strong> plants us<strong>in</strong>g only 1.3 per cent of its estimated 7.8<br />
are heavily dependent on two sources of GW potential. 9 Particulary <strong>in</strong> the north and<br />
energy: hydropower (60 per cent) and south, several locations show very good<br />
thermal power runn<strong>in</strong>g on imported diesel w<strong>in</strong>d conditions <strong>with</strong> average speeds over<br />
and heavy fuel oil (40 per cent). Despite 6 m/s. There is huge potential for solar<br />
large structural subsidies, the average price energy as well.<br />
of electricity to the consumer is US$0.20/<br />
kWh. At these rates, RE, whether gridconnected<br />
or not, can become a strong and this vast renewable energy potential, such<br />
There is currently some support to exploit<br />
cost-effective alternative to the status quo. as the rural electrification fund from the<br />
rural Electrification Agency (ADER). These<br />
Between 2004 and 2009 demand grew at projects, however, face significant barriers<br />
an annual average rate of 7 per cent. The such as relatively more expensive <strong>in</strong>itial<br />
Madagascar Action Plan (2006), prior to <strong>in</strong>vestments than those required by comparable<br />
thermal plants, non-systematic<br />
its suspension, planned the construction<br />
of three new large thermal plants us<strong>in</strong>g oil f<strong>in</strong>ancial support for renewable energy<br />
and the development of a new hydropower projects, unfair competition <strong>with</strong> subsidized<br />
fossil fuel based electricity, high<br />
plant. Beyond hydropower, the Action Plan<br />
aimed to <strong>in</strong>crease the use of other renewable<br />
sources of energy (solar, w<strong>in</strong>d, biofuel) develop<strong>in</strong>g scaled <strong>in</strong>vestments.<br />
dependency on foreign aid, and hurdles to<br />
from 0 per cent <strong>in</strong> 2006 to 3 per cent <strong>in</strong><br />
2012. 7<br />
Electric Sector Profile<br />
Installed Capacity (2009) 410 MW<br />
Total net generation (2009)<br />
1,350<br />
GWh<br />
Average residential<br />
Electricity Price (2011)<br />
Electricity consumption/<br />
capita (2008)<br />
Average electricity consumption/capita<br />
<strong>in</strong> IEA<br />
countries (2009)<br />
US$0.20/<br />
kWh<br />
45 kWh<br />
9,200 kWh<br />
Electricity Sources (2010)<br />
60 per<br />
Hydropower production<br />
cent<br />
Thermal power production<br />
produced us<strong>in</strong>g:<br />
Gas oil<br />
Fuel oil<br />
40 per<br />
cent<br />
(16.5 per<br />
cent)<br />
(23.5 per<br />
cent)<br />
RE Source Installed Capacity (2008)<br />
Hydro<br />
124 MW<br />
W<strong>in</strong>d<br />
nom<strong>in</strong>al<br />
<strong>Solar</strong><br />
nom<strong>in</strong>al<br />
MADAGASCAR<br />
17
<strong>Solar</strong> <strong>PV</strong> <strong>Atlas</strong><br />
<strong>Solar</strong> <strong>PV</strong><br />
POPULATION DENSITY<br />
SOLAR RESOURCE<br />
As can be seen on the solar map, the<br />
conditions for solar <strong>PV</strong> are excellent<br />
across the island. The prevail<strong>in</strong>g<br />
trade w<strong>in</strong>ds that come from the east<br />
result <strong>in</strong> a small reduction <strong>in</strong> solar<br />
irradiance on the w<strong>in</strong>dward side of<br />
Madagascar. Overall however, the<br />
solar resource <strong>in</strong> Madagascar is very<br />
strong, <strong>with</strong> over two-thirds of the<br />
island hav<strong>in</strong>g an annual average <strong>in</strong>solation<br />
greater than 6 kWh/m 2 /day.<br />
Even on the ra<strong>in</strong>y side of Madagascar<br />
annual <strong>in</strong>solation is greater than 5<br />
kWh/m 2 /day.<br />
Four and a half square kilometres of<br />
solar panels would generate enough<br />
electricity to meet Madagascar’s<br />
total current electricity generation.<br />
Because population and per capita<br />
electricity consumption are expected<br />
to rise <strong>in</strong> the com<strong>in</strong>g decades, 780<br />
square kilometres of land dedicated<br />
to solar production would be<br />
required to meet to meet 100 per<br />
cent of Madagascar’s total electricity<br />
needs <strong>in</strong> 2050. Concentrated <strong>in</strong>to<br />
one location, this land would repre-<br />
Land required for<br />
<strong>PV</strong> to meet 100 per<br />
cent of electricity<br />
production<br />
In the year 2010<br />
In the year 2050<br />
Protected Areas<br />
Population<br />
Density > 100/km 2<br />
Population<br />
Density > 1000/km 2<br />
2 4 6 8<br />
kWh / m 2 / day<br />
18<br />
MADAGASCAR<br />
Land required for<br />
<strong>PV</strong> to meet 100 per<br />
cent of electricity<br />
production<br />
In the year 2010<br />
In the year 2050
sent a square of about 28 kilometres<br />
on each side. The solar map shows<br />
land needed for 2010 generation (red<br />
square) as well as land use needed<br />
to meet electricity demand <strong>in</strong> 2050<br />
(blue square). In other words, even<br />
based on very conservative estimates,<br />
less than one-fifth of one per cent<br />
(0.13 per cent) of Madagascar’s land<br />
would need to host solar <strong>PV</strong> generation<br />
<strong>in</strong> order to meet 100 per cent<br />
of the country’s projected electricity<br />
needs <strong>in</strong> 2050. This projection assumes<br />
that those liv<strong>in</strong>g <strong>in</strong> Madagascar<br />
are consum<strong>in</strong>g the projected global<br />
average amount of electricity for<br />
2050, which is more than 60 times<br />
current per capita consumption.<br />
around the capital, Antananarivo and<br />
southward; the port cities of Mahajanga<br />
on the northwest coast and<br />
Toamas<strong>in</strong>a on the east coast also have<br />
appreciable population densities,<br />
which make them good targets for<br />
larger-scale <strong>PV</strong> <strong>in</strong>stallations.<br />
MADAGASCAR<br />
© First <strong>Solar</strong>. Ground mounted <strong>PV</strong> can provide distributed off- or on-grid electricity.<br />
Madagascar’s population is predom<strong>in</strong>antly<br />
rural, <strong>with</strong> only 30 per cent of<br />
the population estimated to live <strong>in</strong><br />
“urban” areas accord<strong>in</strong>g to the UN<br />
Environment Programme. This is<br />
very encourag<strong>in</strong>g for the development<br />
of more distributed community scale<br />
solar projects. As can be seen on the<br />
basemap, the densest populations are<br />
19
<strong>Solar</strong> <strong>PV</strong> <strong>Atlas</strong><br />
<strong>Solar</strong> <strong>PV</strong> <strong>Atlas</strong>: MADHYA PRADESH, INDIA<br />
Less than one per cent<br />
(0.75 per cent) of MP’s<br />
land would need to host<br />
solar <strong>PV</strong> generation <strong>in</strong><br />
order to meet 100 per<br />
cent of the state’s projected<br />
electricity needs<br />
<strong>in</strong> 2050.<br />
Situated <strong>in</strong> the middle of India, Madhya<br />
Pradesh is the second-largest Indian<br />
state by size. The state is home to more<br />
than 72.5 million people, over threequarters<br />
of whom live <strong>in</strong> rural areas. 1 In<br />
2011 Madhya Pradesh was responsible<br />
for 3.29 per cent of India’s GDP, or<br />
US$52.3 billion. Inhabitants earned an<br />
average annual <strong>in</strong>come of 27,250 rupees<br />
or about US$528. 2 Though 96.4 per cent<br />
of villages <strong>in</strong> Madhya Pradesh were considered<br />
electrified <strong>in</strong> 2009, the def<strong>in</strong>ition<br />
of an electrified village allows for up to<br />
90 per cent of the households to lack access<br />
to electricity. 3<br />
Spann<strong>in</strong>g what is considered a “genetic<br />
highway” between the western coast’s<br />
Ghat Mounta<strong>in</strong>s and the northeast,<br />
Madhya Pradesh features two mounta<strong>in</strong><br />
ranges of its own and some of India’s<br />
richest biodiversity. The state has approximately<br />
5,000 plant species of which<br />
625 are medic<strong>in</strong>al flora. Tigers and other<br />
endangered megafauna coexist <strong>with</strong><br />
more than 500 bird species and 180 fish<br />
species. With four major forest types,<br />
n<strong>in</strong>e national parks and 25 wildlife sanctuaries,<br />
the Tiger State is a pioneer state<br />
<strong>in</strong> the national movement for conservation.<br />
The national parks and sanctuaries<br />
constitute 11.4 per cent of the total forest<br />
area and 3.52 per cent of the geographical<br />
area of the state. 4<br />
State and national governments, as well<br />
as aid agencies, are <strong>in</strong>vest<strong>in</strong>g <strong>in</strong> grid extension<br />
and <strong>in</strong>creased generation, much<br />
of which is planned as coal. <strong>Solar</strong> <strong>PV</strong><br />
generation offers a more susta<strong>in</strong>able and<br />
ultimately more affordable option for<br />
these power expansion plans.<br />
Installed<br />
Capacity (2011)<br />
Electric Sector Profile 5<br />
Total Generation<br />
(Apr. 2011-<br />
Mar. 2012)<br />
Avg. Consumer<br />
Price of<br />
Electricity (2009) 6<br />
Electricity<br />
Consumption/<br />
capita (2009-10) 7<br />
Average electricity<br />
consumption/<br />
capita <strong>in</strong> IEA<br />
countries (2009)<br />
8.38 GW<br />
49412.5 GWh<br />
US$0.087/kWh*<br />
602.07 kWh<br />
9,200 kWh<br />
Electricity Generation by Source<br />
Coal (2011-12)<br />
Hydro-electric<br />
(2011-12)<br />
Other<br />
84 per cent<br />
10 per cent<br />
6 per cent<br />
*US$1=56.235 INR, May 30, 2012<br />
MADHYA PRADESH<br />
20
Electricity Sector<br />
RE<br />
Source<br />
Biomass<br />
W<strong>in</strong>d<br />
<strong>Solar</strong><br />
Installed<br />
capacity<br />
(2010)<br />
32 MW<br />
210 MW<br />
2 MW<br />
In 2011, Madhya Pradesh had a total<br />
<strong>in</strong>stalled capacity of 8.4 GW. The state<br />
government manages and operates 4.5<br />
GW, the central government 3.6 GW,<br />
while only 240 MW is owned by private<br />
producers, most of which is <strong>in</strong> the renewable<br />
sector. In the future, the fuel-mix<br />
ratio is most likely to change and become<br />
even more coal heavy as many new coalbased<br />
thermal plants have been planned<br />
and there is an unlikely commensurate<br />
<strong>in</strong>crease <strong>in</strong> hydro capacity. 8 The government<br />
of Madhya Pradesh has launched<br />
prelim<strong>in</strong>ary legal documents for projects<br />
total<strong>in</strong>g about 55 GW of new capacity. Of<br />
this, work has begun on 3 GW. About 35<br />
per cent of the total potential hydropower<br />
(large and medium) assessed at 2.8<br />
GW is yet to be tapped while most of the<br />
small and micro-power is still <strong>in</strong> exploratory<br />
stages.<br />
There is scant data on actual households<br />
<strong>with</strong> access to electricity, but rates<br />
rema<strong>in</strong> low. Intensive ongo<strong>in</strong>g efforts<br />
cont<strong>in</strong>ue to improve access to the grid<br />
under the national Rajiv Gandhi Gram<strong>in</strong><br />
Vidyutikaran Yojna (RGGVY) rural<br />
electrification plan. The RGGVY does<br />
not work on three-phase power, however,<br />
so large agricultural pump<strong>in</strong>g is not<br />
supported. Also, due to location and/or<br />
density, 401 villages <strong>in</strong> Madhya Pradesh<br />
are not covered by the RGGVY.<br />
The government of Madhya Pradesh has<br />
been promot<strong>in</strong>g the development of RE<br />
plants, <strong>in</strong>clud<strong>in</strong>g w<strong>in</strong>d, through various<br />
policy <strong>in</strong>itiatives and <strong>in</strong>centives for<br />
developers. It has also issued an Incentive<br />
Policy for encourag<strong>in</strong>g generation of<br />
power <strong>in</strong> Madhya Pradesh through Nonconventional<br />
Energy Sources (2006). In<br />
2010, Madhya Pradesh had an <strong>in</strong>stalled<br />
capacity of about 210 MW of w<strong>in</strong>d power,<br />
about 32 MW of biomass based power<br />
and about 2 MW of solar power. As the<br />
assessed potential is significantly higher<br />
(w<strong>in</strong>d – about 800 MW, solar – about<br />
1.0 GW and biomass – about 250 MW),<br />
there are plans to expand the renewable<br />
power generation capacity <strong>in</strong> the state. 9<br />
This is be<strong>in</strong>g done through the Madhya<br />
Pradesh Urja Vikas Nigam (MPUVN), a<br />
government agency created to promote<br />
renewable energy <strong>in</strong> the state. MPUVN<br />
has also <strong>in</strong>itiated work on promot<strong>in</strong>g<br />
energy-efficiency <strong>in</strong> the state and has<br />
estimated an energy-sav<strong>in</strong>g potential of<br />
500 MW. There are various demand-side<br />
<strong>in</strong>itiatives under way and also <strong>in</strong>itiatives<br />
<strong>in</strong> <strong>in</strong>dustry clusters. 10<br />
To promote renewable energy, the Madhya<br />
Pradesh state Electricity Regulatory<br />
Commission (MPERC) has set a target<br />
of Renewable Purchase Obligations for<br />
distribution licensees at 6 per cent for<br />
w<strong>in</strong>d, 2 per cent for biomass and 2 per<br />
cent for cogeneration and other sources.<br />
Together this will ensure that 10 per cent<br />
of the electricity production <strong>in</strong> Madhya<br />
Pradesh comes from renewable resources<br />
between 2011 and 2013. 11<br />
W<strong>in</strong>d power has made progress <strong>in</strong> the<br />
region, bolstered by the 2006 Incentive<br />
Policy. A total of 20 w<strong>in</strong>d power projects<br />
have been <strong>in</strong>stalled so far. Biogas too has<br />
been the focus of much recent activity.<br />
Under the National Biogas and Manure<br />
Management Programme, about 20,000<br />
biogas plants have been <strong>in</strong>stalled. The<br />
annual target for 2010 was 2,000 plants,<br />
550 of which were <strong>in</strong>stalled by August.<br />
MADHYA PRADESH<br />
21
<strong>Solar</strong> <strong>PV</strong> <strong>Atlas</strong><br />
<strong>Solar</strong> <strong>PV</strong><br />
In 2010, Madhya Pradesh launched a<br />
<strong>Solar</strong> Energy Policy through which the<br />
state <strong>in</strong>tends to <strong>in</strong>crease solar energy<br />
production, enhance energy security,<br />
promote efficient and cost-effective solar<br />
<strong>in</strong>stallations through fiscal and non-fiscal<br />
<strong>in</strong>centives, promote local manufactur<strong>in</strong>g<br />
and develop local capabilities. The<br />
policy targets up to 500 MW of new solar<br />
<strong>in</strong>stallations. Apart from this, under the<br />
central government plan - Jawaharlal<br />
Nehru National <strong>Solar</strong> Mission (JNNSM)<br />
- three 100 MW projects have been<br />
registered <strong>in</strong> Madhya Pradesh and 17<br />
more are planned, <strong>with</strong> 270 MW of new<br />
capacity.<br />
Most areas <strong>in</strong> Madhya Pradesh receive<br />
sunlight for about 300 days <strong>in</strong> a year,<br />
and as can be seen on the solar map,<br />
the conditions for solar <strong>PV</strong> are excellent<br />
across the state. Though the climate and<br />
weather patterns are strongly <strong>in</strong>fluenced<br />
by the monsoon cycles, the very good<br />
solar irradiance overall makes <strong>PV</strong> an<br />
attractive generation option. Overall,<br />
average annual <strong>in</strong>solation for the state is<br />
just below 5 kWh/m 2 /day.<br />
POPULATION DENSITY<br />
SOLAR RESOURCE<br />
Protected Areas<br />
Population<br />
Density > 100/km 2<br />
Population<br />
Density > 1000/km 2<br />
Land required for <strong>PV</strong><br />
to meet 100 per cent of<br />
electricity production<br />
In the year 2010<br />
In the year 2050<br />
Land required for <strong>PV</strong><br />
to meet 100 per cent of<br />
electricity production<br />
In the year 2010<br />
In the year 2050<br />
2 4 6 8<br />
kWh / m 2 / day<br />
MADHYA PRADESH<br />
22
© R.Isotti, A.Cambone - Homo Ambiens / <strong>WWF</strong>-Canon<br />
Two hundred ten (210) square kilometres<br />
of solar panels would generate<br />
enough electricity to meet Madhya<br />
Pradesh’s total current electricity<br />
generation. Because both population<br />
and per capita electricity consumption<br />
are expected to rise <strong>in</strong> the com<strong>in</strong>g decades,<br />
2,320 square kilometres of land<br />
dedicated to solar production would be<br />
required to meet 100 per cent of Madhya<br />
Pradesh’s total electricity needs <strong>in</strong><br />
2050. Concentrated <strong>in</strong>to one location,<br />
this land would represent a square of<br />
about 48 kilometres on each side. The<br />
solar map shows land needed for 2010<br />
generation (red square) as well as land<br />
use needed to meet electricity demand<br />
<strong>in</strong> 2050 (blue square). In other words,<br />
even based on very conservative estimates,<br />
less than one per cent (0.75 per<br />
cent) of Madhya Pradesh’s land would<br />
need to host solar <strong>PV</strong> generation <strong>in</strong><br />
order to meet 100 per cent of the state’s<br />
projected electricity needs <strong>in</strong> 2050.<br />
This projection assumes that those liv<strong>in</strong>g<br />
<strong>in</strong> Madhya Pradesh are consum<strong>in</strong>g<br />
the global average amount of electricity,<br />
which is more than five times current<br />
per capita consumption.<br />
Madhya Pradesh’s population is predom<strong>in</strong>antly<br />
rural, <strong>with</strong> only 25 per<br />
cent of the population estimated to<br />
live <strong>in</strong> “urban” areas. This is generally<br />
very encourag<strong>in</strong>g for the development<br />
of distributed household-level solar<br />
<strong>in</strong>stallations. However, as can be seen<br />
on the basemap, almost the entire state<br />
has a population density greater than<br />
100 people/km 2 which po<strong>in</strong>ts to the<br />
complimentary value of community<br />
microgrids and larger-scale <strong>PV</strong> <strong>in</strong>stallations.<br />
The microgrids can aggregate<br />
demand where densities of households<br />
make this economic, and the largerscale<br />
<strong>PV</strong> <strong>in</strong>stallations can serve these<br />
aggregated loads along <strong>with</strong> irrigation<br />
and commercial needs.<br />
MADHYA PRADESH<br />
23
<strong>Solar</strong> <strong>PV</strong> <strong>Atlas</strong><br />
MADHYA PRADESH<br />
© Jean-Philippe Denruyter / Women assemble solar components at the Barefoot College <strong>in</strong> India. Local employment across the value cha<strong>in</strong> is a benefit of solar <strong>PV</strong> development.<br />
24
<strong>Solar</strong> <strong>PV</strong> <strong>Atlas</strong>: MEXICO<br />
Just over one-tenth of<br />
one per cent (0.11 per<br />
cent) of Mexico’s land<br />
would need to host solar<br />
<strong>PV</strong> generation <strong>in</strong> order<br />
to meet 100 per cent of<br />
the country’s projected<br />
electricity needs <strong>in</strong> 2050.<br />
The federal republic of Mexico has a<br />
population of approximately 113.7 million<br />
people, 1 47 per cent of whom live <strong>in</strong> poverty.<br />
2 In 2010, the GDP per capita was<br />
US$13,900. 3 N<strong>in</strong>ety-n<strong>in</strong>e per cent of the<br />
<strong>in</strong>habitants have access to electricity.<br />
In energy, natural gas and fuel oil dom<strong>in</strong>ate<br />
the country’s electricity generation<br />
mix. Mexico is one of the world’s largest<br />
crude oil exporters, but it is a net importer<br />
of ref<strong>in</strong>ed petroleum products.<br />
S<strong>in</strong>ce 2005, Mexico’s energy demand<br />
has grown faster than GDP, yet there<br />
has been a steep decl<strong>in</strong>e <strong>in</strong> domestic fuel<br />
production. Mexican oil consumption<br />
is still highly subsidized, <strong>with</strong> subsidies<br />
for gasol<strong>in</strong>e and diesel — for transporation<br />
and electricity — total<strong>in</strong>g more than<br />
US$22 billion per year. 4 The Mexican<br />
government recognizes the toll this is<br />
tak<strong>in</strong>g on its environment, fiscal health<br />
and national security, and has developed<br />
a number of policy frameworks aimed at<br />
improv<strong>in</strong>g energy security, strengthen<strong>in</strong>g<br />
energy production, and contribut<strong>in</strong>g<br />
to greenhouse gas emissions mitigation. 5<br />
All of these policies have some elements<br />
to encourage renewable energy and<br />
energy efficiency and to protect Mexico’s<br />
natural environment. 6<br />
Divid<strong>in</strong>g the Pacific Ocean from the Gulf<br />
of Mexico and serv<strong>in</strong>g as a land bridge<br />
between North and South America,<br />
Mexico is <strong>in</strong> the top five countries <strong>in</strong> the<br />
world <strong>in</strong> terms of animal diversity, <strong>with</strong><br />
200,000 different species — ten to twelve<br />
per cent of all species worldwide. With<br />
subtropical, alp<strong>in</strong>e, and desert climates,<br />
Mexico is a hotspot for ecological richness<br />
and fragility <strong>with</strong> a very high concentration<br />
of endemic species.<br />
MEXICO<br />
25
<strong>Solar</strong> <strong>PV</strong> <strong>Atlas</strong><br />
Electricity sector<br />
S<strong>in</strong>ce the 1990s the Mexican government<br />
has allowed the privatization of power<br />
plants, but the electricity market is still<br />
limited for private power producers. The<br />
state-run electric utility (CFE) creates barriers<br />
to entry for private producers <strong>in</strong> order<br />
to control most of the country’s electricity<br />
generation and transmission. Just over<br />
12 GW of <strong>in</strong>stalled capacity belongs to 22<br />
private companies, the rest to CFE. 7 Electricity<br />
is a grow<strong>in</strong>g market <strong>in</strong> Mexico, <strong>with</strong><br />
the M<strong>in</strong>istry of Energy predict<strong>in</strong>g demand<br />
growth of 3.3 per cent per year for the next<br />
10 years.<br />
Mexico’s electricity mix relies heavily on<br />
fossil fuels. Natural gas is the dom<strong>in</strong>ant<br />
source of electricity generation, and heavy<br />
fuel oil and coal also have a large share.<br />
Hydropower and a small amount of nuclear<br />
power complete the mix. Though hydropower<br />
and geothermal development seem<br />
stagnant, other RE generation is undergo<strong>in</strong>g<br />
modest growth. There is huge growth<br />
potential for RE, and Mexican policies are<br />
seek<strong>in</strong>g to tap at least part of this potential.<br />
In 2008 a special programme for renewable<br />
energies was established by the Mexican<br />
government and the Mexican Congress<br />
approved a set of energy-related laws and<br />
reforms. The programme sets three ma<strong>in</strong><br />
goals for renewable energy to be achieved<br />
by 2012: (1) more than double the <strong>in</strong>stalled<br />
capacity of renewable energy sources, from<br />
3.3 per cent to 7.6 per cent of total <strong>in</strong>stalled<br />
capacity; (2) <strong>in</strong>crease renewable energy<br />
generation from 3.9 per cent to 6.6 per<br />
cent; and (3) use renewable energy to electrify<br />
2,500 off-grid communities. Yet, this<br />
programme seemed to be less than a firm<br />
commitment for renewable energy expansion,<br />
s<strong>in</strong>ce no comprehensive implementation<br />
and f<strong>in</strong>ancial schemes have been put <strong>in</strong><br />
place.<br />
The National Energy Strategy (ENE) was<br />
created <strong>in</strong> 2010 as a legal framework for<br />
achiev<strong>in</strong>g the energy sector’s ma<strong>in</strong> objectives<br />
— security, efficiency and susta<strong>in</strong>ability<br />
— over a 15-year time horizon.<br />
Subsequent ENEs have been created but<br />
not ratified, so the 2010 strategy rema<strong>in</strong>s<br />
<strong>in</strong> effect. That ENE called for 35 per cent of<br />
electricity generation capacity to be from<br />
nuclear energy and RE <strong>in</strong>clud<strong>in</strong>g large<br />
hydro by 2024. It also set the <strong>in</strong>terim goal<br />
of 7.6 per cent of <strong>in</strong>stalled capacity for RE<br />
exclud<strong>in</strong>g large hydropower plants.<br />
Currently, w<strong>in</strong>d energy is the only RE<br />
technology grow<strong>in</strong>g rapidly <strong>in</strong> Mexico. An<br />
energy transition to diversified RE and less<br />
dependence on fossil fuels is not yet happen<strong>in</strong>g.<br />
Because of ambiguities <strong>in</strong> federal<br />
law, the state-run electric utility (CFE) –<br />
which controls the majority of the electricity<br />
sector <strong>in</strong> Mexico and is one of the most<br />
important players for the development of<br />
renewable energies – is constra<strong>in</strong>ed. The<br />
law states that power production by CFE<br />
must be selected at the lowest cost, tak<strong>in</strong>g<br />
<strong>in</strong>to consideration environmental externalities<br />
for each technology, and it must offer<br />
optimum stability, quality and safety of the<br />
public service. Although the law takes <strong>in</strong>to<br />
account the valuation of externalities, there<br />
is no approved methodology to quantify<br />
these externalities. As a result, externalities<br />
are generally not considered, and traditional<br />
fossil fuel projects cont<strong>in</strong>ue to move<br />
foreward.<br />
MEXICO<br />
26
Electric Sector Profile<br />
Installed Capacity (2011) 8<br />
Total net generation (2010)<br />
Average Residential<br />
Electricity Price (2010)<br />
Electricity consumption<br />
per capita (2009)<br />
Average electricity consumption/capita<br />
<strong>in</strong> IEA<br />
countries (2009)<br />
51.177 GW<br />
238,308 GWh<br />
US$0.10/kWh<br />
1,943 kWh<br />
9,200 kWh<br />
Nevertheless, <strong>in</strong> 2012, Mexico passed<br />
landmark legislation capp<strong>in</strong>g green<br />
house gas emissions. With a programme<br />
established <strong>in</strong> 2008 to promote renewable<br />
energy development and the new<br />
climate law, Mexico’s renewable energy<br />
marketplace is poised for expansion.<br />
Electricity Generation Mix (2011)<br />
Gas<br />
Heavy Fuel Oil<br />
Hydro (all sizes)<br />
Coal<br />
Nuclear<br />
Geothermal/W<strong>in</strong>d<br />
Diesel<br />
42.6 per cent<br />
21.6 per cent<br />
13.5 per cent<br />
14 per cent<br />
4.8 per cent<br />
3 per cent<br />
0.5 per cent<br />
RE Source<br />
M<strong>in</strong>i Hydro<br />
Geothermal<br />
Biomass<br />
W<strong>in</strong>d<br />
<strong>Solar</strong><br />
Installed capacity<br />
(2011)<br />
376.5 MW<br />
964.5 MW<br />
475 MW<br />
873 MW<br />
28 MW<br />
© Stéfane Mauris / <strong>WWF</strong>-Canon<br />
MEXICO<br />
27
<strong>Solar</strong> <strong>PV</strong> <strong>Atlas</strong><br />
<strong>Solar</strong> <strong>PV</strong><br />
Most of Mexico consists of highlands,<br />
<strong>with</strong> the mounta<strong>in</strong> ranges to the east and<br />
west dropp<strong>in</strong>g steeply to small coastal<br />
pla<strong>in</strong>s. The most dom<strong>in</strong>ant topographical<br />
feature of the country is the <strong>in</strong>ner highlands<br />
which cover half of the total area<br />
of the country. While the entire country<br />
enjoys high levels of <strong>in</strong>solation, the Sierra<br />
Madre Oriental range and the areas to its<br />
west hold particularly strong potential<br />
for solar development.<br />
As of 2010, Mexico’s total <strong>in</strong>stalled <strong>PV</strong><br />
capacity was 26 MW. In addition to the<br />
distributed solar around the country,<br />
notable sites are the CFE-operated 1 MW<br />
site <strong>in</strong> Santa Rosalía, B.C. and the 5 MW<br />
project it is build<strong>in</strong>g <strong>in</strong> Cerro Prieto, BC.<br />
ABB is build<strong>in</strong>g a 1.2 MW project <strong>in</strong> San<br />
Luis Potosí. Though <strong>PV</strong> <strong>in</strong>stallations thus<br />
far have been small, plans for a 450MW<br />
concentrated photovoltaic plant <strong>in</strong> Baja<br />
California were announced <strong>in</strong> March<br />
2012, <strong>with</strong> 50 MW planned to come onl<strong>in</strong>e<br />
<strong>in</strong> 2013.<br />
A total of 950 square kilometres of solar<br />
panels would generate enough electricity<br />
to meet Mexico’s total current electricity<br />
generation. Because population and per<br />
capita electricity consumption are expected<br />
to rise <strong>in</strong> the com<strong>in</strong>g years, 2,200<br />
square kilometres of land dedicated to<br />
solar production would be required to<br />
meet to meet 100 per cent of Mexico’s<br />
total electricity needs <strong>in</strong> 2050. Concentrated<br />
<strong>in</strong>to one location, this land would<br />
represent a square of about 47 kilometres<br />
on each side. The solar map shows land<br />
needed for 2010 generation (red square)<br />
as well as land use needed to meet electricity<br />
demand <strong>in</strong> 2050 (blue square).<br />
MEXICO<br />
28
POPULATION DENSITY<br />
SOLAR RESOURCE<br />
Land required for <strong>PV</strong> to meet 100<br />
per cent of electricity production<br />
In the year 2010<br />
In the year 2050<br />
Land required for <strong>PV</strong> to meet 100<br />
per cent of electricity production<br />
In the year 2010<br />
In the year 2050<br />
Protected Areas<br />
Population Density > 100/km 2<br />
Population Density > 1000/km 2<br />
2 4 6 8<br />
kWh / m 2 / day<br />
In other words, even based on very conservative<br />
estimates, just over one-tenth of one per cent<br />
(0.11 per cent) of Mexico’s land would need to<br />
host solar <strong>PV</strong> generation <strong>in</strong> order to meet 100<br />
per cent of the country’s projected electricity<br />
needs <strong>in</strong> 2050.<br />
MEXICO<br />
29
<strong>Solar</strong> <strong>PV</strong> <strong>Atlas</strong><br />
<strong>Solar</strong> <strong>PV</strong> <strong>Atlas</strong>: MOROCCO<br />
MOROCCO<br />
Less than one-fifth of<br />
one per cent (0.17 per<br />
cent) of Morocco’s land<br />
would need to host<br />
solar <strong>PV</strong> generation <strong>in</strong><br />
order to meet 100 per<br />
cent of the country’s<br />
projected electricity<br />
needs <strong>in</strong> 2050.<br />
Located on the northwest coast of North<br />
Africa, the K<strong>in</strong>gdom of Morocco is a constitutional<br />
monarchy <strong>with</strong> a population of<br />
approximately 32 million people. In 2010,<br />
the GDP per capita of Morocco reached<br />
US$2,798, slightly higher than that of North<br />
Africa overall. 1<br />
Morocco is the largest energy importer <strong>in</strong><br />
northern Africa, import<strong>in</strong>g 97 per cent of<br />
its energy. 2 This heavy energy dependence<br />
makes the country particularly vulnerable<br />
to price fluctuations and supply disruptions.<br />
In 2008, total costs related to energy imports<br />
reached US$8 billion. Costs for energy<br />
imports have been ris<strong>in</strong>g for years and the<br />
Moroccan government has subsidized fuel<br />
prices <strong>with</strong> more than US$2 billion <strong>in</strong> order<br />
to keep Moroccan purchas<strong>in</strong>g power from<br />
plummet<strong>in</strong>g. Fund<strong>in</strong>g these subsidies for fossil<br />
fuels posed a significant stra<strong>in</strong> on the national<br />
budget, especially <strong>with</strong> primary energy<br />
demand predicted to treble by 2030.<br />
While 97 per cent of Moroccans have access<br />
to electricity, 3 it is important to note that fuel<br />
for cook<strong>in</strong>g presents enormous challenges<br />
<strong>in</strong> Morocco. The harvest<strong>in</strong>g of firewood for<br />
cook<strong>in</strong>g is contribut<strong>in</strong>g to tens of thousands<br />
of hectares of deforestation. 4 Electrification<br />
of cook<strong>in</strong>g and transportation would place<br />
additional demands on the current grid, but<br />
grid planners should consider the effects of<br />
<strong>in</strong>tegrat<strong>in</strong>g these sectors <strong>in</strong> the future.<br />
Morocco fronts both the Atlantic Ocean and<br />
Mediterranean Sea, border<strong>in</strong>g their juncture<br />
at the Strait of Gibraltar. Its climate is<br />
largely Mediterranean, though its <strong>in</strong>terior<br />
is drier and more desert like. Large coastal<br />
pla<strong>in</strong>s and plateaus edge the mounta<strong>in</strong>ous<br />
northern coast and <strong>in</strong>terior. There are more<br />
than 32,000 species of flora and fauna <strong>in</strong><br />
Morocco – of which 14 per cent are endemic<br />
– the second highest concentration of terrestrial<br />
species and highest concentration of<br />
mar<strong>in</strong>e species <strong>in</strong> the Mediterranean bas<strong>in</strong>. 5<br />
30
Electricity Sector<br />
MOROCCO<br />
With growth <strong>in</strong> both population and socioeconomics,<br />
Morocco is experienc<strong>in</strong>g rapid<br />
growth <strong>in</strong> electricity demand. Electricity<br />
demand is trend<strong>in</strong>g at a 7 per cent annual<br />
growth rate and is predicted to quadruple<br />
between 2008 and 2030. It imports both<br />
fuel for electricity generation and more than<br />
3,400 GWh of electricity directly through grid<br />
<strong>in</strong>terconnections <strong>with</strong> Spa<strong>in</strong> and Algeria.<br />
Electric Sector Profile<br />
Installed Capacity (2010)<br />
Electricity Production (2010)<br />
Residential Electricity Price<br />
(2010)<br />
Electricity consumption/capita<br />
(2009)<br />
Average electricity consumption/capita<br />
<strong>in</strong> IEA countries<br />
(2009)<br />
6.3 GW<br />
22,531 GWh<br />
US$0.10-<br />
0.16/kWh<br />
756 kWh<br />
Electricity Generation Mix (2010)<br />
Heavy fuel oil<br />
Coal<br />
Natural gas<br />
Hydro<br />
W<strong>in</strong>d<br />
9,200 kWh<br />
24 per cent<br />
34 per cent<br />
7 per cent<br />
33 per cent<br />
2 per cent<br />
The state-owned Office National de<br />
l’Electricité (ONE) is the primary player <strong>in</strong><br />
generation, transmission, and distribution of<br />
grid electricity. Through reforms the ONE has<br />
encouraged partial privatization, primarily<br />
<strong>in</strong> generation. Independent <strong>Power</strong> Producers<br />
can also conclude <strong>Power</strong> Purchase Agreements<br />
<strong>with</strong> <strong>in</strong>dustrial off-takers connected<br />
on the ONE High Voltage network. Morocco<br />
can benefit from deals <strong>with</strong> its gas-export<strong>in</strong>g<br />
neighbour, Algeria. For <strong>in</strong>stance, s<strong>in</strong>ce the<br />
mid 1990s, a natural gas pipel<strong>in</strong>e has led<br />
from the Algerian Hassi R’Mel gas field<br />
through Morocco to Spa<strong>in</strong>. Through royalties<br />
earned from this passage, Morocco has been<br />
able to tap <strong>in</strong>to the pipel<strong>in</strong>e for some of its<br />
own electricity generation.<br />
At the same time it is important for Morocco<br />
to reduce its dependency on energy imports.<br />
The country seeks to take advantage of its<br />
local coal resources, but is also <strong>in</strong>vest<strong>in</strong>g<br />
<strong>in</strong> more promis<strong>in</strong>g and susta<strong>in</strong>able energy<br />
sources, like solar and w<strong>in</strong>d energy. A high<br />
share of electricity is already com<strong>in</strong>g from<br />
hydropower, result<strong>in</strong>g <strong>in</strong> pumped storage aspects<br />
of its grid that could be used to balance<br />
renewable generation <strong>with</strong> variable outputs.<br />
In 2009, the government launched a sweep<strong>in</strong>g<br />
energy reform aimed at address<strong>in</strong>g ris<strong>in</strong>g<br />
costs of imported energy, to ensure reliable<br />
supply, and to expand access to electricity by<br />
encourag<strong>in</strong>g renewable energy development.<br />
In an effort to support Morocco’s growth <strong>with</strong><br />
secure and susta<strong>in</strong>able energy, the reform<br />
called for a diversification of generation technologies.<br />
The country’s current renewable<br />
energy target is 42 per cent of total electricity<br />
generation by 2020. It plans 1.72 GW of w<strong>in</strong>d<br />
power and 2 GW of solar power, on top of 2.6<br />
GW of new hydropower. 6<br />
RE Source<br />
Large Hydro<br />
<strong>Solar</strong> <strong>PV</strong><br />
<strong>Solar</strong> Thermal Electric<br />
W<strong>in</strong>d<br />
Installed Capacity<br />
(2010) 7<br />
1.27 GW<br />
10 MW<br />
20 MW<br />
291 MW<br />
31
<strong>Solar</strong> <strong>PV</strong> <strong>Atlas</strong><br />
<strong>Solar</strong> <strong>PV</strong><br />
As a result of rural electrification programmes,<br />
photovoltaic solar energy has<br />
a relatively well-established presence<br />
<strong>in</strong> Morroco’s countryside. At the end of<br />
2007, 44,719 households were equipped<br />
<strong>with</strong> solar home systems. A different<br />
government-run pilot programme, the<br />
Chourouk programme, will <strong>in</strong>stall 1,400<br />
micro <strong>PV</strong> power stations of 0.5-1 kW <strong>in</strong><br />
the regions of d’Errachidia, Benguerir<br />
and Ouarzazate. These <strong>PV</strong> stations will be<br />
connected to the low voltage grid. While<br />
the rural electrification programmes cont<strong>in</strong>ue,<br />
current discussion of solar often<br />
focuses on large-scale solar, both photovoltaic<br />
and concentrated solar power that<br />
could provide utility-scale <strong>in</strong>puts to the<br />
grid. 8<br />
Land required for <strong>PV</strong> to meet 100<br />
per cent of electricity production<br />
In the year 2010<br />
In the year 2050<br />
POPULATION DENSITY<br />
This map <strong>in</strong>cludes only the biodiversity data<br />
available through global data sets. Additional<br />
biodiversity <strong>in</strong>formation on protected areas <strong>in</strong><br />
Morocco is available at www.eauxetforets.gov.<br />
ma/fr/<strong>in</strong>dex.aspx (biodiversité) and<br />
http://ma.chm-cbd.net/manag_cons/esp_prot/<br />
stat_<strong>in</strong>t_ma/ramsar_site_ma<br />
Land required for <strong>PV</strong><br />
to meet 100 per cent of<br />
electricity production<br />
In the year 2010<br />
In the year 2050<br />
SOLAR RESOURCE<br />
MOROCCO<br />
725 km 2<br />
4897 km 2<br />
In November 2009, the K<strong>in</strong>g announced<br />
the Moroccan <strong>Solar</strong> Plan, a 2.0 GW solar<br />
target by 2020. In March 2010 the country<br />
established the Moroccan Agency for<br />
<strong>Solar</strong> Energy (MASEN) to implement the<br />
2.o GW mandate.<br />
Protected Areas<br />
Population Density > 100/km 2<br />
Population Density > 1000/km 2<br />
Morocco has recently upgraded the grid<br />
connection to Spa<strong>in</strong>, and is actively<br />
2 4 6 8<br />
kWh / m 2 / day<br />
32
MOROCCO<br />
engaged <strong>in</strong> discussions aimed at channel<strong>in</strong>g<br />
solar power <strong>in</strong>to Europe from North<br />
Africa. Over time, renewable electricity<br />
trade between North Africa and Europe<br />
could help both regions to progress<br />
towards <strong>WWF</strong>’s vision of 100 per cent<br />
renewable energy and enable the development<br />
of a “super smart grid.”<br />
With more than 2,500 hours of annual<br />
sunsh<strong>in</strong>e, Morocco has an exceptionally<br />
good solar resource. As can be seen on<br />
the solar map, the solar resource over the<br />
entire land area of Morocco is excellent<br />
<strong>with</strong> the exception of a few t<strong>in</strong>y areas on<br />
the Mediterranean coast.<br />
of about 28 kilometres on each side. The<br />
solar map shows land needed for 2010<br />
generation (red square), as well as land<br />
use needed to meet electricity demand <strong>in</strong><br />
2050 (blue square).<br />
In other words, even based on very conservative<br />
estimates, less than one-fifth of<br />
one per cent (0.17 per cent) of Morocco’s<br />
land would need to host solar <strong>PV</strong> generation<br />
<strong>in</strong> order to meet 100 per cent of the<br />
country’s projected electricity needs <strong>in</strong><br />
2050.<br />
A total of 120 square kilometres of solar<br />
panels would generate enough electricity<br />
to meet Morocco’s total current electricity<br />
generation. Because population and<br />
per capita electricity consumption are<br />
expected to rise <strong>in</strong> the com<strong>in</strong>g years, 760<br />
square kilometres of land dedicated to solar<br />
production would be required to meet<br />
100 per cent of Morocco’s total electricity<br />
needs <strong>in</strong> 2050. Concentrated <strong>in</strong>to one location,<br />
this land would represent a square<br />
© Mart<strong>in</strong> Harvey / <strong>WWF</strong>-Canon<br />
33
<strong>Solar</strong> <strong>PV</strong> <strong>Atlas</strong><br />
<strong>Solar</strong> <strong>PV</strong> <strong>Atlas</strong>: SOUTH AFRICA<br />
Less than one-tenth of<br />
one per cent (0.09 per<br />
cent) of South Africa’s<br />
land would need to host<br />
solar <strong>PV</strong> generation <strong>in</strong><br />
order to meet 100 per<br />
cent of the country’s<br />
projected electricity<br />
needs <strong>in</strong> 2050.<br />
The Republic of South Africa is a country<br />
of approximately 50.6 million people<br />
(2011). 1 In 2010, approximately 62 per<br />
cent of the population lived <strong>in</strong> urban<br />
areas, 2 and the country’s GDP per capita<br />
was US$10,280. 3 About 75 per cent of<br />
South Africans have access to electricity.<br />
The South African energy supply is dom<strong>in</strong>ated<br />
by coal, <strong>with</strong> 65.7 per cent of the<br />
primary energy supply, followed by crude<br />
oil <strong>with</strong> 21.6 per cent, renewable and<br />
wastes <strong>with</strong> 7.6 per cent and gas <strong>with</strong><br />
2.8 per cent. South Africa is a large coal<br />
producer, <strong>with</strong> proven coal reserves of 48<br />
gigatonnes, represent<strong>in</strong>g 5.7 per cent of<br />
total global reserves. 4<br />
South Africa is the third-most biologically<br />
diverse country <strong>in</strong> the world. With<br />
a land surface area equivalent to just 1<br />
per cent of the Earth’s total land surface,<br />
South Africa has almost 10 per cent of<br />
the world’s known bird, fish, and plant<br />
species and more than 6 per cent of the<br />
Earth’s mammal and reptile species.<br />
South Africa’s <strong>in</strong>credible biodiversity is<br />
due to its wide range of climatic conditions<br />
and unique topography. Most of the<br />
country is situated on a high-ly<strong>in</strong>g plateau,<br />
between two very different oceans:<br />
the Atlantic and the Indian.<br />
Habitat destruction, pollution, <strong>in</strong>vasive<br />
species, and climate change are currently<br />
threaten<strong>in</strong>g South Africa’s flora and<br />
fauna. More than 2,000 of the nation’s<br />
plants are threatened. The government<br />
is try<strong>in</strong>g to counteract this decl<strong>in</strong>e <strong>in</strong><br />
biodiversity <strong>with</strong> several programmes but<br />
progress has been slow. A rapid development<br />
of renewable energy <strong>in</strong> the country<br />
would contribute to the world’s fight<br />
aga<strong>in</strong>st climate change and could mitigate<br />
some of the local threats to habitat<br />
by reduc<strong>in</strong>g local pollution and destructive<br />
land use practices.<br />
SOUTH AFRICA<br />
© Michel Terrettaz / <strong>WWF</strong>-Canon<br />
34
Electricity sector<br />
Accord<strong>in</strong>g to its national Department of<br />
Energy, South Africa supplies two-thirds<br />
of Africa’s electricity and is one of the<br />
four cheapest electricity producers <strong>in</strong> the<br />
world. Yet one quarter of South Africans<br />
have no access to the grid and <strong>in</strong>stead rely<br />
on candles and kerosene for light<strong>in</strong>g. 5<br />
Eskom, the state-owned utility, dom<strong>in</strong>ates<br />
electricity generation, supply<strong>in</strong>g<br />
about 95 per cent of South Africa’s electricity.<br />
While Eskom does not have exclusive<br />
generation rights, practically speak<strong>in</strong>g<br />
it has a monopoly on bulk electricity<br />
as it owns and operates the national<br />
electricity grid. More than 90 per cent of<br />
all electricity generated by Eskom comes<br />
from South Africa’s <strong>in</strong>digenous coal<br />
supplies.<br />
In 2008 South Africa experienced roll<strong>in</strong>g<br />
blackouts. S<strong>in</strong>ce then it has managed<br />
to avoid further blackouts, but there are<br />
predictions that demand will exceed supply<br />
by 9 TWh by the end of 2012. In order<br />
to avoid further disruptions, the government<br />
has <strong>in</strong>troduced a series of measures<br />
to boost electricity production. Accord<strong>in</strong>g<br />
to the government’s new Integrated Resource<br />
Plan (IRP), local <strong>in</strong>stalled capacity<br />
must <strong>in</strong>crease to supply 454,000 GWh<br />
by 2030 <strong>with</strong> a Policy-Adjusted 2010 IRP<br />
<strong>in</strong>stalled capacity for 2030 of 89.5 GW.<br />
The IRP also commits to reduc<strong>in</strong>g water<br />
use and carbon dioxide emissions (275<br />
million tons of carbon dioxide annually<br />
after 2024).<br />
Despite the IRP’s commitment to renewable<br />
energy, unsusta<strong>in</strong>able energy sources<br />
such as coal or nuclear would still be the<br />
major source of power <strong>in</strong> South Africa<br />
<strong>in</strong> 2030. Coal would lead <strong>with</strong> 65 per<br />
cent of electricity production. Nuclear<br />
power would emerge as the second largest<br />
source, <strong>in</strong>creas<strong>in</strong>g its share of electricity<br />
production from 5 per cent to 20 per cent.<br />
Renewables would come third, produc<strong>in</strong>g<br />
9 per cent of electricity. 6<br />
The need for alternative sources of energy<br />
<strong>in</strong> South Africa is critical, and not only to<br />
meet the grow<strong>in</strong>g electricity demand. Reliance<br />
on coal-fired power has resulted <strong>in</strong><br />
South Africa’s greenhouse gas emissions<br />
be<strong>in</strong>g double the global per capita average.<br />
RE Source<br />
Hydro<br />
W<strong>in</strong>d<br />
<strong>Solar</strong> <strong>PV</strong><br />
Electric Sector Profile<br />
Installed Capacity (2008)<br />
Total Net Generation (2009)<br />
Average Residential<br />
Electricity Price (2010)<br />
Electricity<br />
consumption/capita<br />
Average electricity consumption/capita<br />
<strong>in</strong> IEA<br />
countries (2009)<br />
Installed capacity<br />
2.1 GW<br />
22 MW<br />
6 MW<br />
44.1 GW<br />
246,800 GWh<br />
US$0.062/<br />
kWh<br />
4,600 MWh<br />
9,200 kWh<br />
Electricity Generation Mix (2010)<br />
Coal<br />
Nuclear<br />
Hydropower<br />
90 per cent<br />
5 per cent<br />
5 per cent<br />
SOUTH AFRICA<br />
35
<strong>Solar</strong> <strong>PV</strong> <strong>Atlas</strong><br />
Along <strong>with</strong> emitt<strong>in</strong>g large amounts of<br />
carbon dioxide, coal-fired plants use<br />
significant amounts of water – net water<br />
consumption was 327,252 million litres<br />
<strong>in</strong> 2011, the highest level s<strong>in</strong>ce 2007. 7<br />
In addition to contribut<strong>in</strong>g to South Africa’s<br />
goal of reduc<strong>in</strong>g carbon emissions<br />
by 42 per cent by 2025, 8 renewable energy<br />
sources can help tackle unemployment,<br />
one of South Africa’s most serious<br />
and persistent socioeconomic issues. 9<br />
A green economy could create jobs by<br />
ramp<strong>in</strong>g-up the exist<strong>in</strong>g manufactur<strong>in</strong>g<br />
capacity to meet the region’s grow<strong>in</strong>g<br />
demand for alternative low-carbon<br />
energy sources.<br />
Pretoria has adopted several measures<br />
that <strong>in</strong>dicate that it is serious about<br />
develop<strong>in</strong>g renewables. In November<br />
2011, the government released the National<br />
Development Plan (NDP) – Vision<br />
for 2030. This advisory document<br />
dedicated a whole chapter to transition<strong>in</strong>g<br />
to a low-carbon economy. The plan<br />
envisions material <strong>in</strong>vestments <strong>in</strong>to<br />
low-carbon <strong>in</strong>frastructure by 2030,<br />
backed by <strong>in</strong>ternational f<strong>in</strong>ancial aid. 10<br />
In December 2011, South African President<br />
Jacob Zuma announced another<br />
<strong>in</strong>itiative to promote the development<br />
of renewable energy generation and<br />
<strong>in</strong>dustrial development <strong>in</strong> South Africa:<br />
The South African Renewable Initiative<br />
(SARi). SARi will provide low cost<br />
loans and other f<strong>in</strong>ancial <strong>in</strong>struments<br />
comb<strong>in</strong>ed <strong>with</strong> time-limited pay-forperformance<br />
grants to large-scale<br />
renewable developments. Although the<br />
South African government <strong>in</strong>itiated<br />
SARi, it is funded through a partnership<br />
agreement between the United States<br />
Department of Energy, the European<br />
Investment Bank and the governments<br />
of the UK, Germany, Denmark, Switzerland<br />
and Norway. 11<br />
© First <strong>Solar</strong>. Rooftop <strong>PV</strong> applications like these could provide<br />
significant generation for urban areas <strong>in</strong> South Africa.<br />
36<br />
SOUTH AFRICA
<strong>Solar</strong> <strong>PV</strong><br />
With an average of more than 2,500 hours<br />
of sunsh<strong>in</strong>e every year, South Africa has<br />
one of the highest and most stable solar<br />
radiation levels <strong>in</strong> the world. Yet solar<br />
power generation has rema<strong>in</strong>ed largely<br />
untapped. Nevertheless, <strong>in</strong> December 2011,<br />
Taiwan’s AUO Optronics announced along<br />
<strong>with</strong> Eskom that they had completed a 1.2<br />
MW <strong>PV</strong> project, the first system of its k<strong>in</strong>d<br />
<strong>in</strong> the country. President Zuma officially<br />
launched the facility, which is expected to<br />
supply electricity and jobs to the eThekW<strong>in</strong>i<br />
municipality. 12<br />
As can be seen on the solar map, the conditions<br />
for solar <strong>PV</strong> are excellent across the<br />
country. The effects of the coast and the<br />
mounta<strong>in</strong>s result <strong>in</strong> a small reduction <strong>in</strong><br />
solar irradiance along the country’s southern<br />
and eastern edges. <strong>Solar</strong> <strong>PV</strong> can greatly<br />
contribute to the country’s energy mix<br />
through decentralized access to electricity<br />
as well as large-scale <strong>PV</strong> power stations.<br />
A total of 1,130 square kilometres of solar<br />
<strong>PV</strong> <strong>in</strong>stallation would generate enough<br />
electricity to meet South Africa’s total<br />
current electricity generation. Population<br />
is projected to rise slightly <strong>in</strong> the com<strong>in</strong>g<br />
years, but if South Africa adopts efficiency<br />
measures that would br<strong>in</strong>g it <strong>in</strong> l<strong>in</strong>e <strong>with</strong><br />
<strong>WWF</strong>’s projected global per capita averages,<br />
it could see both universal electrification<br />
and a slightly lower per-capita electricity<br />
demand by 2050. With those assumptions,<br />
the area of land required to meet 100<br />
per cent of South Africa’s total electricity<br />
needs <strong>in</strong> 2050, us<strong>in</strong>g today’s <strong>PV</strong> technology,<br />
stays about the same – 1,110 square<br />
kilometres. Concentrated <strong>in</strong>to one location,<br />
this land would represent a square of about<br />
33 kilometres on each side. The solar map<br />
shows land needed for 2010 generation<br />
(red square), as well as land use needed<br />
to meet electricity demand <strong>in</strong> 2050 (blue<br />
square). In other words, less than one-tenth<br />
of one per cent (0.09 per cent) of South<br />
Africa’s land would need to host solar <strong>PV</strong><br />
generation <strong>in</strong> order to meet 100 per cent of<br />
the country’s projected electricity needs <strong>in</strong><br />
2050. If, conversely, South Africa cont<strong>in</strong>ued<br />
to expand generation capacity as per<br />
the 2010 IRP, to double by 2030, the “100%<br />
solar square” represented on the map for<br />
2050 would be larger but still remarkably<br />
modest.<br />
The energy profile published <strong>in</strong> South Africa’s<br />
1st National Communication under the<br />
United Nations Framework Convention on<br />
Climate Change 13 notes that although coal<br />
is by far the largest non-renewable energy<br />
resource <strong>with</strong> an impressive energy reserve<br />
of 1,298,000 PJ, it is almost <strong>in</strong>significant <strong>in</strong><br />
comparison to the country’s largest renewable<br />
energy resource, namely solar <strong>with</strong><br />
an energy reserve of 8,500,000 PJ/year.<br />
Thus, the total coal reserve is only equal<br />
to around 15 per cent of the solar resource<br />
that is available to South Africa every year.<br />
SOUTH AFRICA<br />
37
<strong>Solar</strong> <strong>PV</strong> <strong>Atlas</strong><br />
POPULATION DENSITY<br />
SOLAR RESOURCE<br />
SOUTH AFRICA<br />
Protected Areas<br />
Population Density > 100/km 2<br />
Population Density > 1000/km 2<br />
Land required for <strong>PV</strong><br />
to meet 100 per cent of<br />
electricity production<br />
In the year 2010<br />
In the year 2050<br />
In the year 2030*<br />
*per the policy goals set for<br />
2030 by the IRP<br />
2 4 6 8<br />
kWh / m 2 / day<br />
Land required for <strong>PV</strong><br />
to meet 100 per cent of<br />
electricity production<br />
In the year 2010<br />
In the year 2050<br />
In the year 2030*<br />
*per the policy goals set for 2030<br />
by the IRP<br />
38
<strong>Solar</strong> <strong>PV</strong> <strong>Atlas</strong>: TURKEY<br />
Less than one quarter<br />
of one per cent (0.21 per<br />
cent) of Turkey’s land<br />
would need to host solar<br />
<strong>PV</strong> generation <strong>in</strong> order<br />
to meet 100 per cent of<br />
Turkey’s projected electricity<br />
needs <strong>in</strong> 2050.<br />
The Republic of Turkey has a population<br />
of 74.7 million people (2011), 77 per cent<br />
of which live <strong>in</strong> urban areas. In 2010, the<br />
country’s GDP per capita was US$10,067, 1<br />
after grow<strong>in</strong>g 9 per cent from 2009. Most<br />
people have access to electricity but <strong>with</strong><br />
a high rate of losses and illegal consumption<br />
at 15 per cent.<br />
Turkey has experienced rapid growth <strong>in</strong><br />
energy demand <strong>in</strong> recent years that is<br />
likely to cont<strong>in</strong>ue <strong>in</strong> the medium- to longterm.<br />
2 The government is try<strong>in</strong>g to avoid<br />
bottlenecks <strong>in</strong> supply and susta<strong>in</strong> the<br />
country’s fast economic growth by open<strong>in</strong>g<br />
its markets to outside <strong>in</strong>vestment. It is<br />
also committed to expand<strong>in</strong>g energy production<br />
capacity while reduc<strong>in</strong>g dependence<br />
on imported energy sources, which<br />
stood at 71 per cent <strong>in</strong> 2011.<br />
Though Turkey stands as a global leader<br />
<strong>in</strong> solar water heat<strong>in</strong>g, <strong>with</strong> an <strong>in</strong>stalled<br />
capacity second only to Ch<strong>in</strong>a’s, Turkey’s<br />
electricity sector rema<strong>in</strong>s largely fossil<br />
fuel dependent. Demand for energy has<br />
grown substantially <strong>in</strong> recent years, particularly<br />
<strong>in</strong> the power sector.<br />
Turkey sits at the junction of Europe, Asia<br />
and Africa and is a part of three different<br />
bio-geographical regions. Thanks to<br />
its diverse ecosystems and topographic,<br />
geologic, geomorphologic and soil variety,<br />
Turkey is rich <strong>in</strong> fauna and flora, host<strong>in</strong>g<br />
132 mammal, 456 bird, 10,000 plant, 125<br />
reptile and amphibian, 364 butterfly and<br />
405 fish species.<br />
Environmental conservation <strong>in</strong> Turkey<br />
has historically followed an <strong>in</strong>consistent<br />
path. As suggested by the unbridgeable<br />
gap between legislation and enforcement<br />
and the recent regressive changes proposed<br />
for conservation legislation, conservation<br />
is not advanc<strong>in</strong>g. Unfortunately,<br />
current energy policies add additional<br />
pressure on the environment, whether<br />
through greenhouse gas emissions, coal<br />
m<strong>in</strong><strong>in</strong>g, nuclear plants or poorly planned<br />
hydropower projects.<br />
TURKEY<br />
© Gokham Tan<br />
39
<strong>Solar</strong> <strong>PV</strong> <strong>Atlas</strong><br />
Electricity sector<br />
Between 2000 and 2009, Turkey’s electricity<br />
demand grew 55.3 per cent, compared<br />
to 6.9 per cent <strong>in</strong> OECD countries<br />
and 22 per cent <strong>in</strong> the world. 3 To meet<br />
this demand, government has ramped-up<br />
annual electricity generation to 211,ooo<br />
GWh, a four-fold <strong>in</strong>crease over the past<br />
25 years. In its efforts to meet the rapid<br />
demand <strong>in</strong>crease, Turkey has favoured<br />
thermoelectric power plants, and as a<br />
result natural gas has become the ma<strong>in</strong><br />
energy source <strong>in</strong> electricity generation. 4<br />
build<strong>in</strong>g more nuclear and renewable capacity.<br />
6 A target of 30 per cent renewable<br />
electricity by 2023 was announced.<br />
Follow<strong>in</strong>g the law’s approval, Turkey<br />
experienced a boom <strong>in</strong> w<strong>in</strong>d power.<br />
Installed capacity for w<strong>in</strong>d energy, which<br />
was almost absent <strong>in</strong> 2002, reached<br />
1.799 GW <strong>in</strong> 2011. In the same period,<br />
the geothermal <strong>in</strong>stalled capacity grew<br />
from under 20MW to 94.2 MW.<br />
Electric Sector Profile (2011)<br />
Installed Capacity<br />
Total Net Generation<br />
Residential Electricity Price<br />
Electricity consumption/<br />
capita<br />
Average electricity consumption/capita<br />
<strong>in</strong> IEA<br />
countries (2009)<br />
52.458 MW<br />
211,000 GWh<br />
0.258 TL/kWh<br />
$US0.14/kWh<br />
2,791 kWh<br />
9,200 kWh<br />
Electricity Generation Mix (2009)<br />
Turkey’s grow<strong>in</strong>g dependence on fossil<br />
fuels has resulted <strong>in</strong> a dramatic <strong>in</strong>crease<br />
<strong>in</strong> import dependence, as almost all of<br />
the natural gas and one-third of the coal<br />
used to produce electricity has to be<br />
imported. 5 Concerned <strong>with</strong> the impact<br />
of this dependence on its energy security<br />
and f<strong>in</strong>ances, the government <strong>in</strong>troduced<br />
several measures to improve energy efficiency,<br />
<strong>in</strong>crease diversification while<br />
reduc<strong>in</strong>g carbon emissions. In the 2009<br />
“Electricity Energy Market and Supply<br />
Security Strategy Paper,” the government<br />
announced its electricity generation goals<br />
for 2023 as reduc<strong>in</strong>g natural gas while<br />
© Sedat Kalem / <strong>WWF</strong>-Turkey<br />
Natural gas<br />
Coal<br />
Hydropower<br />
W<strong>in</strong>d, geothermal, + other<br />
RE<br />
Other<br />
43.8 per cent<br />
26.6 per cent<br />
24 per cent<br />
2.5 per cent<br />
3.1 per cent<br />
RE source Installed Capacity (2011)<br />
Hydro 17.036 GW<br />
W<strong>in</strong>d 1.799 GW<br />
Geothermal 94 MW<br />
<strong>Solar</strong> <strong>PV</strong> 1 MW<br />
TURKEY<br />
40
<strong>Solar</strong> <strong>PV</strong><br />
Presently there is a small solar photovoltaic<br />
market <strong>in</strong> Turkey. This market<br />
emerged when commercial companies<br />
– shopp<strong>in</strong>g malls, factories, hospitals<br />
– and several homeowners decided to<br />
reduce their electricity costs by <strong>in</strong>stall<strong>in</strong>g<br />
solar panels for their own energy production.<br />
As of 2010, official figures rate<br />
solar <strong>PV</strong> at one megawatt of <strong>in</strong>stalled<br />
capacity.<br />
Despite adoption by a small segment<br />
of the population, solar power is still a<br />
nom<strong>in</strong>al source of electricity. Recently,<br />
the government approved an amendment<br />
to the Renewable Energy Law<br />
which was <strong>in</strong> part designed to <strong>in</strong>crease<br />
the generat<strong>in</strong>g capacity of solar power.<br />
Reactions to this amendment have been<br />
mixed as the proposed feed-<strong>in</strong> tariff is<br />
capped at 10 years, too short a time to<br />
f<strong>in</strong>ance projects <strong>with</strong> traditional capital<br />
markets. Additionally, clear regulations<br />
are needed to allow solar power to be<br />
connected to the grid.<br />
Potential <strong>in</strong>vestors <strong>in</strong> Turkey’s solar<br />
energy sector are attracted by Turkey’s<br />
possible participation <strong>in</strong> the European<br />
Electricity Market, follow<strong>in</strong>g the 2009<br />
synchronization between the Turkish<br />
power system and the <strong>in</strong>terconnected<br />
power systems of cont<strong>in</strong>ental Europe.<br />
Turkey is also expected to play an important<br />
role <strong>in</strong> cross-border renewable<br />
projects “Desertec” 7 and “Mediterranean<br />
<strong>Solar</strong> Plan,” 8 both as a solar energy supplier<br />
and a bridge between the Middle<br />
East and Europe.<br />
Most of Turkey’s southern half has annual<br />
<strong>in</strong>solation values above 5.0 kWh/<br />
m 2 /day. Istanbul, due to the effects of<br />
the Black Sea, is less sunny <strong>with</strong> about<br />
4.1 kWh/m 2 /day. <strong>Solar</strong> development<br />
along the Aegean and Mediterranean<br />
coasts appears to present the best opportunity<br />
for align<strong>in</strong>g population centres<br />
and large <strong>PV</strong> plants.<br />
A total of 790 kilometres of solar panels<br />
would generate enough electricity<br />
to meet Turkey’s total current electricity<br />
generation. Because population and<br />
per capita electricity consumption are<br />
expected to rise <strong>in</strong> the com<strong>in</strong>g decades,<br />
1,600 square kilometres of land dedicated<br />
to solar production would be required<br />
to meet 100 per cent of Turkey’s total<br />
electricity needs <strong>in</strong> 2050. Concentrated<br />
<strong>in</strong>to one location, this land would represent<br />
a square of about 40 kilometres<br />
on each side. The solar map shows<br />
land needed for 2010 generation (red<br />
square), as well as land use needed to<br />
meet electricity demand <strong>in</strong> 2050 (blue<br />
square). In other words, even based on<br />
very conservative estimates, less than<br />
one quarter of one per cent (0.21 per<br />
cent) of Turkey’s land would need to<br />
host solar <strong>PV</strong> generation <strong>in</strong> order to<br />
meet 100 per cent of Turkey’s projected<br />
electricity needs <strong>in</strong> 2050.<br />
TURKEY<br />
41
<strong>Solar</strong> <strong>PV</strong> <strong>Atlas</strong><br />
Land required for <strong>PV</strong> to meet 100<br />
per cent of electricity production<br />
In the year 2010<br />
In the year 2050<br />
Protected Areas<br />
Population Density > 100/km 2<br />
Population Density > 1000/km 2<br />
POPULATION DENSITY<br />
This map <strong>in</strong>cludes only the biodiversity<br />
data available through<br />
global data sets. Additional biodiversity<br />
<strong>in</strong>formation for Turkey is<br />
available through the M<strong>in</strong>istry of<br />
Forestry and Water Affairs at:<br />
http://geodata.ormansu.gov.tr/3d/<br />
<strong>in</strong>dexv5.aspx<br />
2 4 6 8<br />
Land required for <strong>PV</strong><br />
to meet 100 per cent of<br />
electricity production<br />
In the year 2010<br />
In the year 2050<br />
kWh / m 2 / day<br />
SOLAR RESOURCE<br />
TURKEY<br />
42
Electricity consumption <strong>in</strong> 2050 – Efficiency and Electrification<br />
A fully susta<strong>in</strong>able<br />
renewable energy<br />
power supply is<br />
the only way we<br />
can secure energy<br />
for all and avoid<br />
environmental<br />
catastrophe.<br />
In one city, halogen lights sh<strong>in</strong>e brightly <strong>in</strong><br />
unoccupied offices. In another, people are literally<br />
sitt<strong>in</strong>g <strong>in</strong> the dark. Electricity consumption<br />
levels of much of the world today are unsusta<strong>in</strong>able:<br />
1.3 billion people completely lack access to<br />
electricity, while electricity generation to support<br />
consumption levels <strong>in</strong> much of the world is<br />
already stra<strong>in</strong><strong>in</strong>g human health and the environment.<br />
A fully susta<strong>in</strong>able renewable energy<br />
supply is the only way we can secure energy for<br />
all and avoid environmental catastrophe. As we<br />
contemplate this shift to renewable energy and<br />
universal access, all plausible scenarios po<strong>in</strong>t to<br />
energy efficiency as the first and f<strong>in</strong>est “fuel.” To<br />
meet global electricity demands <strong>in</strong> 2050, fewer<br />
joules will be provid<strong>in</strong>g more energy services.<br />
This is why global energy supply decreases by<br />
2050 <strong>in</strong> the Ecofys scenario, despite the projected<br />
population <strong>in</strong>crease and expansion of energy<br />
services (see Figure 1, page 9.)<br />
While global energy consumption is projected to<br />
fall, electricity consumption is projected to double<br />
by 2050, as a result of electrification trends<br />
<strong>in</strong> transportation, heat<strong>in</strong>g and other sectors. Use<br />
of renewable sources allows the global share of<br />
electricity supply to <strong>in</strong>crease drastically by 2050<br />
while fossil and nuclear fuels are phased out.<br />
Figure 3: Global ELECTRICITY Supply<br />
Ecofys sees a dramatic <strong>in</strong>crease <strong>in</strong> renewable electricity, completely<br />
displac<strong>in</strong>g the need for fossil and nuclear based electricity by 2050.<br />
Source: The Ecofys Energy Scenario, December 2010.<br />
43
<strong>Solar</strong> <strong>PV</strong> <strong>Atlas</strong><br />
Access and Equity<br />
The Ecofys Scenario makes no mention of how<br />
the global electricity supply will be distributed<br />
among countries. To reach per capita electricity<br />
consumption <strong>in</strong> 2050 for the various regions <strong>in</strong><br />
this atlas, we make the bold assumption that there<br />
will be energy equality across borders. In this UN<br />
“Year of Susta<strong>in</strong>able Energy for All”, we assert<br />
optimistically that through efficiency, <strong>in</strong>novation,<br />
and responsible deployment of exist<strong>in</strong>g technologies,<br />
we can and will build susta<strong>in</strong>able energy<br />
systems that both eradicate energy poverty and<br />
protect economic and environmental prosperity.<br />
As the graph below illustrates, projected per capita<br />
electricity consumption for 2050 falls far below<br />
current levels of consumption <strong>in</strong> the EU and US<br />
and also slightly below current levels <strong>in</strong> South<br />
Africa. It exceeds current levels of consumption<br />
<strong>in</strong> the other six selected regions. It is important<br />
to note that <strong>in</strong> many of the selected regions much<br />
of the population is liv<strong>in</strong>g <strong>with</strong>out any electricity.<br />
The per capita consumption data are thus low<br />
for these regions not because of energy efficient<br />
economies but because of energy poverty.<br />
Expand<strong>in</strong>g access to electricity is critical, and <strong>in</strong><br />
expand<strong>in</strong>g access careful decision makers must<br />
fully assess the real cost effectiveness of deep efficiency<br />
and renewable energy development to meet<br />
these needs. Indeed, the areas of least access are<br />
often the areas of greatest potential for thoughtful<br />
development. Much as mobile telephony saw<br />
explosive growth <strong>in</strong> areas where copper phone<br />
wires did not exist, so too can susta<strong>in</strong>able energy<br />
systems leapfrog traditional electricity systems<br />
<strong>in</strong> areas <strong>with</strong> little <strong>in</strong>cumbent energy technology.<br />
These <strong>in</strong>novations spill across borders, and, as we<br />
have seen <strong>in</strong> sectors from agriculture to telecommunications,<br />
“South-to-North” technology transfer<br />
can transform established systems.<br />
Figure 4: 2050 Global and current regional per capita<br />
electricity consumption.<br />
This atlas calculates solar needs based on levelized global per capita<br />
energy consumption <strong>in</strong> 2050. Given current trends, this atlas very likely<br />
overestimate future per capita electricity consumption <strong>in</strong> many of the<br />
focus regions, while it may slightly underestimate future electricity consumption<br />
<strong>in</strong> heavily <strong>in</strong>dustrialized countries such as South Africa.<br />
Sources: 2050 global - Ecofys Scenario 2010, World Bank and<br />
Government of India.<br />
44
Electricity <strong>in</strong> <strong>Harmony</strong> <strong>with</strong> <strong>Nature</strong>: Photovoltaics<br />
<strong>Solar</strong> energy is the most abundant energy resource<br />
on Earth. The solar energy that hits the Earth’s surface<br />
<strong>in</strong> one hour is about the same as the amount of<br />
energy consumed by all human activities <strong>in</strong> a year.<br />
<strong>PV</strong> systems directly convert solar energy <strong>in</strong>to electricity.<br />
Other solar technologies harness the sun’s<br />
energy through concentrat<strong>in</strong>g solar power (CSP)<br />
and <strong>with</strong> solar thermal collectors for heat<strong>in</strong>g and<br />
cool<strong>in</strong>g (SHC).<br />
<strong>PV</strong> is a versatile technology. Systems can be connected<br />
to the utility grid, to m<strong>in</strong>i-grids or operated<br />
<strong>in</strong> stand-alone applications. They can be used <strong>in</strong><br />
build<strong>in</strong>g-<strong>in</strong>tegrated systems (BI<strong>PV</strong>) or be groundmounted,<br />
for example, <strong>in</strong> large-scale electricity<br />
production facilities.<br />
There are four end-use sectors <strong>with</strong> dist<strong>in</strong>ct<br />
markets for <strong>PV</strong>:<br />
• Residential systems (typically up to 20 kW<br />
systems on <strong>in</strong>dividual build<strong>in</strong>gs/dwell<strong>in</strong>gs).<br />
• Commercial systems (typically up to 1 MW<br />
systems for commercial office build<strong>in</strong>gs,<br />
schools, hospitals, and retail).<br />
• Utility scale systems (start<strong>in</strong>g at 1 MW, typically<br />
ground-mounted).<br />
• Off-grid applications (vary<strong>in</strong>g sizes).<br />
<strong>PV</strong> generation <strong>in</strong>stalled directly at the site of<br />
electricity consumption can alleviate grid congestion<br />
and defer or elim<strong>in</strong>ate the expense of upgrad<strong>in</strong>g<br />
grid <strong>in</strong>frastructure. Utility-scale systems can<br />
leverage economies of scale and optimal sit<strong>in</strong>g to<br />
achieve low levelized costs of energy (LCOE). Offgrid<br />
and m<strong>in</strong>i-grid applications br<strong>in</strong>g reliable electricity<br />
to areas previously underserved or served<br />
<strong>with</strong> expensive diesel supply. These different applications<br />
have different system costs and compete<br />
at different price levels.<br />
Today, <strong>PV</strong> provides 0.1 per cent of total global electricity<br />
generation. 1 However, <strong>PV</strong> has seen an average<br />
annual growth rate of more than 40 per cent<br />
s<strong>in</strong>ce 2000. Now a well-established commercially<br />
available and reliable technology, it has significant<br />
potential for long-term growth <strong>in</strong> nearly all world<br />
regions now and <strong>in</strong> the com<strong>in</strong>g decades.<br />
Grid parity is already a reality for solar <strong>PV</strong> <strong>in</strong> some<br />
applications and markets. Nevertheless, the realities<br />
of explicit and structural subsidies for fossil<br />
fuels and nuclear energy mean that achiev<strong>in</strong>g high<br />
levels of <strong>PV</strong> electricity supply cost-effectively –<br />
and the associated, environmental, economic and<br />
societal benefits – will require concerted policy<br />
support.<br />
Provid<strong>in</strong>g power, grow<strong>in</strong>g food<br />
and protect<strong>in</strong>g biodiversity<br />
<strong>Solar</strong> <strong>PV</strong> is socioeconomically one of the most<br />
benign energy technologies that exist today. Impacts<br />
on the local environment are relatively low<br />
or even positive; 2 energy pay-back time is short;<br />
greenhouse gas emissions are close to zero when<br />
measured over their entire life-time; and socially,<br />
solar <strong>PV</strong> creates jobs <strong>in</strong> manufactur<strong>in</strong>g, development,<br />
construction, <strong>in</strong>stallation and operation of<br />
roof-top solar and solar parks. <strong>PV</strong> is also a crucial<br />
technology to provide a reliable access to electricity<br />
to the many people liv<strong>in</strong>g <strong>in</strong> remote areas <strong>with</strong>out<br />
access to a grid.<br />
Policy makers and land planners must constantly<br />
balance land use and conservation. We need land<br />
for build<strong>in</strong>gs and other <strong>in</strong>frastructure, to grow food<br />
and fibres and raise livestock, we need forests for<br />
timber and paper, and seas for food and leisure,<br />
and we also need to leave space for nature. We<br />
need healthy ecosystems to provide clean air and<br />
water, regulate our climate, keep our soils and seas<br />
productive, prevent flood<strong>in</strong>g, and more. To build<br />
susta<strong>in</strong>able electricity systems over the com<strong>in</strong>g<br />
decades we will need to develop an extensive re-<br />
45
<strong>Solar</strong> <strong>PV</strong> <strong>Atlas</strong><br />
newable energy <strong>in</strong>frastructure, and mak<strong>in</strong>g the right<br />
choices on technologies and land use will be crucial.<br />
It is <strong>in</strong> this context that there is grow<strong>in</strong>g public<br />
attention on how solar parks affect both climate<br />
change and biodiversity. Although the land use for<br />
solar parks is m<strong>in</strong>imal compared to other uses, the<br />
solar sector must also evaluate and manage any negative<br />
impacts of its activities on the environment.<br />
Overall, research has consistently found that when<br />
developed responsibly, ground-mounted solar <strong>PV</strong><br />
power plants provide considerable environmental<br />
benefits. Replac<strong>in</strong>g exist<strong>in</strong>g grid electricity <strong>with</strong> <strong>PV</strong><br />
arrays reduces emissions of greenhouse gases, criteria<br />
pollutants, heavy metals, and radioactive species<br />
by at least 89 per cent 3 and also significantly reduces<br />
water <strong>with</strong>drawal and consumption. 4<br />
A 2009 study of <strong>PV</strong> solar generation environmental<br />
impacts found that, “<strong>Solar</strong> technology is concluded<br />
to be much preferable to traditional means of<br />
power generation, even consider<strong>in</strong>g wildlife and<br />
land use impacts”. From the 32 environmental<br />
impact categories the researchers identified for solar<br />
power plants, they found that 22 were beneficial<br />
relative to traditional power generation, 4 were neutral,<br />
none were detrimental, and 6 needed further<br />
research. 5<br />
Figure 5: <strong>Solar</strong> <strong>PV</strong> Impacts Relative to Traditional U.S. <strong>Power</strong> Generation<br />
Source: Turney and Fthenakis, 2011.<br />
46
All large-scale energy <strong>in</strong>frastructure developments<br />
must as a m<strong>in</strong>imum ensure legal compliance, pass<br />
environmental impact assessments, meet environmental<br />
and social criteria and engage local<br />
stakeholders. The Gold Standard for best practice<br />
<strong>in</strong> projects deliver<strong>in</strong>g carbon credits, <strong>in</strong>clud<strong>in</strong>g a<br />
“do not harm” susta<strong>in</strong>ability assessment and local<br />
stakeholder consultation guidel<strong>in</strong>es, provides<br />
a good example. 6 In the hydropower sector, the<br />
International Hydropower Association developed a<br />
susta<strong>in</strong>ability protocol together <strong>with</strong> key stakeholders<br />
<strong>in</strong>clud<strong>in</strong>g <strong>WWF</strong>. For biofuels, there is a Roundtable<br />
of Susta<strong>in</strong>able Biofuels–<strong>in</strong> which <strong>WWF</strong> has<br />
participated s<strong>in</strong>ce the <strong>in</strong>itiative’s launch.<br />
No such <strong>in</strong>dustry standard yet exists for solar <strong>PV</strong><br />
development, but developers, policy makers and<br />
environmental groups are active <strong>in</strong> this field and<br />
develop<strong>in</strong>g guidel<strong>in</strong>es and best practices. In 2005,<br />
German NGO NABU and <strong>Solar</strong> Association BSW issued<br />
the first guidel<strong>in</strong>es for solar <strong>PV</strong>. A 2010 report<br />
by the German Renewable Energies Agency summarizes<br />
the results of an assessment of eight solar<br />
parks, look<strong>in</strong>g at several years’ worth of monitor<strong>in</strong>g<br />
data and best practices. The report concludes that<br />
us<strong>in</strong>g land for <strong>PV</strong> development, climate protection<br />
and environmental protection can happen simultaneously<br />
provided that solar plants are responsibly<br />
planned, constructed and operated, and sensitive<br />
areas are properly protected or avoided. Accord<strong>in</strong>g<br />
to the report, several solar parks have even shown<br />
an <strong>in</strong>crease of biodiversity, especially <strong>in</strong> areas that<br />
were previously sealed, used for <strong>in</strong>tensive agriculture<br />
or former military fields. The report also describes<br />
good practices and gives recommendations<br />
on plann<strong>in</strong>g and management of solar parks:<br />
• Dedicated buffer areas <strong>in</strong> solar parks can grow<br />
<strong>in</strong>to important biotopes for endangered species.<br />
• Environmental impact assessments need to<br />
consider specific local conditions and propose<br />
relevant compensatory measures.<br />
• It is important to <strong>in</strong>volve (local) experts for<br />
ecologically sound project plann<strong>in</strong>g.<br />
• Soil seal<strong>in</strong>g needs to be avoided to the extent<br />
possible - seal<strong>in</strong>g should usually not exceed 1<br />
per cent of the total surface.<br />
• Species selection for post-construction replant<strong>in</strong>g<br />
<strong>with</strong><strong>in</strong> the solar park should preserve local<br />
genetic diversity.<br />
• M<strong>in</strong>imiz<strong>in</strong>g closed areas and creat<strong>in</strong>g passageways<br />
for animals reduces negative effects of<br />
fenc<strong>in</strong>g for animals.<br />
• Cont<strong>in</strong>uous monitor<strong>in</strong>g is essential to gather<br />
useful <strong>in</strong>formation for future improvements.<br />
In 2011, CLER, a French umbrella NGO promot<strong>in</strong>g<br />
renewable energies, developed a position paper<br />
“<strong>Solar</strong> Parks, Yes, But Not at All Costs” 7 and later<br />
launched a guide for responsible solar parks that is<br />
<strong>in</strong> l<strong>in</strong>e <strong>with</strong> the NABU/BSW guidance and <strong>with</strong> the<br />
AEE report’s best practices list. 8<br />
These reports, guidel<strong>in</strong>es and policies contribute to<br />
a balanced debate on the development and acceptance<br />
of solar parks and the promotion of renewable<br />
and solar energy globally. <strong>PV</strong> solar players,<br />
project developers and other key stakeholders<br />
should consider launch<strong>in</strong>g a multi-stakeholder<br />
<strong>in</strong>itiative <strong>in</strong> this area and agree on sector-wide<br />
guidel<strong>in</strong>es for responsible land management to<br />
be applied globally. The International Energy<br />
Agency’s Very Large-scale <strong>PV</strong> Systems Task 8 is<br />
currently look<strong>in</strong>g at impacts and best practices, and<br />
could play a role <strong>in</strong> this process. A summary table<br />
of impact categories that can be considered when<br />
plann<strong>in</strong>g, develop<strong>in</strong>g, construct<strong>in</strong>g and operat<strong>in</strong>g a<br />
large-scale <strong>PV</strong> facility is <strong>in</strong>cluded as Annex 2.<br />
Another often-raised concern, soon mandated <strong>in</strong><br />
the EU, relates to the take-back and recycl<strong>in</strong>g of<br />
end-of-life (EOL) <strong>PV</strong> modules. As a way to improve<br />
the green footpr<strong>in</strong>t of all <strong>PV</strong> companies, take back<br />
and recycl<strong>in</strong>g allows for material recovery and for<br />
47
<strong>Solar</strong> <strong>PV</strong> <strong>Atlas</strong><br />
reduction of cumulative energy demand<br />
and associated carbon footpr<strong>in</strong>t of <strong>PV</strong><br />
modules. Volumes of EOL panels are still<br />
relatively low (<strong>PV</strong> panels have a long life<br />
time, 20-30 years) but are expected to<br />
considerably grow when larger amounts<br />
of solar panels are retired and returned.<br />
To assess the susta<strong>in</strong>ability of <strong>PV</strong> modules<br />
and <strong>in</strong>stallations, all three pillars of susta<strong>in</strong>ability—economic,<br />
social and environmental—should<br />
be considered while tak<strong>in</strong>g<br />
the entire lifecycle, from sourc<strong>in</strong>g of raw<br />
materials to production, operation, and<br />
end-of-life reclamation.<br />
© First <strong>Solar</strong><br />
48
Annex 1: About this <strong>Atlas</strong> – Assumptions, Data, and Process<br />
The figures used for land use calculations are extremely cautious:<br />
<strong>PV</strong> contribution to total electricity mix<br />
The Ecofys Scenario <strong>in</strong> the The Energy Report suggests solar<br />
<strong>PV</strong> could contribute 29 per cent of total electricity production<br />
<strong>in</strong> 2050, (page 232) however the squares shown <strong>in</strong> the<br />
preced<strong>in</strong>g maps represent the equivalent of 100 per cent<br />
electricity generated by <strong>PV</strong>. In reality a mix of different renewable<br />
energy generation technologies will meet the world’s<br />
future electricity needs.<br />
<strong>PV</strong> efficiency<br />
Our calculations assume <strong>PV</strong> efficiency of 15 per cent, a conservative<br />
number based on today’s commercial technology.<br />
Already manufacturers are show<strong>in</strong>g viable modules at efficiencies<br />
of around 20 per cent, and it is reasonable to assume<br />
that technology will further improve between now and 2050.<br />
<strong>Solar</strong> resource<br />
Annual mean Global Horizontal Irradiance solar resource<br />
data is drawn from 3TIER’s global solar dataset. This highresolution<br />
(approximately 3 km) solar resource dataset has<br />
global coverage and is based on more than a decade of high<br />
resolution satellite imagery us<strong>in</strong>g proven techniques, stateof-the-art<br />
satellite process<strong>in</strong>g algorithms, and publicly available<br />
observational data. We converted GHI values of watts/<br />
metre 2 <strong>in</strong>to kilowatt-hours/metre 2 /day, and we then found<br />
the average value for each region.<br />
Figure 6: Each of the selected regions has a “very good” to “excellent” solar resource.<br />
The boxplot above shows the relative values and variability of irradiance for the<br />
selected areas. The orange boxes represent the mean irradiance value plus and<br />
m<strong>in</strong>us one standard deviation for each area. The extremes of the black “whiskers”<br />
on the plot illustrate the m<strong>in</strong>imum and maximum values. Thus the regions <strong>with</strong> long<br />
whiskers see a high variability of solar irradiance across their territories. Regions<br />
<strong>with</strong> small whiskers, like Madhya Pradesh, see little variation of solar characteristics<br />
across their territory. The average solar irradiance figures for each area of <strong>in</strong>terest<br />
were derived from the 3TIER global horizontal irradiance data set.<br />
49
<strong>Solar</strong> <strong>PV</strong> <strong>Atlas</strong><br />
Protected areas do not equal conservation priorities<br />
De-rat<strong>in</strong>g factor<br />
Not every bit of the land dedicated to <strong>PV</strong> electricity<br />
production will actually host modules. About 20 per<br />
cent will be necessary for roads, shadow reduction,<br />
service stations, etc. To satisfy this <strong>in</strong> our calculations,<br />
we ‘de-rate’ the land required so that our land<br />
estimates reflect all land dedicated broadly to <strong>PV</strong><br />
generation, <strong>in</strong>clud<strong>in</strong>g these roads and shad<strong>in</strong>g areas. 1<br />
Per capita electricity consumption <strong>in</strong> 2050<br />
This atlas makes the bold assumption that there<br />
will be energy equality across borders. To reach per<br />
capita electricity consumption <strong>in</strong> 2050 for the various<br />
regions, it takes the total global electricity supply<br />
for 2050 (127.4 EJ/year or 3.5389E+10 MWh/year)<br />
reached by Ecofys <strong>in</strong> the The Energy Report 2 and divides<br />
by the UN Population Department’s projection<br />
for 2050 global population (9,191,287,000) 3 to get<br />
3.85 MWh/year/person. A region’s projected energy<br />
consumption is the the region’s projected population<br />
<strong>in</strong> 2050 4 multiplied by 3.85 MWh/year/person.<br />
Protected areas<br />
For consistency, this atlas drew from two global<br />
data sets to illustrate protected areas and areas of<br />
particularly critical biodiversity importance: the<br />
International Union for Conservation of <strong>Nature</strong>’s<br />
Protected Areas (all categories) and the Alliance for<br />
Zero Ext<strong>in</strong>ction’s list of critical refuge sites. Beyond<br />
what is shown, various levels of data exist regard<strong>in</strong>g<br />
important conservation areas for each region. Please<br />
refer to <strong>WWF</strong> country and regional offices for more<br />
<strong>in</strong>formation about local protected areas and conservation<br />
priorities.<br />
50
Technical corner<br />
• Global Horizontal Irradiance data, courtesy of 3TIER (www.3tier.com)<br />
• Population density data from the UNEP and FAO<br />
• Protected areas from the UNEP (www.protectedplanet.net)<br />
• Protected areas from the Alliance for Zero Ext<strong>in</strong>ction<br />
(www.zeroext<strong>in</strong>ction.org)<br />
• Basemap data from Natural Earth (www.naturalearth.com).<br />
• Country boundary <strong>in</strong>formation from the Global Adm<strong>in</strong> dataset<br />
(www.gadm.org)<br />
Geospatial process<strong>in</strong>g for this atlas was completed us<strong>in</strong>g a comb<strong>in</strong>ation of<br />
GDAL tools (www.gdal.org) and QGIS (www.qgis.org) for render<strong>in</strong>g.<br />
In general, the process<strong>in</strong>g steps were the follow<strong>in</strong>g:<br />
1. Clip out region specific <strong>in</strong>formation for irradiance and population density.<br />
2. For population density, mask out areas <strong>with</strong> population density
<strong>Solar</strong> <strong>PV</strong> <strong>Atlas</strong><br />
The follow<strong>in</strong>g calculations for Madagascar illustrate the land area<br />
calculation process:<br />
From 3TIER data, we calculate the average GHI value for Madagascar to<br />
be 6.04 kWh/m 2 /day. We multiply that figure by 365 and divide by 1000<br />
to arrive at 2.2046 MWh/m 2 /year.<br />
6.04 kWh/m2/day * 365 days / 1000 = 2.2046 MWh/m2/year<br />
To conservatively estimate a “reasonable <strong>PV</strong> generation per square metre per<br />
year”, we multiply the above figure by 0.15 (for performance of <strong>PV</strong> system)<br />
and by 0.8 (a derat<strong>in</strong>g value to account for shadows, roads, etc. <strong>in</strong> a project<br />
<strong>in</strong>stallation.) We get 0.264552 megawatt-hours per square metre per year.<br />
2.2046MWh/m2/a * 0.15 * 0.8 = 0.264552 MWh/m2/year<br />
To estimate the land area needed to support current electricity generation <strong>in</strong><br />
Madagascar, we divide the current annual electricity generation (1,200,000<br />
MWh/year) by the ‘reasonable <strong>PV</strong> generation per square metre per year.’ For<br />
simplicity of expression, we convert square metres to square kilometres and<br />
round the number.<br />
To estimate the land area needed to support projected electricity generation<br />
<strong>in</strong> Madagascar <strong>in</strong> the year 2050, we first estimate 2050 electricity generation<br />
by multiply<strong>in</strong>g the 2050 projected population <strong>in</strong> Madagascar (53,561,000<br />
people) by the projected global per capita electricity generation <strong>in</strong> 2050<br />
(approximately 3.85 megawatt-hours per person per year.) We arrive at<br />
206,224,680.9 megawatt-hours per year for total projected electricity generation<br />
<strong>in</strong> Madagascar <strong>in</strong> 2050.<br />
53,561,000 people * 3.850276898 MWh/person/year ≈<br />
206,224,680.9 MWh/year<br />
From here we follow the same steps to convert to estimated land area.<br />
206,224,680.9 MWh/year / 0.264552 MWh/m2/year * 0.000001 ≈<br />
780 km2<br />
NOTE: Most of the uncerta<strong>in</strong>ty of this calculation is due to uncerta<strong>in</strong>ties of the population<br />
and per capita energy consumption <strong>in</strong> Madagascar <strong>in</strong> 2050. These calculations are purposefully<br />
very conservative and likely overestimate the required land areas.<br />
1,200,000 MWh/year / 0.264552 MWh/m2/year * 0.000001 ≈ 4.5 km2<br />
52
Annex 2 : Impact Categories for Utility-Scale <strong>Solar</strong> <strong>PV</strong><br />
There is currently no <strong>in</strong>ternational standard for responsible utility-scale <strong>PV</strong><br />
development, construction, and operation, but the follow<strong>in</strong>g table highlights<br />
important areas for evaluation and proactive mitigation. This overview has<br />
been developed as a summary of current and best practices and of guidel<strong>in</strong>es<br />
issued by organizations described above under Electricity <strong>in</strong> <strong>Harmony</strong> <strong>with</strong><br />
nature. The list constitutes the k<strong>in</strong>ds of factors that can arise and should be<br />
addressed when develop<strong>in</strong>g a solar project.<br />
Category Sub-Category Low Score High Score<br />
Dust<br />
Little regard for dust generation, no control efforts<br />
High regard for dust generation, worker education , control methods (palliatives,<br />
focused water use)<br />
Visual<br />
Arrays adjacent to property l<strong>in</strong>es or high traffic roadways; no screen<strong>in</strong>g<br />
or landscap<strong>in</strong>g; night illum<strong>in</strong>ation<br />
Completely out of sight from roads and neighbors<br />
Community<br />
Noise<br />
Stakeholder<br />
Engagement<br />
Equipment backup alarms, post driv<strong>in</strong>g, heavy equipment, close to<br />
property l<strong>in</strong>es or receptors; night work<br />
Little to no engagement<br />
Significant distance buffer; equipment selection; equipment noise shield<strong>in</strong>g;<br />
weekday/daylight hours work only<br />
Active local engagement through community organizations and governments;<br />
local educational or college programs tours; public outreach activities<br />
(meet<strong>in</strong>gs, tours)<br />
Labor<br />
Non-local workers; m<strong>in</strong>imum wage; m<strong>in</strong>imum safety requirements<br />
All local workers; prevail<strong>in</strong>g wage; full personal protective equipment and<br />
extensive safety tra<strong>in</strong><strong>in</strong>g and oversight; maximiz<strong>in</strong>g local economic development<br />
and job creation; focus on aborig<strong>in</strong>al and <strong>in</strong>digenous engagement and<br />
employment<br />
Biology<br />
Species, Plants,<br />
etc.<br />
Environmental<br />
Impact Studies<br />
Design and construction <strong>with</strong> no regard to local biodiversity<br />
Not performed; no awareness of any environmental issues<br />
Detailed surveys conducted; special <strong>in</strong>terests and other stakeholders consulted;<br />
design and construction <strong>with</strong> high regard for biodiversity; appropriate<br />
mitigation measures; ongo<strong>in</strong>g monitor<strong>in</strong>g of impacts; maximiz<strong>in</strong>g buffer<br />
areas around the active site, provid<strong>in</strong>g improved habitat potential, visual<br />
buffer, etc.<br />
Environmental Impact Study /Assessment conducted, mitigation plan developed<br />
<strong>with</strong> stakeholder <strong>in</strong>volvement<br />
Soil Protection<br />
Little regard for protect<strong>in</strong>g the grassland or site soils<br />
Rigorous fire protection plans; topsoil conserved or replaced; adequate seed<strong>in</strong>g<br />
of native grasses; compaction and permeable surfaces support growth<br />
53
<strong>Solar</strong> <strong>PV</strong> <strong>Atlas</strong><br />
Category Sub-Category Low Score High Score<br />
Usage<br />
Little regard for water use<br />
Usage measured and reported; ambitious water reduction goals set; Construction<br />
methods implemented to m<strong>in</strong>imize water use<br />
Water<br />
Storm Water<br />
Little regard for storm water or run-off onto neighbor<strong>in</strong>g properties<br />
Appropriately sized and protected protection and conveyance measures<br />
(retention ponds; rip rap; silt fenc<strong>in</strong>g; etc.), effective measures to counter<br />
stormwater flow and runoff are <strong>in</strong> place; post event performance and condition<br />
assessment<br />
Design<br />
and Construction<br />
Site Selection<br />
Grad<strong>in</strong>g<br />
Prime agricultural, biological, or cultural land used<br />
Heavy cut and fill; stripped topsoil; <strong>in</strong>vasive seeds <strong>in</strong>troduced; longterm<br />
dra<strong>in</strong>age or dust issues<br />
Use of disturbed or previously used sites; superimposed on exist<strong>in</strong>g structures<br />
(roofs, landfills, park<strong>in</strong>g lots, etc.); greenfield or prime agricultural land<br />
avoided, worn agricultural or contam<strong>in</strong>ated land used to restore biodiversity;<br />
consider potential for ‘dual use’ of sites (e.g., agricultural/graz<strong>in</strong>g) – this will<br />
depend on local climate and farm practices<br />
M<strong>in</strong>imiz<strong>in</strong>g grad<strong>in</strong>g, <strong>in</strong>stallation follows exist<strong>in</strong>g topography, m<strong>in</strong>imiz<strong>in</strong>g<br />
built roads/gravel, m<strong>in</strong>imiz<strong>in</strong>g trench<strong>in</strong>g; topsoil reta<strong>in</strong>ed or restored; no<br />
stand<strong>in</strong>g water or dust areas<br />
Footpr<strong>in</strong>t/<br />
Layout<br />
Inefficient use of space<br />
M<strong>in</strong>imize project footpr<strong>in</strong>t <strong>with</strong> careful balance of ground coverage ratio,<br />
row spac<strong>in</strong>g, module height, etc.<br />
End of Life<br />
(EOL)<br />
Site Restoration<br />
Recycl<strong>in</strong>g<br />
No consideration of land restoration after project life<br />
No take-back and recycl<strong>in</strong>g at module EOL offered<br />
Ensure that a site can be restored to its orig<strong>in</strong>al state (or better) at the end of<br />
project’s useful life<br />
Take-back and recycl<strong>in</strong>g of EOL modules and Balance of System products<br />
considered and addressed as part of project development and permitt<strong>in</strong>g<br />
phase<br />
54
Annex 3 : <strong>PV</strong> development example – Desert Sunlight<br />
In the 550MW Desert Sunlight project <strong>in</strong> California, First <strong>Solar</strong><br />
significantly reduced the project footpr<strong>in</strong>t from the orig<strong>in</strong>al<br />
study area of over 19,000 acres to approximately 3,800 acres.<br />
These reductions were based on survey results and advice<br />
from experts <strong>in</strong> a range of discipl<strong>in</strong>es <strong>with</strong> the aim of m<strong>in</strong>imiz<strong>in</strong>g<br />
the biological, cultural, and visual impacts of the project,<br />
<strong>in</strong>clud<strong>in</strong>g avoid<strong>in</strong>g critical habitat for the threatened desert<br />
tortoise. The reductions also m<strong>in</strong>imized impacts to other sensitive<br />
resources such as the P<strong>in</strong>to Wash and sand dunes, known<br />
migration routes for bighorn sheep, areas <strong>with</strong> high concentration<br />
of foxtail cactus, and known cultural resources, <strong>in</strong>clud<strong>in</strong>g<br />
significant prehistoric resources and key elements of General<br />
Patton’s Desert Tra<strong>in</strong><strong>in</strong>g Center. In addition, First <strong>Solar</strong> worked<br />
to improve construction efficiency <strong>with</strong> <strong>in</strong>novative disk and roll<br />
micro grad<strong>in</strong>g site preparation techniques, which led to a reduction<br />
<strong>in</strong> earth movement, result<strong>in</strong>g <strong>in</strong> reduced air emissions and<br />
water use dur<strong>in</strong>g construction associated <strong>with</strong> dust control and<br />
soil preparation. The Sunlight project benefited from extensive<br />
biological and cultural survey efforts and diverse stakeholder<br />
<strong>in</strong>teraction <strong>in</strong>volv<strong>in</strong>g the local County and State agencies, the<br />
US Fish and Wildlife Service, the US Army Corp of Eng<strong>in</strong>eers,<br />
Native American Tribes, and numerous environmental NGOs.<br />
© First <strong>Solar</strong><br />
55
<strong>Solar</strong> <strong>PV</strong> <strong>Atlas</strong><br />
GLOSSARY : solar atlas term<strong>in</strong>ology<br />
ANNEX I SIGNATORY OF THE KYOTO PROTOCOL:<br />
One of a list of 41 developed/<strong>in</strong>dustrialized nations<br />
listed <strong>in</strong> Annex I of the United Nations<br />
Framework Convention on Climate Change<br />
(UNFCCC) which have accepted a greater share<br />
of responsibility for the reduction of greenhouse<br />
gases as signatories of the Kyoto Protocol.<br />
EOL (END-OF-LIFE):<br />
Referr<strong>in</strong>g here to the decommission<strong>in</strong>g of materials<br />
at the end of their useful life <strong>in</strong> a manner<br />
responsible to environmental as well as marketbased<br />
concerns. SEE TAKE BACK.<br />
EPC (ENGINEERING, PROCUREMENT, AND CONSTRUCTION):<br />
“Turnkey” arrangement where<strong>in</strong> a contractor<br />
delivers a completed project to an owner for a<br />
pre-determ<strong>in</strong>ed price. F<strong>in</strong>ancial risks and design<br />
control are shifted to the contractor and away<br />
from the owner.<br />
DNI - Direct Normal Irradiance:<br />
<strong>Solar</strong> radiation that comes <strong>in</strong> a straight l<strong>in</strong>e from<br />
the direction of the sun at its current position <strong>in</strong><br />
the sky. See GHI for further explanation.<br />
DIF - Diffuse Horizontal Irradiance:<br />
<strong>Solar</strong> radiation that does not arrive on a direct<br />
path from the sun, but has been scattered by molecules<br />
and particles <strong>in</strong> the atmosphere and comes<br />
equally from all directions. See GHI for further<br />
expalation.<br />
GHI - GLOBAL HORIZONTAL IRRADIANCE:<br />
The total amount of shortwave radiation received<br />
from above by a surface horizontal to the ground.<br />
This value is of particular <strong>in</strong>terest to photovoltaic<br />
<strong>in</strong>stallations and <strong>in</strong>cludes both Direct Normal<br />
Irradiance (DNI) and Diffuse Horizontal Irradiance<br />
(DIF). DNI is solar radiation that comes <strong>in</strong><br />
a straight l<strong>in</strong>e from the direction of the sun at its<br />
current position <strong>in</strong> the sky. DIF is solar radiation<br />
that does not arrive on a direct path from the sun,<br />
but has been scattered by molecules and particles<br />
<strong>in</strong> the atmosphere and comes equally from all<br />
directions. On a clear day, most of the solar radiation<br />
received by a horizontal surface will be DNI,<br />
while on a cloudy day most will be DIF. More<br />
<strong>in</strong>formation and full def<strong>in</strong>itions are available at<br />
www.3tier.com/en/support/glossary/<br />
GHG - GREENHOUSE GASES:<br />
Natural and manmade gases capable of reflect<strong>in</strong>g<br />
heat back to the surface of the earth, carbon<br />
dioxide, methane, nitrous oxide, sulphur hexafluoride,<br />
hydrofluorocarbons (HFCs), and perfluorocarbons<br />
(PFCs) are specifically mentioned<br />
by the Kyoto Protocol as targets for immediate<br />
reduction.<br />
INSOLATION:<br />
Insolation is solar irradiance dur<strong>in</strong>g a period<br />
of time, measured <strong>in</strong> this atlas as kilowatts per<br />
square meter per day (kWh/m2/day). Compare<br />
to IRRADIANCE.<br />
IPP - INDEPENDENT POWER PRODUCER:<br />
Also, Non-Utility Generator (NUG), an organisation<br />
own<strong>in</strong>g facilities to generate electricity for<br />
sale to utilities or to end users. These organisations<br />
are often granted price guarantees or<br />
protection by a government entity or <strong>in</strong>cumbent<br />
utility.<br />
IRRADIANCE:<br />
<strong>Solar</strong> irradiance refers to the amount of solar<br />
energy reach<strong>in</strong>g a surface. Compare to INSOLA-<br />
TION, and see also GHI.<br />
56
GLOSSARY : solar atlas term<strong>in</strong>ology<br />
LCOE – LEVELISED (or LOCALISED) COST OF ELECTRICITY:<br />
The cost of electricity production <strong>in</strong> standardised<br />
units up to the po<strong>in</strong>t of distribution. Measured <strong>in</strong><br />
Euro/kWh or $/MWh, for example. LCOE is dist<strong>in</strong>ct<br />
from the prices customers pay for electricity<br />
and often does not reflect subsidies or externalities.<br />
O+M - OPERATIONS AND MAINTENANCE:<br />
The performance of duties related to deliver<strong>in</strong>g an<br />
expected service and conduct<strong>in</strong>g preventative and<br />
corrective ma<strong>in</strong>tenance of facilities or equipment.<br />
SUSTAINABLE ENERGY FOR ALL:<br />
The UN Initiative call<strong>in</strong>g for <strong>in</strong>creased renewable<br />
energy, energy efficiency, and universal access.<br />
More <strong>in</strong>formation available at susta<strong>in</strong>ableenergyforall.org<br />
TAKE BACK:<br />
A mandatory or voluntary effort by manufacturers<br />
or retailers to encourage end-users of a product<br />
to transport the product to a collection center for<br />
recycl<strong>in</strong>g, repurpos<strong>in</strong>g, reuse, or reclamation of<br />
components.<br />
<strong>PV</strong> – PHOTOVOLTAIC:<br />
A property of those materials which generate an<br />
electrical current when exposed to light. Sometimes<br />
used as a noun to describe a product or<br />
technology <strong>with</strong> this property.<br />
RE - RENEWABLE ENERGY:<br />
Energy (often electricity) drawn from sources <strong>in</strong><br />
the natural environment which are renewed or<br />
replenished on a regular basis <strong>with</strong>out human<br />
<strong>in</strong>tervention. Examples <strong>in</strong>clude solar photovoltaic,<br />
w<strong>in</strong>d, hydroelectric, geothermal or biomass-based<br />
energy.<br />
57
<strong>Solar</strong> <strong>PV</strong> <strong>Atlas</strong><br />
GLOSSARY : UNITS<br />
KW = KILOWATT:<br />
One thousand (1,000) watts. A measure of power<br />
often referr<strong>in</strong>g to <strong>in</strong>stantaneous peak power generation<br />
or consumption capacity.<br />
MW = MEGAWATT:<br />
One million (1,000,000) watts. A measure of<br />
power often referr<strong>in</strong>g to <strong>in</strong>stantaneous peak<br />
power generation or consumption capacity.<br />
GW = GIGAWATT:<br />
One billion (1,000,000,000) watts. A measure<br />
of power often referr<strong>in</strong>g to <strong>in</strong>stantaneous peak<br />
power generation or consumption capacity.<br />
KWh = KILOWATT-HOUR:<br />
A measure of energy, often used to describe electricity<br />
generation or consumption over time. Ten<br />
(10) light bulbs rated at 100 watts burn<strong>in</strong>g for one<br />
hour consume one kilowatt-hour of electricity.<br />
GWh = GIGAWATT-HOUR:<br />
One billion (1,000,000,000) watt-hours, or one<br />
million (1,000,000) kilowatt-hours.<br />
TWh = TERAWATT-HOUR:<br />
One trillion (1,000,000,000,000) watt-hours, or<br />
one billion (1,000,000,000) kilowatt-hours.<br />
© First <strong>Solar</strong><br />
58
Notes and References:<br />
59<br />
In addition to the resources sited below, several<br />
sources served as foundational contribut<strong>in</strong>g work<br />
to this publication and are recommended as further<br />
read<strong>in</strong>g:<br />
<strong>WWF</strong>. 2010. The Energy Report –<br />
100% Renewable Energy by 2050.<br />
www.panda.org/energyreport<br />
German Renewable Energies Agency. 2010.<br />
ERNEUERBARE ENERGIEN 2020 POTENZI-<br />
ALATLAS DEUTSCHLAND.<br />
REN21. 2012. Renewables Global Status Report.<br />
International Energy Agency. 2010. Technology<br />
Roadmap: <strong>Solar</strong> Photovoltaic Energy.<br />
OECD/IEA, 2011. <strong>Solar</strong> Energy Perspectives.<br />
IRENA. Country reports for selected regions.<br />
REEGLE. Energy profiles for selected regions.<br />
100% Renewable energy by 2050<br />
1. REN21. 2012. Renewables Global Status Report.<br />
2. International Energy Agency. “Technology Roadmap:<br />
<strong>Solar</strong> Photovoltaic Energy” 2010.<br />
3. Ibid.<br />
4. The radiation reach<strong>in</strong>g the earth’s surface can be<br />
represented <strong>in</strong> a number of different ways. Global<br />
Horizontal Irradiance (GHI) is the total amount of<br />
shortwave radiation received from above by a surface<br />
horizontal to the ground. This value is of particular <strong>in</strong>terest<br />
to photovoltaic <strong>in</strong>stallations and <strong>in</strong>cludes both<br />
Direct Normal Irradiance (DNI) and Diffuse Horizontal<br />
Irradiance (DIF). DNI is solar radiation that<br />
comes <strong>in</strong> a straight l<strong>in</strong>e from the direction of the sun<br />
at its current position <strong>in</strong> the sky. DIF is solar radiation<br />
that does not arrive on a direct path from the sun, but<br />
has been scattered by molecules and particles <strong>in</strong> the<br />
atmosphere and comes equally from all directions. On<br />
a clear day, most of the solar radiation received by a<br />
horizontal surface will be DNI, while on a cloudy day<br />
most will be DIF. More <strong>in</strong>formation and full def<strong>in</strong>itions<br />
are available at www.3tier.com/en/support/<br />
glossary/<br />
5. Fthenakis, V. and H. C. Kim. 2009. Land use and<br />
electricity generation: A life-cycle analysis. Renewable<br />
and Susta<strong>in</strong>able Energy Reviews, 13: 1465–1474.<br />
Indonesia<br />
1. The World Bank, Indonesia Data, http://data.worldbank.org/country/<strong>in</strong>donesia<br />
and US Department of<br />
State, Background Note: Indonesia, 2012, http://<br />
www.state.gov/r/pa/ei/bgn/2748.htm<br />
2. M<strong>in</strong>istry of Energy and M<strong>in</strong>eral Resources Republic<br />
Indonesia, Statistik Listrik (Electricity Statistics),<br />
2011, http://prokum.esdm.go.id/Publikasi/Statistik/<br />
Statistik%20Listrik.pdf, p. 2<br />
3. World Bank<br />
4. Mumtazah, Hani, Indonesia’s Natural Wealth: The<br />
Right of a Nation and Her People, http://web.archive.<br />
org/web/20061017034459/http://www.islamonl<strong>in</strong>e.<br />
net/English/Science/2003/05/article13.shtml<br />
5. Reegle. Energy Profile Indonesia, http://www.reegle.<br />
<strong>in</strong>fo/countries/<strong>in</strong>donesia-energy-profile/ID<br />
6. Ibid<br />
7. Ibid<br />
8. Statistik Listrik, p. 3<br />
9. Differ Group, 2012, The Indonesian electricity system–a<br />
brief overview, http://www.differgroup.com/<br />
Portals/53/images/Indonesia_overall_FINAL.pdf, p.<br />
2<br />
10. Ibid, p. 5<br />
11. de Wilde, Antonie. ASTAE, Recent Developments<br />
In the Commercial Market for Renewable Energy <strong>in</strong><br />
Indonesia, p. 3<br />
12. Differ Group, p. 3<br />
13. Ibid, p. 7<br />
14. Reegle<br />
15. de Wilde, p. 5<br />
16. Differ Group, p. 7<br />
17. Reegle
<strong>Solar</strong> <strong>PV</strong> <strong>Atlas</strong><br />
Notes and References:<br />
MADAGASCAR<br />
1. CIA World Factbook, 2011, Madagascar, https://www.cia.gov/library/publications/the-world-factbook/geos/ma.html<br />
2. US State Department, Country Profiles, Madagascar, http://www.state.gov/r/pa/<br />
ei/bgn/5460.htm#profile<br />
3. Source: Eberhard, Anton and others, “Africa’s <strong>Power</strong> Structure Investment–Investment,<br />
Integration, Efficiency”, The World Bank, 2011. CAVEAT: Some <strong>in</strong> the<br />
field believe this figure to be optimistic.<br />
4. Denruyter J-P, et al, December 2010, “Bioenergy <strong>in</strong> Africa–Time for a Shift?”<br />
5. International Monetary Fund, World Economic Outlook Database, September<br />
2011, http://www.imf.org/external/pubs/ft/weo/2011/02/weodata/weorept.asp<br />
x?sy=2009&ey=2016&scsm=1&ssd=1&sort=country&ds=.&br=1&pr1.x=54&pr1.<br />
y=13&c=674&s=TMGO&grp=0&a=<br />
6. International Energy Agency, International Energy Statistics, 2011, www.eia.gov/<br />
cfapps/ipdbproject/IEDIndex3.cfm?tid=2&pid=2&aid=7<br />
7. World Wildlife Fund (<strong>WWF</strong>), Madagascar Energy vision report, November 2010,<br />
p. 23<br />
8. Ibid<br />
9. Hydropower Resource Assessment of Africa,” M<strong>in</strong>isterial Conference on Water<br />
for Agriculture and Energy <strong>in</strong> Africa: The Challenges of Climate Change, 2008.<br />
www.sirtewaterandenergy.org/docs/2009/Sirte_2008_BAK_3.pdf<br />
Madhya Pradesh<br />
1. State profile adopted from Department of Public Relation, Govt. Of Madhya<br />
Pradesh, http://www.mp<strong>in</strong>fo.org/mp<strong>in</strong>fonew/english/factfile/mp.asp<br />
2. Census Of India, www.census<strong>in</strong>dia.gov.<strong>in</strong><br />
3. International Energy Agency, “Electrification Rate by Indian States,” www.iea.<br />
org/country/Poverty_India/Electrification.pdf<br />
4. Internal <strong>WWF</strong> and Government of India documents.<br />
5. Ibid<br />
6. Scheduled Caste and Scheduled Tribe Welfare Department, Govt. of Madhya<br />
Pradesh, www.tribal.mp.gov.<strong>in</strong>Ibid<br />
7. Press Information Bureau, “Per Capita <strong>Power</strong> Consumption,” http://pib.nic.<strong>in</strong>/<br />
newsite/erelease.aspx?relid=74497<br />
8. Government of India Central Electricity Authority, “Energywise Performance<br />
Status All India–Regionwise,” http://www.cea.nic.<strong>in</strong>/reports/monthly/generation_rep/tentative/mar12/opm_16.pdf<br />
9. Madhya Pradesh Electricity Regulatory Commission, “Aggregate Revenue Requirement<br />
and Retail Supply Tariff Order for FY 2012-13,” http://www.mperc.<br />
nic.<strong>in</strong>/310312-F<strong>in</strong>al%20Tariff-Order-FY-12-13.pdf, p. 136 section 7.6<br />
10. Ibid<br />
11. Madhya Pradesh Electricity Regulatory Commission, p. 136 section 7.6<br />
Mexico<br />
1. CIA World Factbook, 2011, Mexico, https://www.cia.gov/library/publications/<br />
the-world-factbook/geos/mx.html<br />
2. Rosas-Flores, J., Rosa-Flores, D., Galvez, D., 2010, Saturation, energy consumption,<br />
CO2 emission and energy efficiency from urban and rural households appliances<br />
<strong>in</strong> Mexico, Energy and Build<strong>in</strong>gs 43, p.10-18<br />
3. CIA<br />
4. Source<br />
5. World Wide Fund For <strong>Nature</strong> (<strong>WWF</strong>), 2011, National and Regional Opportunities<br />
to Scale Up Renewable Energy and Energy Efficiency <strong>in</strong> Mexico. Draft<br />
Report, Mexico<br />
6. García-Frapolli, E., Ramos-Fernández, G.,Galicia, E., Serranod, A., 2008, The<br />
complex reality of biodiversity conservation through Natural Protected Area<br />
policy: Three cases from the Yucatan Pen<strong>in</strong>sula, Mexico, Land Use Policy 26,<br />
p.715-722<br />
7. CFE, Capacidad efectiva <strong>in</strong>stalada por tipo de generación al mes de junio de<br />
60
Notes and References:<br />
2012, Termoeléctrica y Eoloeléctrica, Productores Independientes (http://www.<br />
cfe.gob.mx/QuienesSomos/estadisticas/Pag<strong>in</strong>as/Indicadoresdegeneración.aspx )<br />
8. CFE Generation Statistics (http://www.cfe.gob.mx/QuienesSomos/estadisticas/Pag<strong>in</strong>as/Indicadoresdegeneración.aspx)<br />
9. Mexican Government, Secretaria de Energia (SENER): http://www.sener.gob.<br />
mx/res/380/11_Cifras_relevantes_Nov_11.pdf<br />
10. Mexican Government, Systema de Information Energetica (SIE): http://sie.<br />
energia.gob.mx/sie/bdiController?action=log<strong>in</strong><br />
11. World Bank: http://data.worldbank.org/<strong>in</strong>dicator/EG.USE.ELEC.KH.PC<br />
12. Santoyo-Castelazo, E., Gujba, H., Azapagic, A., 2011. Life cycle assessment of<br />
electricity generation <strong>in</strong> Mexico.Energy 36, p. 1488-1499<br />
13. The W<strong>in</strong>d <strong>Power</strong>, ‘Mexico,’ http://www.thew<strong>in</strong>dpower.net/country_en_36_<br />
mexico.php<br />
14. Stähle, H.J., 2007, Der Wegweiser für <strong>in</strong>ternational Zusammenarbeit und Bildung,<br />
Länderbericht 3, Deutsches Bundesm<strong>in</strong>isterium für Bildung und Forschung,<br />
Internationales Büro des BMBF, Technologiezentrum (VDI), Bonn<br />
15. Asociación Nacional de Energía <strong>Solar</strong>, A.C http://www.anes.org/anes/<strong>in</strong>dex.<br />
php?option=com_wrapper&Itemid=13<br />
Morocco<br />
1. CIA World Fact Book, 2012, https://www.cia.gov/library/publications/theworld-factbook/fields/2043.html<br />
2. Ibid<br />
3. World Bank, Morocco, http://data.worldbank.org/country/morocco<br />
4. In 2003, deforestation was estimated at 31,000 ha per year <strong>in</strong> “Basel<strong>in</strong>e Study<br />
for Morocco, F<strong>in</strong>anc<strong>in</strong>g the Development of Renewable Energy <strong>in</strong> the Mediterranean<br />
Region”, UNEP<br />
5. USAID, “Morroco Biodiversity and Tropical Forestry Assessment” p. 1<br />
6. Programme Energies Renouvelables au Maroc, 2010, ONE Presentation on<br />
November 30, 2010 at DIHK Hotel Sheraton<br />
7. Ibid<br />
8. Ibid<br />
9. Ibid<br />
10. International Energy Agency (IEA), http://www.iea.org/stats/electricitydata.<br />
asp?COUNTRY_CODE=MA<br />
11. Office National de l’Electricité, “Chiffres Clés à f<strong>in</strong> 2010,” www.one.org.ma<br />
12. MED-ENEC, November 2008<br />
13. World Bank, http://data.worldbank.org/<strong>in</strong>dicator/EG.USE.ELEC.KH.PC<br />
14. GTZ report 2009, Energy-policy Framework Conditions for Electricity Markets<br />
and Renewable Energies<br />
South Africa<br />
1. Statistics South Africa, “Mid-year population estimates,” July 27, 2011. Available:<br />
www.statssa.gov.za/publications/P0302/P03022011.pdf<br />
2. CIA World Factbook, 2011, https://www.cia.gov/library/publications/theworld-factbook/geos/sf.html.<br />
3. Statistics South Africa, “Gross domestic product–Third quarter 2011,” www.<br />
statssa.gov.za/publications/P0441/P04413rdQuarter2011.pdf; World Bank,<br />
2011, “Gross National Income per capita, <strong>Atlas</strong> method and PPP,” http://siteresources.worldbank.org/DATASTATISTICS/Resources/GNIPC.pdf<br />
4. IRENA, Department of Energy, Republic of South Africa, “South African Energy<br />
Synopsis–2010,” www.energy.gov.za/files/media/expla<strong>in</strong>ed/2010/South_African_Energy_Synopsis_2010.pdf;<br />
and Department of Energy, Republic of South<br />
Africa, “Integrated Resource Plan for Electricity, 2010-2030–Revision 2,” www.<br />
doe-irp.co.za/content/IRP2010_2030_F<strong>in</strong>al_Report_20110325.pdf; Eskom,<br />
March 2011, “Fact sheets–Pric<strong>in</strong>g and the Incl<strong>in</strong>ed Block Tariff (IBT),” http://<br />
f<strong>in</strong>ancialresults.co.za/2011/eskom_ar2011/fact_sheets_11.php<br />
5. National Plann<strong>in</strong>g Commission, November 11, 2011, “National Development<br />
Plan–Vision for 2030,” www.npconl<strong>in</strong>e.co.za/medialib/downloads/home/<br />
NPC%20National%20Development%20Plan%20Vision%202030%20-lo-res.pdf<br />
61
<strong>Solar</strong> <strong>PV</strong> <strong>Atlas</strong><br />
Notes and References:<br />
6. “Integrated Resource Plan for Electricity, 2010-2030 – Revision 2”, Department<br />
of Energy, Republic of South Africa, p. 15.<br />
7. “Fact sheets – Pric<strong>in</strong>g and the Incl<strong>in</strong>ed Block Tariff (IBT)”, op. cit.<br />
8. Bus<strong>in</strong>ess Live, December 4, 2011 “Zuma endorses SA Renewables Initiative,”<br />
www.bus<strong>in</strong>esslive.co.za/southafrica/2011/12/04/zuma-endorses-sa-renewables<strong>in</strong>itiative<br />
9. Accord<strong>in</strong>g to Statistics South Africa the unemployment rate <strong>in</strong> the 3rd quarter of<br />
2011 was 25%, www.statssa.gov.za/publications/P0211/P02113rdQuarter2011.pdf<br />
10. “National Development Plan – Vision for 2030”, op. cit.<br />
11. Bus<strong>in</strong>ess Live<br />
12. <strong>PV</strong> Magaz<strong>in</strong>e, December 1, 2011 ,“1.2 MW South African <strong>PV</strong> project completed,”<br />
www.pv-magaz<strong>in</strong>e.com/news/details/beitrag/12-mw-south-african-pv-projectcompleted_100005087/;<br />
SABC, December 4, 2011, “Zuma launches South Africa’s<br />
first solar power plant,” www.sabc.co.za/news/a/fdffde00494ce3e9b05bba459b895fbd/Zuma-launches-South-Africa’s-first-solar-power-plant--20111204<br />
13. The figures quoted are from South Africa’s 1st National Communication under<br />
the United Nations Framework Convention on Climate Change (2004), refer to:<br />
De Villers, M.G., Howells, M.I. and Kenny, A.R. 2000. Susta<strong>in</strong>able Energy for<br />
South Africa: Energy Scenarios from 1995 to 2025. Energy Research Institute,<br />
University of Cape Town.<br />
Turkey<br />
1. Turkish Statistical Institute, “The Gross Domestic Product II. Quarter: April,<br />
May, June/2010”, Press Release Number 186, September 12, 2011, www.turkstat.<br />
gov.tr/PreHaberBultenleri.do?id=8586<br />
2. OECD/International Energy Agency (IEA), 2010, “Energy Policies of IEA Countries–Turkey<br />
2009 Review,” http://www.iea.org/textbase/nppdf/free/2009/<br />
turkey2009.pdf<br />
3. Kotkas, Hasan, “Turkish Energy Market – What to expect <strong>in</strong> the near future”,<br />
Energy Market Regulatory Authority, October 18, 2010, www.the-atc.org/events/<br />
c10/presentations/A2-Hasan-Koktas.pdf<br />
4. Enerdata, 2011, “Trends <strong>in</strong> global energy efficiency – Turkey,” www.05.abb.com/<br />
global/scot/scot316.nsf/veritydisplay/bcfe8957cb2c8b2ac12578640051cf04/$fi<br />
le/turkey.pdf<br />
5. Accord<strong>in</strong>g to the Turkish M<strong>in</strong>istry of Energy and Natural Resources, Turkey<br />
imported 97.3% of the natural gas it uses and 1/3 of the coal <strong>in</strong> 2009. The overall<br />
import dependence was measured at 73.1%. M<strong>in</strong>istry of Energy and Natural<br />
Resources, 2009, “Strategic Plan (2010-2014),” http://www.enerji.gov.tr/yay<strong>in</strong>lar_raporlar_EN/ETKB_2010_2014_Stratejik_Plani_EN.pdf<br />
6. State Plann<strong>in</strong>g Organization, May 21, 2009, “Electricity Energy Market and Supply<br />
Security Strategy Paper”<br />
7. The DESERTEC concept aims at promot<strong>in</strong>g the generation of electricity <strong>in</strong><br />
Northern Africa, the Middle East and Europa us<strong>in</strong>g solar power plants, w<strong>in</strong>d<br />
parks and the transmission of this electricity to the consumption centers, promoted<br />
by the non-profit DESERTEC Foundation. It hopes to meet 15% of Europe’s<br />
electricity by 2050. The 400 billion euro project is supported by groups,<br />
<strong>in</strong>clud<strong>in</strong>g Siemens and Deutsche Bank. For more <strong>in</strong>formation: www.desertec.org/<br />
8. The Mediterranean <strong>Solar</strong> Plan aims to create 20 GW worth of new renewable<br />
energy sources by 2020 – the equivalent of around 15 coal-fired power plants.<br />
However, the plan has stalled <strong>in</strong> recent years. http://www.medea.be/en/themes/<br />
euro-mediterranean-cooperation/mediterranean-solar-plan-msp/<br />
9. M<strong>in</strong>istry of Energy and Natural Resources, Strategy Development Unit, April<br />
2010, “2009 Annual Report,” www.enerji.gov.tr/yay<strong>in</strong>lar_raporlar_EN/2009_<br />
Faaliyet_Raporu_EN.pdf<br />
10. Enerji Enstitusu, “Year 2012 Electricity Tariff,” http://enerjienstitusu.<br />
com/2011/01/11/2011-yili-yeni-elektrik-tarifesi/#more-427, Electricity prices<br />
are determ<strong>in</strong>ed by the EPDK for 3 month <strong>in</strong>tervals.<br />
11. Yener, Deniz, World Wildlife Fund (<strong>WWF</strong>), May 4, 2001, “Mediterranean <strong>Solar</strong><br />
Hot Spots–Energy Fact Sheet Turkey”.<br />
12. Ruchser, Matthias, “Op<strong>in</strong>ion: Desertec or Mediterranean <strong>Solar</strong> Plan–whose sun<br />
is sh<strong>in</strong><strong>in</strong>g brighter?,” Deutsche Welle, August 3, 2010, http://www.dw-world.de/<br />
dw/article/0,,5861222,00.html<br />
62
Notes and References:<br />
Electricity <strong>in</strong> <strong>Harmony</strong> <strong>with</strong> <strong>Nature</strong>: Photovoltaics<br />
1. International Energy Agency. “Technology Roadmap: <strong>Solar</strong> Photovoltaic Energy”<br />
2010.<br />
2. Fthenakis, V. and H. C. Kim. 2009. Land use and electricity generation: A lifecycle<br />
analysis. Renewable and Susta<strong>in</strong>able Energy Reviews, 13: 1465–1474.<br />
3. Fthenakis, V., H. C. Kim, and E. Alsema. 2008. “Emissions from Photovoltaic<br />
Life Cycles, “Environ. Sci. Technol., 42 (6), 2168-2174.<br />
4. Macknick, Jordan; Newmark, Rob<strong>in</strong>; Heath, Garv<strong>in</strong> and Hallett, KC. 2011. A<br />
Review of Operational Water Consumption and Withdrawal Factors for Electricity<br />
Generat<strong>in</strong>g Technologies. National Renewable Energy Laboratory Technical<br />
Report NREL/TP-6A20-50900.<br />
5. Fthenakis, V., and Turney, D., Environmental Impacts from the Installation<br />
and Operation of Large-scale <strong>Solar</strong> <strong>Power</strong> Plants’, Renewable and Susta<strong>in</strong>able<br />
Energy Reviews, 15 (2011), 3261-3270.<br />
6. More <strong>in</strong>formation available at www.cdmgoldstandard.org.<br />
7. Comité de Liason Energies Renouvelables (CLER). 2011. Parcs photovoltaïques<br />
au sol : oui mais pas à tout prix et pas n’importe comment, http://www.cler.<br />
org/<strong>in</strong>fo/spip.php?article8429<br />
8. Comité de Liason Energies Renouvelables (CLER). Guide d’évaluation des<br />
projets de parcs solaires au sol - www.cler.org/<strong>in</strong>fo/IMG/pdf/Guide_d_e_valuation_FINAL_2-2.pdf<br />
3. For consistency <strong>with</strong> the Ecofys calculations, these figures were pulled from<br />
Population Division of the Department of Economic and Social Affairs of the<br />
United Nations Secretariat, World Population Prospects: The 2006 Revision<br />
and World Urbanization Prospects: The 2007 Revision, http://esa.un.org/<br />
unup, Tuesday, June 05, 2012; 4:43:45 AM.<br />
4. For countries, these figures were pulled from Population Division of the Department<br />
of Economic and Social Affairs of the United Nations Secretariat,World<br />
Population Prospects: The 2010 Revision, http://esa.un.org/unpd/wpp/<strong>in</strong>dex.<br />
htm. For Madhya Pradesh, these figures were extrapolated: Decadal Growth<br />
Rate of MP is 17.64% as per the latest census <strong>in</strong> 2011- http://censusmp.gov.<strong>in</strong>/<br />
censusmp/pdfs/Press-Release-Paper-1-04April2011.pdf<br />
Annexes<br />
1. This derat<strong>in</strong>g methodology is consistent <strong>with</strong> practices established <strong>in</strong> “ER-<br />
NEUERBARE ENERGIEN 2020 POTENZIALATLAS DEUTSCHLAND” Published<br />
by the German Renewable Energies Agency, December 2010 www.<br />
unendlich-viel-energie.de<br />
2. <strong>WWF</strong> Energy Report, Part 2 – The Ecofys Energy Scenario, 2010. Page 231.<br />
63
www.panda.org/energyreport<br />
© 1986 Panda Symbol <strong>WWF</strong>-World Wide Fund For <strong>Nature</strong> (Formerly World Wildlife Fund)<br />
© “<strong>WWF</strong>” is a <strong>WWF</strong> Registered Trademark. <strong>PV</strong> fill photo © First <strong>Solar</strong>.<br />
<strong>WWF</strong>, Avenue du Mont-Blanc, 1196 Gland, Switzerland<br />
Tel. +41 22 364 9111; Fax +41 22 364 0332<br />
For further <strong>in</strong>formation, please visit the <strong>in</strong>ternational website at panda.org.