Oregon Public School Transportation Funding - The Chalkboard ...
Oregon Public School Transportation Funding - The Chalkboard ...
Oregon Public School Transportation Funding - The Chalkboard ...

You also want an ePaper? Increase the reach of your titles
YUMPU automatically turns print PDFs into web optimized ePapers that Google loves.
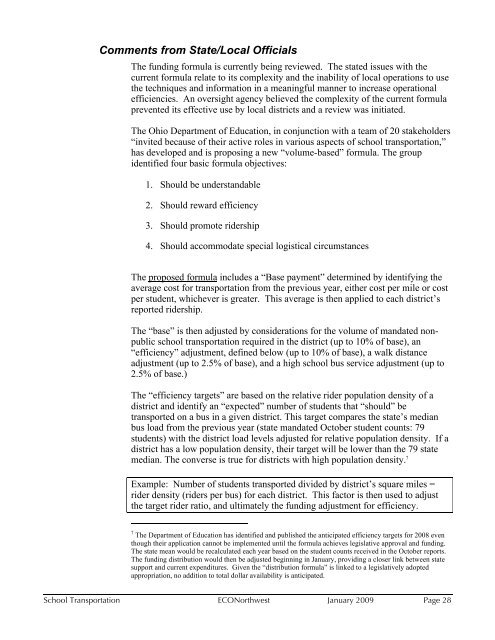
Comments from State/Local Officials<br />
<strong>The</strong> funding formula is currently being reviewed. <strong>The</strong> stated issues with the<br />
current formula relate to its complexity and the inability of local operations to use<br />
the techniques and information in a meaningful manner to increase operational<br />
efficiencies. An oversight agency believed the complexity of the current formula<br />
prevented its effective use by local districts and a review was initiated.<br />
<strong>The</strong> Ohio Department of Education, in conjunction with a team of 20 stakeholders<br />
“invited because of their active roles in various aspects of school transportation,”<br />
has developed and is proposing a new “volume-based” formula. <strong>The</strong> group<br />
identified four basic formula objectives:<br />
1. Should be understandable<br />
2. Should reward efficiency<br />
3. Should promote ridership<br />
4. Should accommodate special logistical circumstances<br />
<strong>The</strong> proposed formula includes a “Base payment” determined by identifying the<br />
average cost for transportation from the previous year, either cost per mile or cost<br />
per student, whichever is greater. This average is then applied to each district’s<br />
reported ridership.<br />
<strong>The</strong> “base” is then adjusted by considerations for the volume of mandated nonpublic<br />
school transportation required in the district (up to 10% of base), an<br />
“efficiency” adjustment, defined below (up to 10% of base), a walk distance<br />
adjustment (up to 2.5% of base), and a high school bus service adjustment (up to<br />
2.5% of base.)<br />
<strong>The</strong> “efficiency targets” are based on the relative rider population density of a<br />
district and identify an “expected” number of students that “should” be<br />
transported on a bus in a given district. This target compares the state’s median<br />
bus load from the previous year (state mandated October student counts: 79<br />
students) with the district load levels adjusted for relative population density. If a<br />
district has a low population density, their target will be lower than the 79 state<br />
median. <strong>The</strong> converse is true for districts with high population density. 7<br />
Example: Number of students transported divided by district’s square miles =<br />
rider density (riders per bus) for each district. This factor is then used to adjust<br />
the target rider ratio, and ultimately the funding adjustment for efficiency.<br />
7 <strong>The</strong> Department of Education has identified and published the anticipated efficiency targets for 2008 even<br />
though their application cannot be implemented until the formula achieves legislative approval and funding.<br />
<strong>The</strong> state mean would be recalculated each year based on the student counts received in the October reports.<br />
<strong>The</strong> funding distribution would then be adjusted beginning in January, providing a closer link between state<br />
support and current expenditures. Given the “distribution formula” is linked to a legislatively adopted<br />
appropriation, no addition to total dollar availability is anticipated.<br />
<strong>School</strong> <strong>Transportation</strong> ECONorthwest January 2009 Page 28