Oregon Public School Transportation Funding - The Chalkboard ...
Oregon Public School Transportation Funding - The Chalkboard ...
Oregon Public School Transportation Funding - The Chalkboard ...
You also want an ePaper? Increase the reach of your titles
YUMPU automatically turns print PDFs into web optimized ePapers that Google loves.
Results of the Frontier Cost Function<br />
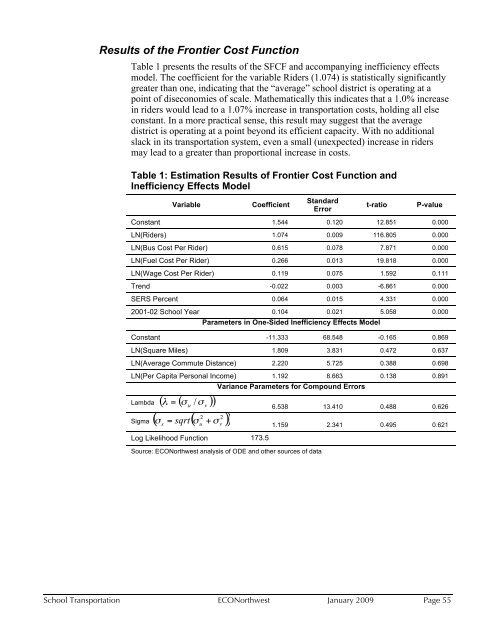
Table 1 presents the results of the SFCF and accompanying inefficiency effects<br />
model. <strong>The</strong> coefficient for the variable Riders (1.074) is statistically significantly<br />
greater than one, indicating that the “average” school district is operating at a<br />
point of diseconomies of scale. Mathematically this indicates that a 1.0% increase<br />
in riders would lead to a 1.07% increase in transportation costs, holding all else<br />
constant. In a more practical sense, this result may suggest that the average<br />
district is operating at a point beyond its efficient capacity. With no additional<br />
slack in its transportation system, even a small (unexpected) increase in riders<br />
may lead to a greater than proportional increase in costs.<br />
Table 1: Estimation Results of Frontier Cost Function and<br />
Inefficiency Effects Model<br />
Variable<br />
Coefficient<br />
Standard<br />
Error<br />
t-ratio<br />
P-value<br />
Constant 1.544 0.120 12.851 0.000<br />
LN(Riders) 1.074 0.009 116.805 0.000<br />
LN(Bus Cost Per Rider) 0.615 0.078 7.871 0.000<br />
LN(Fuel Cost Per Rider) 0.266 0.013 19.818 0.000<br />
LN(Wage Cost Per Rider) 0.119 0.075 1.592 0.111<br />
Trend -0.022 0.003 -6.861 0.000<br />
SERS Percent 0.064 0.015 4.331 0.000<br />
2001-02 <strong>School</strong> Year 0.104 0.021 5.058 0.000<br />
Parameters in One-Sided Inefficiency Effects Model<br />
Constant -11.333 68.548 -0.165 0.869<br />
LN(Square Miles) 1.809 3.831 0.472 0.637<br />
LN(Average Commute Distance) 2.220 5.725 0.388 0.698<br />
LN(Per Capita Personal Income) 1.192 8.663 0.138 0.891<br />
Variance Parameters for Compound Errors<br />
Lambda<br />
Sigma<br />
6.538 13.410 0.488 0.626<br />
1.159 2.341 0.495 0.621<br />
Log Likelihood Function 173.5<br />
Source: ECONorthwest analysis of ODE and other sources of data<br />
<strong>School</strong> <strong>Transportation</strong> ECONorthwest January 2009 Page 55


