PUBLIC EXPOSE - Indocement Tunggal Prakarsa, PT.
PUBLIC EXPOSE - Indocement Tunggal Prakarsa, PT.
PUBLIC EXPOSE - Indocement Tunggal Prakarsa, PT.

You also want an ePaper? Increase the reach of your titles
YUMPU automatically turns print PDFs into web optimized ePapers that Google loves.
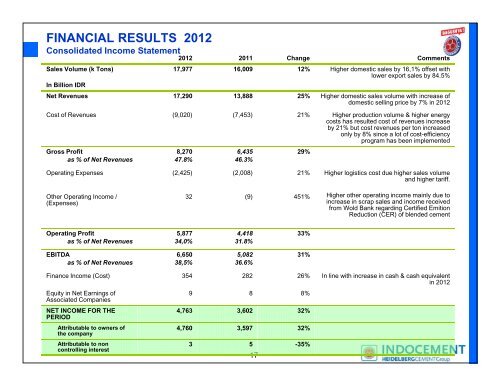
FINANCIAL RESULTS 2012<br />
Consolidated Income Statement<br />
2012 2011 Change Comments<br />
Sales Volume (k Tons)<br />
In Billion IDR<br />
17,977 16,009 12% Higher domestic sales by 16,1% offset with<br />
lower export sales by 84.5%<br />
Net Revenues 17,290 13,888 25% Higher domestic sales volume with increase of<br />
domestic selling price by 7% in 2012<br />
Cost of Revenues (9,020) (7,453) 21% Higher production volume & higher energy<br />
costs has resulted cost of revenues increase<br />
by 21% but cost revenues per ton increased<br />
only by 8% since a lot of cost-efficiency<br />
program has been implemented<br />
Gross Profit<br />
as % of Net Revenues<br />
8,270<br />
47.8%<br />
6,435<br />
46.3%<br />
29%<br />
Operating Expenses<br />
(2,425)<br />
(2,008)<br />
21%<br />
Higher logistics cost due higher sales volume<br />
and higher tariff.<br />
Other Operating Income /<br />
(Expenses)<br />
32<br />
(9)<br />
451%<br />
Higher other operating income mainly due to<br />
increase in scrap sales and income received<br />
from Wold Bank regarding Certified Emition<br />
Reduction (CER) of blended cement<br />
Operating Profit<br />
as % of Net Revenues<br />
5,877<br />
34,0%<br />
4,418<br />
31.8%<br />
33%<br />
EBITDA<br />
as % of Net Revenues<br />
6,650<br />
38,5%<br />
5,082<br />
36.6%<br />
31%<br />
Finance Income (Cost) 354 282 26% In line with increase in cash & cash equivalent<br />
in 2012<br />
Equity in Net Earnings of<br />
9 8 8%<br />
Associated Companies<br />
NET INCOME FOR THE<br />
PERIOD<br />
4,763 3,602 32%<br />
Attributable to owners of<br />
the company<br />
Attributable to non<br />
controlling interest<br />
4,760 3,597 32%<br />
3 5 -35%<br />
17