Understanding FCAT Reports 2005 - Bureau of K-12 Assessment ...
Understanding FCAT Reports 2005 - Bureau of K-12 Assessment ...
Understanding FCAT Reports 2005 - Bureau of K-12 Assessment ...

You also want an ePaper? Increase the reach of your titles
YUMPU automatically turns print PDFs into web optimized ePapers that Google loves.
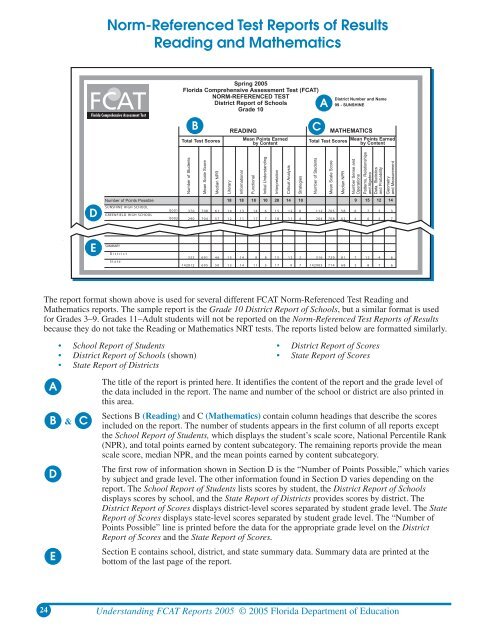
Norm-Referenced Test <strong>Reports</strong> <strong>of</strong> Results<br />
Reading and Mathematics<br />
Spring <strong>2005</strong><br />
Florida Comprehensive <strong>Assessment</strong> Test (<strong>FCAT</strong>)<br />
NORM-REFERENCED TEST<br />
District Report <strong>of</strong> Schools<br />
Grade 10<br />
B<br />
Total Test Scores<br />
READING<br />
Mean Points Earned<br />
by Content<br />
C<br />
A<br />
Total Test Scores<br />
District Number and Name<br />
99 - SUNSHINE<br />
MATHEMATICS<br />
Mean Points Earned<br />
by Content<br />
Number <strong>of</strong> Students<br />
Mean Scale Score<br />
Median NPR<br />
Literary<br />
Informational<br />
Functional<br />
Initial <strong>Understanding</strong><br />
Interpretation<br />
Critical Analysis<br />
Strategies<br />
Number <strong>of</strong> Students<br />
Mean Scale Score<br />
Median NPR<br />
Number Sense and<br />
Operations<br />
Patterns, Relationships<br />
and Algebra<br />
Data, Statistics<br />
and Probability<br />
Geometry<br />
and Measurement<br />
D<br />
Number <strong>of</strong> Points Possible 18 18 18 10 20 14 10 9 15<br />
SUNSHINE HIGH SCHOOL<br />
0001 370 708 61<br />
GREENFIELD HIGH SCHOOL<br />
0002 290 704 57<br />
14 13 14<br />
<strong>12</strong> 11 17<br />
6 15 <strong>12</strong><br />
7 18 11<br />
8<br />
1<strong>12</strong> 705 58 6 7<br />
4<br />
204 708 62 4 6<br />
<strong>12</strong><br />
5<br />
5<br />
14<br />
3<br />
7<br />
E<br />
SUMMARY<br />
District<br />
State<br />
322<br />
1428<strong>12</strong><br />
691<br />
695<br />
46<br />
50<br />
15<br />
13<br />
14<br />
14<br />
8<br />
11<br />
8<br />
5<br />
15<br />
17<br />
<strong>12</strong><br />
9<br />
2<br />
7<br />
316<br />
142905<br />
729<br />
714<br />
81<br />
68<br />
7<br />
3<br />
<strong>12</strong><br />
8<br />
4<br />
7<br />
6<br />
6<br />
The report format shown above is used for several different <strong>FCAT</strong> Norm-Referenced Test Reading and<br />
Mathematics reports. The sample report is the Grade 10 District Report <strong>of</strong> Schools, but a similar format is used<br />
for Grades 3–9. Grades 11–Adult students will not be reported on the Norm-Referenced Test <strong>Reports</strong> <strong>of</strong> Results<br />
because they do not take the Reading or Mathematics NRT tests. The reports listed below are formatted similarly.<br />
• School Report <strong>of</strong> Students • District Report <strong>of</strong> Scores<br />
• District Report <strong>of</strong> Schools (shown) • State Report <strong>of</strong> Scores<br />
• State Report <strong>of</strong> Districts<br />
A<br />
B & C<br />
D<br />
E<br />
The title <strong>of</strong> the report is printed here. It identifies the content <strong>of</strong> the report and the grade level <strong>of</strong><br />
the data included in the report. The name and number <strong>of</strong> the school or district are also printed in<br />
this area.<br />
Sections B (Reading) and C (Mathematics) contain column headings that describe the scores<br />
included on the report. The number <strong>of</strong> students appears in the first column <strong>of</strong> all reports except<br />
the School Report <strong>of</strong> Students, which displays the student’s scale score, National Percentile Rank<br />
(NPR), and total points earned by content subcategory. The remaining reports provide the mean<br />
scale score, median NPR, and the mean points earned by content subcategory.<br />
The first row <strong>of</strong> information shown in Section D is the “Number <strong>of</strong> Points Possible,” which varies<br />
by subject and grade level. The other information found in Section D varies depending on the<br />
report. The School Report <strong>of</strong> Students lists scores by student, the District Report <strong>of</strong> Schools<br />
displays scores by school, and the State Report <strong>of</strong> Districts provides scores by district. The<br />
District Report <strong>of</strong> Scores displays district-level scores separated by student grade level. The State<br />
Report <strong>of</strong> Scores displays state-level scores separated by student grade level. The “Number <strong>of</strong><br />
Points Possible” line is printed before the data for the appropriate grade level on the District<br />
Report <strong>of</strong> Scores and the State Report <strong>of</strong> Scores.<br />
Section E contains school, district, and state summary data. Summary data are printed at the<br />
bottom <strong>of</strong> the last page <strong>of</strong> the report.<br />
24 <strong>Understanding</strong> <strong>FCAT</strong> <strong>Reports</strong> <strong>2005</strong> © <strong>2005</strong> Florida Department <strong>of</strong> Education