Understanding FCAT Reports 2005 - Bureau of K-12 Assessment ...
Understanding FCAT Reports 2005 - Bureau of K-12 Assessment ...
Understanding FCAT Reports 2005 - Bureau of K-12 Assessment ...

Create successful ePaper yourself
Turn your PDF publications into a flip-book with our unique Google optimized e-Paper software.
Sunshine State Standards Demographic <strong>Reports</strong><br />
Reading, Mathematics, and Science<br />
Florida Comprehensive <strong>Assessment</strong> Test<br />
B<br />
Spring <strong>2005</strong><br />
Florida Comprehensive <strong>Assessment</strong> Test (<strong>FCAT</strong>)<br />
SUNSHINE STATE STANDARDS<br />
District Demographic Report<br />
Grade 10<br />
READING<br />
Total Test Scores<br />
Percent in Each<br />
Achievement Level<br />
Mean<br />
Points<br />
Earned<br />
C<br />
A<br />
District Number and Name<br />
99 - SUNSHINE<br />
MATHEMATICS<br />
Total Test Scores<br />
Percent in Each<br />
Achievement Level<br />
Mean<br />
Points<br />
Earned<br />
Number <strong>of</strong> Students<br />
Mean Developmental<br />
Scale Score (0-3000)<br />
Mean Scale Score<br />
(100-500)<br />
Percent Passing<br />
Percent In Achievement<br />
Levels 3 -5<br />
Words/Phrases<br />
Main Idea/Purpose<br />
Comparisons<br />
Reference/Research<br />
Number <strong>of</strong> Students<br />
Mean Developmental<br />
Scale Score (0-3000)<br />
Mean Scale Score<br />
(100-500)<br />
Percent Passing<br />
Number Sense<br />
Measurement<br />
Geometry<br />
Algebraic Thinking<br />
Data Analysis<br />
1 2 3 4 5<br />
1 2 3 4 5<br />
Number <strong>of</strong> Points Possible 7 20 10 14 11 10 14 14 11<br />
RACIAL/ETHNIC/GENDER<br />
Percent In Achievement<br />
Levels 3 -5<br />
White 106 2015 316 67 19 34 27 10 10 61 5 10 9 10 111 2034 327 80 13 19 31 27 10 71 7 6 7 8 6<br />
Black 95 2021 320 63 25 31 23 8 <strong>12</strong> 72 6 8 8 11 92 2030 324 79 15 21 30 25 9 69 7 5 7 8 6<br />
D<br />
Hispanic 78 2007 311 66 24 35 23 10 8 63 5 9 8 10 81 2019 317 71 20 22 26 25 7 68 6 5 7 8 6<br />
Asian/Pacific Islander 8 * * * * * * * * * * * * * 9 * * * * * * * * * * * * * *<br />
American Indian/Alaskan<br />
SUMMARY<br />
District 387 2007 311 64 26 35 23 8 8 58 5 10 8 9 401 2060 326 78 14 20 27 30 9 67 7 5 7 8 6<br />
E<br />
State 146581 1981 303 59 32 33 21 8 7 70 6 9 8 8 149311 2021 319 73 19 21 25 27 8 65 6 5 7 8 6<br />
DM10RM<br />
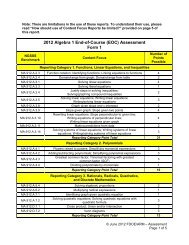
The report format shown on this page is used for the <strong>FCAT</strong> Sunshine State Standards Reading, Mathematics, and<br />
Science school, district, and state reports <strong>of</strong> demographic results. The demographic results for Reading and<br />
Mathematics appear on one report, and the demographic results for Science appear on a separate report. A sample<br />
<strong>of</strong> the Grade 10 Reading and Mathematics Demographic Report is shown above. A similar format is used for the<br />
Reading and Mathematics reports at Grades 3–9 and 11–Adult and the Science reports at Grades 5, 8, and 11.<br />
(The Reading and Mathematics demographic reports for Grades 3–9 and the Science demographic reports do not<br />
contain the “Percent Passing” column.)<br />
A<br />
B & C<br />
D<br />
E<br />
The title <strong>of</strong> the report is printed here. It identifies the content <strong>of</strong> the report and the grade level <strong>of</strong><br />
the data included in the report. The name and number <strong>of</strong> the school or district are also printed<br />
here.<br />
Sections B (Reading) and C (Mathematics) contain column headings that describe the scores<br />
included on the report. The number <strong>of</strong> students appears in the first column. The “Percent<br />
Passing” column indicates the percentage <strong>of</strong> students who earned a passing score in that subject.<br />
This column appears only on the Reading and Mathematics reports for Grades 10–Adult. The<br />
“Mean Developmental Scale Score” is provided in the second column. The “Mean Scale Score”<br />
is provided in the third column. The percent <strong>of</strong> students who scored in each <strong>of</strong> the five<br />
achievement levels and the “Mean Points Earned” in each content subcategory are also provided.<br />
The first row <strong>of</strong> information shown in Section D is the “Number <strong>of</strong> Points Possible” in each<br />
content area. The number <strong>of</strong> points possible may vary by grade level. The other categories listed<br />
in Section D are the demographic groups for which <strong>FCAT</strong> data are disaggregated. The<br />
disaggregated data included in these reports are based on information gathered from the FTE<br />
survey. Data on the demographic reports are disaggregated for racial/ethnic categories, gender,<br />
and other special categories. The Special Categories group includes standard curriculum, limited<br />
English pr<strong>of</strong>icient (LEP), migrant, Section 504, free or reduced lunch, not free or reduced lunch,<br />
total ESE other than gifted, not ESE plus gifted, exceptional student education classifications<br />
(ESE), and students not matched to the enrollment file.<br />
Section E contains school, district, and state summary data.<br />
<strong>Understanding</strong> <strong>FCAT</strong> <strong>Reports</strong> <strong>2005</strong> © <strong>2005</strong> Florida Department <strong>of</strong> Education<br />
27