Understanding FCAT Reports 2005 - Bureau of K-12 Assessment ...
Understanding FCAT Reports 2005 - Bureau of K-12 Assessment ...
Understanding FCAT Reports 2005 - Bureau of K-12 Assessment ...

Create successful ePaper yourself
Turn your PDF publications into a flip-book with our unique Google optimized e-Paper software.
Norm-Referenced Test Demographic <strong>Reports</strong><br />
Reading and Mathematics<br />
Spring <strong>2005</strong><br />
Florida Comprehensive <strong>Assessment</strong> Test (<strong>FCAT</strong>)<br />
NORM-REFERENCED TEST<br />
District Demographic Report<br />
Grade 10<br />
B<br />
Total Test Scores<br />
READING<br />
Mean Points Earned<br />
by Content<br />
A<br />
C<br />
Total Test Scores<br />
District Number and Name<br />
99 - SUNSHINE<br />
MATHEMATICS<br />
Mean Points Earned<br />
by Content<br />
RACIAL/ETHNIC/GENDER<br />
White<br />
Black<br />
Hispanic<br />
Number <strong>of</strong> Students<br />
370<br />
290<br />
359<br />
D<br />
Mean Scale Score<br />
707<br />
698<br />
693<br />
Median NPR<br />
61<br />
53<br />
46<br />
Literary<br />
Number <strong>of</strong> Points Possible 18 18 18 10 20 14 10 9 15<br />
16<br />
14<br />
15<br />
Informational<br />
13<br />
14<br />
17<br />
Functional<br />
<strong>12</strong><br />
11<br />
5<br />
Initial <strong>Understanding</strong><br />
8<br />
6<br />
7<br />
Interpretation<br />
13<br />
16<br />
14<br />
Critical Analysis<br />
10<br />
13<br />
11<br />
Strategies<br />
10<br />
4<br />
5<br />
Number <strong>of</strong> Students<br />
370<br />
290<br />
359<br />
Mean Scale Score<br />
724<br />
713<br />
Median NPR<br />
76<br />
68<br />
Number Sense and<br />
Operations<br />
7<br />
8<br />
Patterns, Relationships<br />
and Algebra<br />
Data, Statistics<br />
and Probability<br />
714 68 6 6 6 6<br />
8<br />
4<br />
<strong>12</strong><br />
9<br />
6<br />
Geometry<br />
and Measurement<br />
14<br />
3<br />
6<br />
SUMMARY<br />
District<br />
State<br />
E<br />
<strong>12</strong>69<br />
144781<br />
700<br />
695<br />
53<br />
50<br />
13<br />
<strong>12</strong><br />
14<br />
11<br />
<strong>12</strong><br />
15<br />
10<br />
9<br />
9<br />
10<br />
11<br />
9<br />
9<br />
10<br />
1314<br />
144596<br />
704<br />
710<br />
58<br />
65<br />
5<br />
6<br />
6<br />
4<br />
4<br />
5<br />
6<br />
8<br />
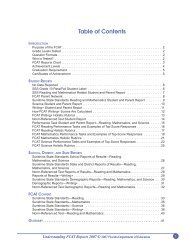
The report format shown on this page is used for the <strong>FCAT</strong> Reading and Mathematics Norm-Referenced school,<br />
district, and state reports <strong>of</strong> demographic results. A sample <strong>of</strong> the Grade 10 Reading and Mathematics NRT<br />
District Demographic Report is shown above. A similar format is used for Grades 3-9. NRT demographic reports<br />
for Grades 11-Adult students are not produced, because they do not take this portion <strong>of</strong> the test.<br />
A<br />
B<br />
D<br />
E<br />
& C<br />
The title <strong>of</strong> the report is printed here. It identifies the grade level <strong>of</strong> the data included in the<br />
report. The name and number <strong>of</strong> the school or district are also printed here.<br />
Sections B (Reading) and C (Mathematics) contain column headings that describe the scores<br />
included on the report. The number <strong>of</strong> students appears in the first column. The mean scale score<br />
is provided, followed by the median national percentile rank (NPR) instead <strong>of</strong> the mean, because<br />
the arithmetic operations required to obtain the mean are inappropriate with NPR scores. These<br />
scores are followed by the mean points earned in each content area. The content subcategories<br />
vary by grade level. There are two grade-level groupings for the NRT content subcategories: 3-8<br />
and 9-10. For a description <strong>of</strong> the content subcategories for each grade-level grouping, see<br />
page 36.<br />
The first row <strong>of</strong> information shown in Section D is the number <strong>of</strong> points possible in each content<br />
area. The number <strong>of</strong> points possible may vary by grade level. The other categories listed in<br />
Section D are the demographic groups for which <strong>FCAT</strong> data are disaggregated. The<br />
disaggregated data included in these reports are based on information gathered from the FTE<br />
survey. Data on the demographic reports are disaggregated for racial/ethnic, gender, and other<br />
special categories. The Special Categories group includes standard curriculum, limited English<br />
pr<strong>of</strong>icient (LEP), migrant, Section 504, free or reduced lunch, not free or reduced lunch, total<br />
ESE other than gifted, not ESE plus gifted, exceptional student education (ESE) classifications,<br />
and students not matched to the enrollment file.<br />
Section E contains school, district, and state summary data.<br />
<strong>Understanding</strong> <strong>FCAT</strong> <strong>Reports</strong> <strong>2005</strong> © <strong>2005</strong> Florida Department <strong>of</strong> Education<br />
29