Understanding FCAT Reports 2005 - Bureau of K-12 Assessment ...
Understanding FCAT Reports 2005 - Bureau of K-12 Assessment ...
Understanding FCAT Reports 2005 - Bureau of K-12 Assessment ...

You also want an ePaper? Increase the reach of your titles
YUMPU automatically turns print PDFs into web optimized ePapers that Google loves.
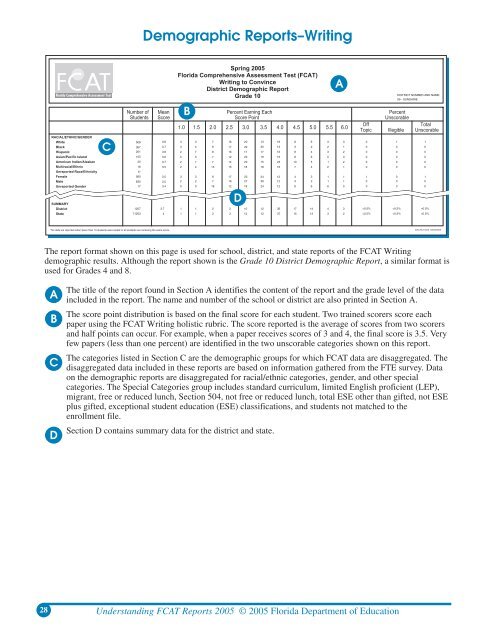
Demographic <strong>Reports</strong>–Writing<br />
Florida Comprehensive <strong>Assessment</strong> Test<br />
RACIAL/ETHNIC/GENDER<br />
White<br />
Black<br />
Hispanic<br />
Asian/Pacific Island<br />
American Indian/Alaskan<br />
Multiracial/Ethnic<br />
Unreported Race/Ethnicity<br />
Female<br />
Male<br />
Unreported Gender<br />
SUMMARY<br />
District<br />
State<br />
C<br />
Spring <strong>2005</strong><br />
Florida Comprehensive <strong>Assessment</strong> Test (<strong>FCAT</strong>)<br />
Writing to Convince<br />
District Demographic Report<br />
Grade 10<br />
B<br />
Number <strong>of</strong> Mean Percent Earning Each Percent<br />
Students Score Score Point Unscorable<br />
1.0 1.5 2.0 2.5 3.0 3.5 4.0 4.5 5.0 5.5 6.0<br />
Off<br />
Topic Illegible<br />
D<br />
A<br />
Total<br />
Unscorable<br />
Data Run Date: 03/03/<strong>2005</strong><br />
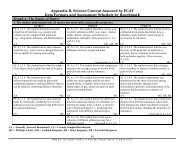
The report format shown on this page is used for school, district, and state reports <strong>of</strong> the <strong>FCAT</strong> Writing<br />
demographic results. Although the report shown is the Grade 10 District Demographic Report, a similar format is<br />
used for Grades 4 and 8.<br />
The title <strong>of</strong> the report found in Section A identifies the content <strong>of</strong> the report and the grade level <strong>of</strong> the data<br />
A included in the report. The name and number <strong>of</strong> the school or district are also printed in Section A.<br />
B<br />
C<br />
D<br />
The score point distribution is based on the final score for each student. Two trained scorers score each<br />
paper using the <strong>FCAT</strong> Writing holistic rubric. The score reported is the average <strong>of</strong> scores from two scorers<br />
and half points can occur. For example, when a paper receives scores <strong>of</strong> 3 and 4, the final score is 3.5. Very<br />
few papers (less than one percent) are identified in the two unscorable categories shown on this report.<br />
The categories listed in Section C are the demographic groups for which <strong>FCAT</strong> data are disaggregated. The<br />
disaggregated data included in these reports are based on information gathered from the FTE survey. Data<br />
on the demographic reports are disaggregated for racial/ethnic categories, gender, and other special<br />
categories. The Special Categories group includes standard curriculum, limited English pr<strong>of</strong>icient (LEP),<br />
migrant, free or reduced lunch, Section 504, not free or reduced lunch, total ESE other than gifted, not ESE<br />
plus gifted, exceptional student education (ESE) classifications, and students not matched to the<br />
enrollment file.<br />
Section D contains summary data for the district and state.<br />
28 <strong>Understanding</strong> <strong>FCAT</strong> <strong>Reports</strong> <strong>2005</strong> © <strong>2005</strong> Florida Department <strong>of</strong> Education