Patterns, Functions and Algebra
Patterns, Functions and Algebra
Patterns, Functions and Algebra

Create successful ePaper yourself
Turn your PDF publications into a flip-book with our unique Google optimized e-Paper software.
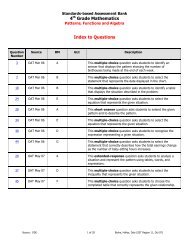
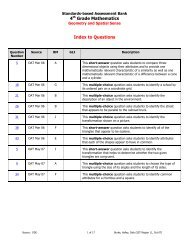
St<strong>and</strong>ards-based Assessment Bank<br />
5 th Grade Mathematics<br />
<strong>Patterns</strong>, <strong>Functions</strong> <strong>and</strong> <strong>Algebra</strong><br />
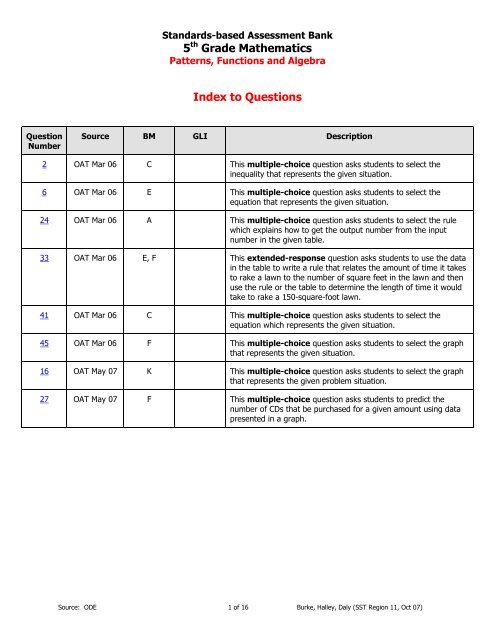
Index to Questions<br />
Question<br />
Number<br />
Source BM GLI Description<br />
2 OAT Mar 06 C This multiple-choice question asks students to select the<br />
inequality that represents the given situation.<br />
6 OAT Mar 06 E This multiple-choice question asks students to select the<br />
equation that represents the given situation.<br />
24 OAT Mar 06 A This multiple-choice question asks students to select the rule<br />
which explains how to get the output number from the input<br />
number in the given table.<br />
33 OAT Mar 06 E, F This extended-response question asks students to use the data<br />
in the table to write a rule that relates the amount of time it takes<br />
to rake a lawn to the number of square feet in the lawn <strong>and</strong> then<br />
use the rule or the table to determine the length of time it would<br />
take to rake a 150-square-foot lawn.<br />
41 OAT Mar 06 C This multiple-choice question asks students to select the<br />
equation which represents the given situation.<br />
45 OAT Mar 06 F This multiple-choice question asks students to select the graph<br />
that represents the given situation.<br />
16 OAT May 07 K This multiple-choice question asks students to select the graph<br />
that represents the given problem situation.<br />
27 OAT May 07 F This multiple-choice question asks students to predict the<br />
number of CDs that be purchased for a given amount using data<br />
presented in a graph.<br />
Source: ODE 1 of 16 Burke, Halley, Daly (SST Region 11, Oct 07)
St<strong>and</strong>ards-based Assessment Bank<br />
5 th Grade Mathematics<br />
<strong>Patterns</strong>, <strong>Functions</strong> <strong>and</strong> <strong>Algebra</strong><br />
Benchmark:<br />
C<br />
Use variables to create <strong>and</strong> solve equations <strong>and</strong> inequalities representing<br />
problem situations.<br />
GLI:<br />
Multiple Choice Question:<br />
2. Roberto had $20. He bought a soccer ball that cost m dollars. He now has less than $5<br />
left.<br />
Which inequality represents this situation?<br />
A. 20 – m < 5<br />
B. 20 – m > 5<br />
C. m – 20 < 5<br />
D. m – 20 > 5<br />
Commentary:<br />
This multiple-choice question asks students to select the inequality that represents the given<br />
situation. Students need to select the inequality that shows subtracting the cost of the soccer<br />
ball, m, from the original amount, $20, resulting in an amount that is less than $5. Answer<br />
choice A is the inequality that represents the situation. Answer choice B shows the amount left<br />
being greater than $5. In answer choices C <strong>and</strong> D, the original amount ($20) is subtracted from<br />
the cost of the soccer ball.<br />
The complexity level of this question is Low Complexity. This question requires students to<br />
recognize an equivalent representation.<br />
Performance Data:<br />
The percent of public school students selecting answer choice A for question 2 on the March<br />
2006 Grade 5 Achievement Test was 32%.<br />
Keywords: algebra, inequality<br />
Source: ODE 2 of 16 Burke, Halley, Daly (SST Region 11, Oct 07)
St<strong>and</strong>ards-based Assessment Bank<br />
5 th Grade Mathematics<br />
<strong>Patterns</strong>, <strong>Functions</strong> <strong>and</strong> <strong>Algebra</strong><br />
Benchmark:<br />
E<br />
Use rules <strong>and</strong> variables to describe patterns, functions <strong>and</strong> other relationships.<br />
GLI:<br />
Mathematical Processes<br />
Benchmark:<br />
K<br />
Recognize <strong>and</strong> use mathematical language <strong>and</strong> symbols when reading, writing<br />
<strong>and</strong> conversing with others.<br />
Multiple Choice Question:<br />
6. Grant does 20 sit-ups each day.<br />
Which expression represents the total number of sit-ups that Grant will do in n days?<br />
A. n + 20<br />
B. n – 20<br />
C. n × 20<br />
D. n ÷ 20<br />
Commentary:<br />
This multiple-choice question asks students to select the expression that represents the given<br />
situation. Students need to select the expression which will represent the total number of sit-ups<br />
for any number of days when 20 sit-ups are done each day. For example,<br />
If Grant does 20 sit-ups on the first day, another 20 on the second day <strong>and</strong> repeats the same<br />
number of sit-ups for the rest of n days, then the number of sit-ups that Grant does equals<br />
20 + 20 + 20 + … + 20. This means that 20 is being repeated n times. Another way to show this<br />
repeated addition is 20n or n × 20.<br />
Answer choice C represents the number of sit-ups for n days. Answer choices A, B <strong>and</strong> D do<br />
not represent the total number of sit-ups for n days.<br />
The complexity level of this question is Moderate Complexity. This question requires students to<br />
represent a situation mathematically.<br />
Performance Data:<br />
The percent of public school students selecting answer choice C for question 6 on the March<br />
2006 Grade 5 Achievement Test was 73%.<br />
Source: ODE 3 of 16 Burke, Halley, Daly (SST Region 11, Oct 07)
St<strong>and</strong>ards-based Assessment Bank<br />
5 th Grade Mathematics<br />
<strong>Patterns</strong>, <strong>Functions</strong> <strong>and</strong> <strong>Algebra</strong><br />
Keywords: algebra, algebraic expression<br />
Benchmark:<br />
A<br />
Describe, extend <strong>and</strong> determine the rule for patterns <strong>and</strong> relationships occurring<br />
in numeric patterns, computation, geometry, graphs <strong>and</strong> othe applications.<br />
GLI:<br />
Multiple Choice Question:<br />
24. Amber made the input-output table shown.<br />
Which rule explains how to get the output number from the input number?<br />
A. add 5, multiply by 2<br />
B. add 10<br />
C. multiply by 5, add 2<br />
D. multiply by 6<br />
Commentary:<br />
This multiple-choice question asks students to select the rule which explains how to get the<br />
output number from the input number in the given table. Students need to find the rule that<br />
works for each entry in the input-output table. The rule in answer choice C, multiply by 5 <strong>and</strong><br />
add 2, works for getting the output number for each of the input numbers.<br />
5 × 2 + 2 = 12<br />
5 × 5 + 2 = 27<br />
5 × 8 + 2 = 42<br />
5 × 10 + 2 = 52<br />
The rules in answer choices A, B <strong>and</strong> D do not work for all of the entries in the input-output<br />
table.<br />
Source: ODE 4 of 16 Burke, Halley, Daly (SST Region 11, Oct 07)
St<strong>and</strong>ards-based Assessment Bank<br />
5 th Grade Mathematics<br />
<strong>Patterns</strong>, <strong>Functions</strong> <strong>and</strong> <strong>Algebra</strong><br />
The complexity level of this question is Moderate Complexity. This question requires students to<br />
retrieve information from a table <strong>and</strong> provide justification for steps in a solution process.<br />
Performance Data:<br />
The percent of public school students selecting answer choice C for question 24 on the March<br />
2006 Grade 5 Achievement Test was 74%.<br />
Keywords: algebra, rule, input-output table<br />
Benchmark:<br />
E<br />
Use rules <strong>and</strong> variables to describe patterns, functions <strong>and</strong> other relationships.<br />
GLI:<br />
Benchmark:<br />
F<br />
Use representations such as tables, graphs, <strong>and</strong> equations, to model situations<br />
<strong>and</strong> to solve problems, especially those that involve linear relationships.<br />
GLI:<br />
Mathematical Processes<br />
Benchmark:<br />
B<br />
Apply <strong>and</strong> adapt problem-solving strategies to solve a variety of problems,<br />
including unfamiliar <strong>and</strong> non-routine problem situations.<br />
Extended Response Question:<br />
33. Ethan rakes leaves to earn money. He uses the information in the table shown to find how<br />
long he takes to rake lawns of different sizes.<br />
Source: ODE 5 of 16 Burke, Halley, Daly (SST Region 11, Oct 07)
St<strong>and</strong>ards-based Assessment Bank<br />
5 th Grade Mathematics<br />
<strong>Patterns</strong>, <strong>Functions</strong> <strong>and</strong> <strong>Algebra</strong><br />
In your Answer Document, write a rule that tells how the amount of time Ethan needs to<br />
rake a lawn is related to the number of square feet in the lawn.<br />
One of Ethan’s neighbors has a 150-square-foot lawn. Use the table or your rule to state<br />
how long it will take Ethan to rake this lawn. Show or explain your work.<br />
Use the table or your rule to state what size lawn Ethan can rake in 65 minutes. Show or<br />
explain your work. (4 points)<br />
Commentary:<br />
This extended-response question asks students to use the data in the table to write a rule that<br />
relates the amount of time it takes to rake a lawn to the number of square feet in the lawn <strong>and</strong><br />
then use the rule or the table to determine the length of time it would take to rake a 150-squarefoot<br />
lawn. The question also asks students to determine the size of lawn that can be raked in 65<br />
minutes. The response earning the maximum number of points (4 points) provides an adequate<br />
rule, the number of minutes to rake a 150-square-foot lawn <strong>and</strong> the size of the lawn that can be<br />
raked in 65 minutes, with supporting work or an adequate explanation.<br />
An example of the rule relating the amount of time to rake a lawn to the number of square feet<br />
of lawn is that for every 50 square feet of lawn, it takes 10 more minutes to rake. Using this rule,<br />
it would take 30 minutes to rake a 150-square-foot lawn<br />
(150 square feet ÷ 50 square feet = 3; 10 minutes × 3 = 30 minutes). Half way between 60<br />
minutes <strong>and</strong> 70 minutes is 65 minutes, <strong>and</strong> half way between 300 square feet <strong>and</strong><br />
350 square feet is 325 square feet. Therefore, a 325-square-foot lawn can be raked in<br />
65 minutes.<br />
The complexity level of this question is High Complexity. This task requires students to perform<br />
a procedure having multiple steps <strong>and</strong> multiple decision points.<br />
Source: ODE 6 of 16 Burke, Halley, Daly (SST Region 11, Oct 07)
St<strong>and</strong>ards-based Assessment Bank<br />
5 th Grade Mathematics<br />
<strong>Patterns</strong>, <strong>Functions</strong> <strong>and</strong> <strong>Algebra</strong><br />
Performance Data:<br />
The percent of public school students earning each score point for question 33 on the March<br />
2006 Grade 5 Achievement Test:<br />
Percent at Each Score Point<br />
0 1 2 3 4<br />
29% 23% 18% 16% 12%<br />
Scoring Guidelines:<br />
Sample Correct Response(s):<br />
• The size of a lawn is 5 times the number of minutes it takes to rake it.<br />
OR<br />
The time it takes to rake a lawn is 5<br />
1 the number of square feet in the lawn.<br />
AND<br />
150 ÷ 5 = 30. I predict it will take Ethan 30 minutes to rake a 150-square-foot lawn.<br />
AND<br />
65 x 5 = 325. Ethan can rake a 325-square-foot lawn in 65 minutes.<br />
• The time increases by 10 minutes for each additional 50 square feet<br />
AND<br />
150 square feet will take 30 minutes (40 – 10 = 30)<br />
AND<br />
Ethan can rake 325 square feet of lawn in 65 minutes (300 + 25, since it’s halfway).<br />
Points<br />
Student Response<br />
4 The focus of this task is using data in a table to draw<br />
conclusions <strong>and</strong> make predictions. The response includes a<br />
rule that accurately relates the size of the lawn <strong>and</strong> the time<br />
needed <strong>and</strong> uses the rule to explain how long it will take Ethan<br />
to rake a 150-square-foot lawn <strong>and</strong> the size of the lawn Ethan<br />
can rake in 65 minutes.<br />
Source: ODE 7 of 16 Burke, Halley, Daly (SST Region 11, Oct 07)
St<strong>and</strong>ards-based Assessment Bank<br />
5 th Grade Mathematics<br />
<strong>Patterns</strong>, <strong>Functions</strong> <strong>and</strong> <strong>Algebra</strong><br />
3 The response provides adequate evidence of using data in a<br />
table to draw conclusions <strong>and</strong> make predictions. However, the<br />
solution may contain a slight error, a flaw or a vague<br />
explanation.<br />
For example, the response may:<br />
• Provide the correct rule relating the size of the lawn to<br />
the amount of time it takes to rake, AND the correct<br />
amount of time it will take Ethan to rake 150 square feet,<br />
AND the correct size of a lawn Ethan can rake in 65<br />
minutes with little or no work shown.<br />
• Provide a correct prediction for the amount of time it will<br />
take Ethan to rake 150 square feet AND the correct size<br />
of a lawn Ethan can rake in 65 minutes with an adequate<br />
explanation, but not provide a rule.<br />
2 The response provides partial evidence of using data in a table<br />
to draw conclusions or make predictions. However, the<br />
solution is incomplete <strong>and</strong>/or contains minor flaws.<br />
For example, the response may:<br />
• Provide an adequate rule <strong>and</strong> one of the predictions.<br />
• Provide correct predictions with inadequate or no support<br />
AND the rule is flawed or missing.<br />
1 The response provides minimal evidence of using data in a<br />
table to draw conclusions <strong>and</strong> make predictions. The response<br />
contains major flaws <strong>and</strong> the explanation is incomplete or<br />
missing.<br />
For example, the response may:<br />
• Provide one correct prediction.<br />
• Provide an appropriate rule.<br />
0 The response provides inadequate evidence of using data in a<br />
table to draw conclusions <strong>and</strong> make predictions. The response<br />
provides major flaws in reasoning or gives irrelevant<br />
information.<br />
For example, the response may:<br />
• State 200 – 40 = 160.<br />
• Be blank or make unrelated statements.<br />
• Recopy information from the stem.<br />
Keywords: algebra, pattern, rule<br />
Source: ODE 8 of 16 Burke, Halley, Daly (SST Region 11, Oct 07)
St<strong>and</strong>ards-based Assessment Bank<br />
5 th Grade Mathematics<br />
<strong>Patterns</strong>, <strong>Functions</strong> <strong>and</strong> <strong>Algebra</strong><br />
Benchmark:<br />
C<br />
Use variables to create <strong>and</strong> solve equations <strong>and</strong> inequalities representing<br />
problem situations.<br />
GLI:<br />
Mathematical Processes<br />
Benchmark:<br />
K<br />
Recognize <strong>and</strong> use mathematical language <strong>and</strong> symbols when reading, writing<br />
<strong>and</strong> conversing with others.<br />
Multiple Choice Question:<br />
41. Ryan is painting faces at the fair. It takes him 10 minutes to set up his materials. Each face<br />
takes 6 minutes to paint. Ryan wants to know how many faces (f) he can paint in 60<br />
minutes.<br />
Which equation represents this situation?<br />
A. 6f + 10 = 60<br />
B. 10f + 6 = 60<br />
C. 6f – 10 = 60<br />
D. 10f – 6 = 60<br />
Commentary:<br />
This multiple-choice question asks students to select the equation which represents the given<br />
situation. Students need to select the equation that can be used to find the number of faces (f)<br />
that can be painted in 60 minutes if it takes 6 minutes to paint each face, <strong>and</strong> takes into account<br />
the 10 minutes needed to set up the materials. The equation in answer choice A represents this<br />
situation. Answer choice C is incorrect because the time needed to set up the materials is<br />
subtracted from the time needed to paint the faces. Answer choices B <strong>and</strong> D are incorrect<br />
because the 10 minutes to set up the materials is not the number of minutes needed to paint<br />
each face.<br />
The complexity level of this question is Moderate Complexity. This question requires students to<br />
represent a situation mathematically.<br />
Performance Data:<br />
The percent of public school students selecting answer choice A for question 41 on the March<br />
2006 Grade 5 Achievement Test was 50%.<br />
Source: ODE 9 of 16 Burke, Halley, Daly (SST Region 11, Oct 07)
St<strong>and</strong>ards-based Assessment Bank<br />
5 th Grade Mathematics<br />
<strong>Patterns</strong>, <strong>Functions</strong> <strong>and</strong> <strong>Algebra</strong><br />
Keywords: algebra, equation<br />
Benchmark:<br />
F<br />
Use representations, such as tables, graphs <strong>and</strong> equations, to model situations<br />
<strong>and</strong> to solve problems, especially those that involve linear relationships.<br />
GLI:<br />
Multiple Choice Question:<br />
45. Kip earns $5 an hour baby-sitting.<br />
Which graph represents the amount of money he earns over time?<br />
A.<br />
B.<br />
Source: ODE 10 of 16 Burke, Halley, Daly (SST Region 11, Oct 07)
St<strong>and</strong>ards-based Assessment Bank<br />
5 th Grade Mathematics<br />
<strong>Patterns</strong>, <strong>Functions</strong> <strong>and</strong> <strong>Algebra</strong><br />
C.<br />
D.<br />
Commentary:<br />
This multiple-choice question asks students to select the graph that represents the given<br />
situation. Students need to select the graph that shows that as the number of hours of babysitting<br />
increases, the amount of money earned also increases. The graph in answer C shows<br />
this relationship. The graphs in answer choices A, B <strong>and</strong> D do not show the amount of money<br />
earned increasing $5 each hour as the number of hours of baby-sitting increase. In answer<br />
choice A, the graph shows no change in the amount earned as the number of hours baby-sitting<br />
increases. The graph in answer choice B shows no change in the number of hours of babysitting<br />
but shows a change in the amount of earnings. The graph in answer choice D shows that<br />
as the number of hours of baby-sitting increases, the amount of money earned decreases.<br />
The complexity level of this question is Moderate Complexity. This question requires students to<br />
interpret visual representations.<br />
Performance Data:<br />
The percent of public school students selecting answer choice C for question 45 on the March<br />
2006 Grade 5 Achievement Test was 54%.<br />
Source: ODE 11 of 16 Burke, Halley, Daly (SST Region 11, Oct 07)
St<strong>and</strong>ards-based Assessment Bank<br />
5 th Grade Mathematics<br />
<strong>Patterns</strong>, <strong>Functions</strong> <strong>and</strong> <strong>Algebra</strong><br />
Keywords: algebra, function, graphs<br />
Benchmark:<br />
K<br />
Graph linear equations <strong>and</strong> inequalities.<br />
GLI:<br />
Multiple Choice Question:<br />
16. Chelsea made bracelets <strong>and</strong> sold them at craft fairs. She found that most people would<br />
pay up to $3.00 for a bracelet. When the price went above $3.00, her sales dropped.<br />
Which graph might show Chelsea’s sales as her prices went up?<br />
A.<br />
Source: ODE 12 of 16 Burke, Halley, Daly (SST Region 11, Oct 07)
St<strong>and</strong>ards-based Assessment Bank<br />
5 th Grade Mathematics<br />
<strong>Patterns</strong>, <strong>Functions</strong> <strong>and</strong> <strong>Algebra</strong><br />
B.<br />
C.<br />
Source: ODE 13 of 16 Burke, Halley, Daly (SST Region 11, Oct 07)
St<strong>and</strong>ards-based Assessment Bank<br />
5 th Grade Mathematics<br />
<strong>Patterns</strong>, <strong>Functions</strong> <strong>and</strong> <strong>Algebra</strong><br />
D.<br />
Commentary:<br />
This multiple-choice question asks students to select the graph that represents the given<br />
problem situation. Students need to select the graph that shows a decrease in sales as the price<br />
for a bracelet went up. The graph in answer choice C is correct because it shows this<br />
relationship.<br />
The graphs in answer choices A, B <strong>and</strong> D are incorrect since they do not show the sales<br />
decreasing as the cost of the bracelet went up. The graph in answer choice A shows that as the<br />
cost increased, the sales increased. The graph in answer choice B shows the sales decreased<br />
when the cost of the bracelet went below $3.00, but increasing when the cost of the bracelet<br />
increased. The graph in answer choice D shows no change in sales as the cost of the bracelet<br />
went up.<br />
The complexity level of this question is Moderate Complexity. This question requires students to<br />
represent a situation mathematically in more than one way.<br />
Performance Data:<br />
The percent of public school students selecting answer choice C for question 16 on the May<br />
2007 Grade 5 Achievement Test was 56%.<br />
Keywords: algebra, linear equation<br />
Source: ODE 14 of 16 Burke, Halley, Daly (SST Region 11, Oct 07)
St<strong>and</strong>ards-based Assessment Bank<br />
5 th Grade Mathematics<br />
<strong>Patterns</strong>, <strong>Functions</strong> <strong>and</strong> <strong>Algebra</strong><br />
Benchmark:<br />
F<br />
Use representations such as tables, graphs, <strong>and</strong> equations, to model situations<br />
<strong>and</strong> to solve problems, especially those that involve linear relationships.<br />
GLI:<br />
Multiple Choice Question:<br />
27. The graph shows the cost of different numbers of CDs.<br />
What is a reasonable prediction for the number of CDs that can be purchased for $105?<br />
A. 5<br />
B. 6<br />
C. 7<br />
D. 8<br />
Source: ODE 15 of 16 Burke, Halley, Daly (SST Region 11, Oct 07)
St<strong>and</strong>ards-based Assessment Bank<br />
5 th Grade Mathematics<br />
<strong>Patterns</strong>, <strong>Functions</strong> <strong>and</strong> <strong>Algebra</strong><br />
Commentary:<br />
This multiple-choice question asks students to predict the number of CDs that be purchased for<br />
a given amount using data presented in a graph. Students could determine from the graph that<br />
each CD costs about $15. Using the cost of one CD, the number of CDs that can be purchased<br />
for $105 is 7 ($105 ÷ $15 per CD = 7 CDs), answer choice C. Students could also use the graph<br />
<strong>and</strong> extend it to find the cost for 6 CDs ($90) <strong>and</strong> for the cost of 7 CDs ($105).<br />
The number of CDs in answer choices A, B <strong>and</strong> D are incorrect since they are not a reasonable<br />
prediction of the number of CDs that can be purchased for $105.<br />
The complexity level of this question is Moderate Complexity. This question requires students to<br />
retrieve information from a graph <strong>and</strong> use it to solve a problem.<br />
Performance Data:<br />
The percent of public school students selecting answer choice C for question 27 on the May<br />
2007 Grade 5 Achievement Test was 47%.<br />
Keywords: algebra, linear relationships<br />
Source: ODE 16 of 16 Burke, Halley, Daly (SST Region 11, Oct 07)