Overview and Status of the Harbor Maintenance Trust Fund
Overview and Status of the Harbor Maintenance Trust Fund
Overview and Status of the Harbor Maintenance Trust Fund

Create successful ePaper yourself
Turn your PDF publications into a flip-book with our unique Google optimized e-Paper software.
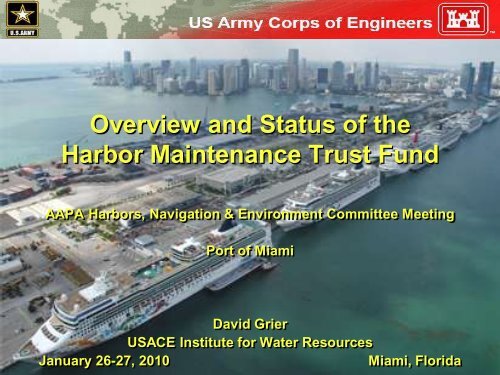
<strong>Overview</strong> <strong>and</strong> <strong>Status</strong> <strong>of</strong> <strong>the</strong><br />
<strong>Harbor</strong> <strong>Maintenance</strong> <strong>Trust</strong> <strong>Fund</strong><br />
AAPA <strong>Harbor</strong>s, Navigation & Environment Committee Meeting<br />
Port <strong>of</strong> Miami<br />
David Grier<br />
USACE Institute for Water Resources<br />
Building Strong!<br />
January 26-27, 2010<br />
Miami, Florida<br />
1
<strong>Harbor</strong> <strong>Maintenance</strong><br />
<strong>Trust</strong> <strong>Fund</strong> Background<br />
• Established in WRDA 1986<br />
• Reimburses Treasury for 100% <strong>of</strong> harbor O&M since 1990<br />
• Also for Construction (CG) <strong>of</strong> dredged material disposal<br />
facilities for O&M <strong>and</strong> navigation environmental mitigation<br />
• Ad valorem tax <strong>of</strong> .125% on cargo value<br />
• Also support St. Lawrence Seaway operations, Customs<br />
data collection<br />
• Issues:<br />
– Tax on exports ruled unconstitutional by U.S. Supreme Court<br />
in 1998 <strong>and</strong> no longer collected<br />
– Tax on imports may be challenged at WTO<br />
– Increasing balance - $5.1 billion at end FY09 ($5.22b thru Dec)<br />
– Not “<strong>of</strong>f budget” like Highway <strong>Trust</strong> <strong>Fund</strong> so transfers fall<br />
under agency budget ceilings<br />
Building Strong!<br />
2
HMTF Challenges<br />
• HMTF Revenues in FY 09: $ 1.3 billion (incl interest)<br />
• Transfers to Program Agencies in FY 09: $ 807.5<br />
million<br />
– Of which Corps: $ 772.5 million<br />
• Balance at end <strong>of</strong> FY 09: $ 5.1 billion ($5.22b thru Dec)<br />
• Appropriations determine available O&M funds for<br />
harbor maintenance by <strong>the</strong> Corps<br />
• Transfers from HMTF <strong>the</strong>n based on Corps<br />
expenditures<br />
• Corps has unmet maintenance dredging needs: full<br />
channel dimensions available only 35% <strong>of</strong> <strong>the</strong> time<br />
Building Strong!<br />
3
HMTF Report to Congress 2007-08<br />
• Draft report being finalized for review by HQ, ASA(CW), OMB<br />
• Will include Corps expenditures by project eligible for recovery<br />
from HMTF displayed by<br />
– Deep or shallow draft<br />
– State<br />
– Coastal reach: Atlantic, Gulf, Pacific, Lakes, Inl<strong>and</strong><br />
• Historic HMTF data 1987 – 2008<br />
– Collections by source (imports, domestic, FTZ, passengers)<br />
– Transfers to agencies<br />
• Dredging quantities 1987 – 2008<br />
• Waterborne commerce volume <strong>and</strong> value<br />
• Goal: Have 2009 report completed by May 2010<br />
– OMBIL modifications (O&M Business Info Link) screen for HMTFeligible<br />
projects<br />
– Navigation Project Pr<strong>of</strong>iles<br />
Building Strong!<br />
4
<strong>Harbor</strong> <strong>Maintenance</strong> Tax Collections by Source,<br />
Fiscal Years 1987 - 2009<br />
(thous<strong>and</strong>s <strong>of</strong> dollars)<br />
Fiscal Foreign Net Cumulative<br />
Year Imports Exports Trade Zone Domestic Passengers Collections Total<br />
1987 43,249 6,777 677 2,414 120 53,237 53,237<br />
1988 99,793 35,938 3,120 9,170 551 148,572 201,809<br />
1989 105,927 44,618 3,876 8,590 666 163,677 365,486<br />
1990 109,215 45,808 4,020 9,069 559 168,671 534,157<br />
1991 258,321 93,194 9,166 19,518 1,977 382,176 916,333<br />
1992 342,402 142,916 16,974 28,451 3,275 534,018 1,450,351<br />
1993 361,678 169,141 20,959 31,858 4,748 588,384 2,038,735<br />
1994 391,679 168,241 21,895 34,558 4,811 621,184 2,659,919<br />
1995 418,858 214,821 14,548 20,241 2,792 671,260 3,331,179<br />
1996 409,708 209,217 27,982 26,788 3,179 676,874 4,008,053<br />
1997 438,395 209,439 48,444 32,828 3,865 732,971 4,741,024<br />
1998 462,895 94,998 45,319 39,158 2,460 644,830 5,385,854<br />
1999 484,169 -49,552 66,674 48,801 1,213 551,305 5,937,159<br />
2000 558,513 -9,587 76,883 44,502 2,152 672,463 6,609,622<br />
2001 583,198 2,455 86,285 39,365 10,309 721,612 7,331,234<br />
2002 544,746 1,566 69,115 27,786 9,643 652,856 7,984,090<br />
2003 624,436 272 87,343 40,649 5,295 757,995 8,742,085<br />
2004 694,883 2,177 109,341 56,588 6,707 869,696 9,611,781<br />
2005 841,675 18 137,959 59,765 8,445 1,047,862 10,659,643<br />
2006 953,592 0 177,022 65,758 10,128 1,206,500 11,866,143<br />
2007 994,682 0 188,204 67,847 10,998 1,261,731 13,127,874<br />
2008 1,087,508 110 265,189 102,866 11,560 1,467,233 14,595,107<br />
2009 856,446 1 184,560 74,319 9,917 1,125,243 15,720,350<br />
Totals 11,665,968 1,382,568 1,665,555 890,889 115,370 15,720,350
HMTF Cash Flow 1992 - 2009<br />
Start Tax Interest Total Total End Corps O<strong>the</strong>r<br />
Year Balance Receipts Income Available Transfers Balance Transfers Agency<br />
1992 $72.8 $514.6 $16.5 $603.9 $482.9 $120.9 $462.2 $20.7<br />
1993 $120.9 $637.2 $13.5 $771.7 $468.4 $303.3 $446.4 $21.9<br />
1994 $303.3 $633.4 $12.8 $949.5 $497.1 $452.4 $476.6 $20.5<br />
1995 $451.4 $670.7 $30.2 $1,152.3 $531.1 $621.2 $519.2 $11.9<br />
1996 $621.2 $698.3 $40.9 $1,360.3 $494.8 $865.5 $482.1 $12.7<br />
1997 $866.1 $735.5 $53.6 $1,655.2 $549.5 $1,105.7 $536.0 $13.5<br />
1998 $1,112.2 $621.5 $66.4 $1,800.1 $511.9 $1,288.2 $496.9 $15.0<br />
1999 $1,289.0 $552.8 $62.8 $1,904.6 $295.7 $1,609.0 $281.2 $14.5<br />
2000 $1,609.0 $677.6 $83.0 $2,369.5 $701.9 $1,667.6 $686.9 $15.0<br />
2001 $1,667.6 $721.6 $89.2 $2,478.4 $659.6 $1,818.8 $643.6 $16.0<br />
2002 $1,818.8 $652.9 $57.9 $2,529.6 $656.2 $1,873.4 $639.9 $16.3<br />
2003 $1,873.4 $758.0 $46.5 $2,677.9 $585.9 $2,092.1 $568.9 $17.0<br />
2004 $2,092.1 $869.7 $52.7 $3,014.5 $648.2 $2,366.3 $630.9 $17.3<br />
2005 $2,366.3 $1,047.9 $74.8 $3,488.9 $706.0 $2,782.9 $687.2 $18.7<br />
2006 $2,782.9 $1,206.5 $114.4 $4,103.8 $798.1 $3,305.7 $779.0 $19.0<br />
2007 $3,305.7 $1,261.7 $154.0 $4,721.5 $909.9 $3,811.6 $890.6 $19.2<br />
2008 $3,811.6 $1,467.2 $159.2 $5,438.1 $786.5 $4,651.6 $766.0 $20.5<br />
2009 $4,651.6 $1,125.2 $143.3 $5,920.1 $807.5 $5,112.5 $772.5 $35.0<br />
Building Strong!<br />
6
Fiscal<br />
Year<br />
U.S. Army Corps <strong>of</strong> Engineers Expenditures<br />
Eligible for Recovery from <strong>the</strong> <strong>Harbor</strong> <strong>Maintenance</strong> <strong>Trust</strong> <strong>Fund</strong>,<br />
Fiscal Years 1987 - 2008<br />
(thous<strong>and</strong>s <strong>of</strong> dollars)<br />
Preliminary for 2007-08 <strong>and</strong> Excludes Supplementals<br />
Deep Draft Operations<br />
Shallow Draft Operations<br />
Total Operations<br />
<strong>and</strong> <strong>Maintenance</strong><br />
Costs<br />
Eligible DMDF<br />
Costs in<br />
Construction,<br />
General<br />
Account<br />
Cumulative<br />
Total<br />
<strong>and</strong> <strong>Maintenance</strong> Costs <strong>and</strong> <strong>Maintenance</strong> Costs<br />
Dollars Percent Dollars Percent Dollars Dollars Dollars<br />
1987 319,607 0.856 53,944 0.144 373,551 0 373,551<br />
1988 320,291 0.810 75,173 0.190 395,464 0 395,464<br />
1989 330,742 0.832 66,752 0.168 397,494 0 397,494<br />
1990 303,185 0.819 66,962 0.181 370,147 0 370,147<br />
1991 393,946 0.856 66,502 0.144 460,448 0 460,448<br />
1992 378,307 0.866 58,613 0.134 436,920 0 436,920<br />
1993 415,667 0.876 59,020 0.124 474,687 0 474,687<br />
1994 436,277 0.844 80,609 0.156 516,886 0 516,886<br />
1995 418,893 0.871 62,126 0.129 481,019 0 481,019<br />
1996 461,722 0.866 71,550 0.134 533,272 0 533,272<br />
1997 498,002 0.863 79,118 0.137 577,120 0 577,120<br />
1998 570,308 0.905 60,053 0.095 630,361 0 630,361<br />
1999 585,375 0.861 94,755 0.139 680,130 3,200 683,330<br />
2000 530,227 0.847 95,927 0.153 626,154 5,000 631,154<br />
2001 554,184 0.844 102,173 0.156 656,357 13,000 669,357<br />
2002 507,330 0.819 111,834 0.181 619,164 26,000 645,164<br />
2003 559,969 0.824 119,254 0.176 679,223 5,900 685,123<br />
2004 568,234 0.840 107,914 0.160 676,148 5,300 681,448<br />
2005 628,144 0.896 72,888 0.104 701,032 7,758 708,790<br />
2006 601,207 0.873 87,713 0.127 688,920 8,270 697,190<br />
2007P 664,271 0.879 91,348 0.121 755,619 9,201 764,820<br />
2008P 683,068 0.893 81,703 0.107 764,771 29,117 793,888
HMTF Reconciliation 2000-2008 (07-08 Prelim)<br />
Year Corps HMTF Over (+)/Under(-)<br />
Eligible Transfers Transfer<br />
2000 631.2 686.9 55.7<br />
2001 669.4 643.6 -25.8<br />
2002 645.2 639.9 -5.3<br />
2003 685.1 568.9 -116.2<br />
2004 681.4 630.9 -50.5<br />
2005 716.4 687.2 -29.2<br />
2006 705.1 779.0 73.9<br />
2007 764.4 890.6 126.2<br />
2008 793.4 766.0 -27.4<br />
2009 772.5<br />
Total 6291.6 7065.5 1.4<br />
MR&T Adjustment for Cumulative<br />
Year Ineligible Transfers 1987-<br />
2005<br />
Cumulative Over Transfer for<br />
Reconciliation<br />
Building Strong!<br />
37.1<br />
38.5<br />
8
$ Million<br />
2500<br />
HMTF Receipts, Historic <strong>and</strong> Projected<br />
2000<br />
1500<br />
Receipts<br />
1000<br />
500<br />
0<br />
1992<br />
1994<br />
1996<br />
1998<br />
2000<br />
2002<br />
2004<br />
2006<br />
2008<br />
2010<br />
2012<br />
2014<br />
2016<br />
2018<br />
2020<br />
Year<br />
Building Strong!<br />
Projections based on Global Insight forecast growth rate for $ value <strong>of</strong> US imports, Dec 09.<br />
9
HMTF Receipts by Port<br />
• Not available currently<br />
• Interagency effort for International Trade Data System (ITDS)<br />
– Treasury leads<br />
– More than a dozen agencies participating including Corps<br />
– Lack <strong>of</strong> funding has affected implementation schedule<br />
– Hope to have HMT receipts available by port in 12-18 months<br />
– Will only be imports <strong>and</strong> FTZ receipts<br />
• Current options<br />
– Estimate from cargo value by customs districts<br />
– TVA initiative using dock-level Corps cargo data for imports <strong>and</strong><br />
domestic, <strong>and</strong> estimated cargo value by commodity type (2007 data)<br />
• Result <strong>of</strong> GAO recommendations to Corps <strong>and</strong> CBP for improved<br />
audit capability primarily for receipts for domestic cargo<br />
Building Strong!<br />
10
Building Strong!<br />
11
Take Aways<br />
• HMTF 07-08 Report draft available being finalized<br />
• HMTF 09 Report target May 2010<br />
• Fur<strong>the</strong>r improvements to OMBIL to track HMTF-eligible<br />
expenditures across accounts (regular appropriations by<br />
account; supplementals)<br />
• Working with ITDS on ability to track HMT receipts by<br />
port for imports <strong>and</strong> FTZ<br />
• CBP <strong>and</strong> IRS have shown interest in audit <strong>of</strong> HMT<br />
receipts, particularly for domestic<br />
• We welcome your views on how to improve HMTF report<br />
content to meet stakeholder needs<br />
Building Strong!<br />
13
Building Strong!<br />
14