

STAT 430 – Assignment 2 - People.stat.sfu.ca
STAT 430 – Assignment 2 - People.stat.sfu.ca
STAT 430 – Assignment 2 - People.stat.sfu.ca

Create successful ePaper yourself
Turn your PDF publications into a flip-book with our unique Google optimized e-Paper software.
<strong>STAT</strong> <strong>430</strong> – <strong>Assignment</strong> 2<br />
Due October 04, 2011 (Tuesday) at the beginning of lecture.<br />
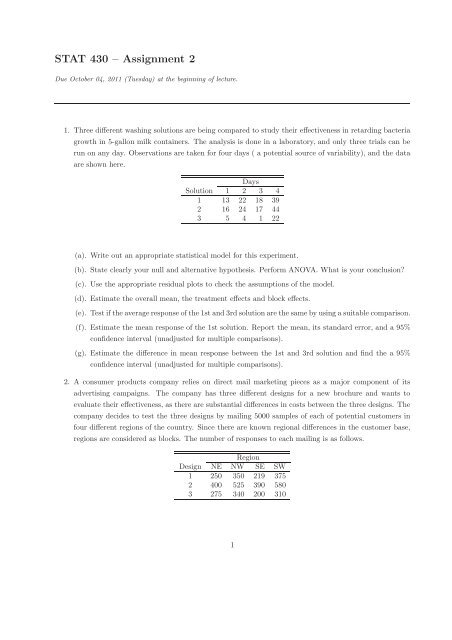
1. Three different washing solutions are being compared to study their effectiveness in retarding bacteria<br />
growth in 5-gallon milk containers. The analysis is done in a laboratory, and only three trials <strong>ca</strong>n be<br />
run on any day. Observations are taken for four days ( a potential source of variability), and the data<br />
are shown here.<br />
Days<br />
Solution 1 2 3 4<br />
1 13 22 18 39<br />
2 16 24 17 44<br />
3 5 4 1 22<br />
(a). Write out an appropriate <strong>stat</strong>isti<strong>ca</strong>l model for this experiment.<br />
(b). State clearly your null and alternative hypothesis. Perform ANOVA. What is your conclusion?<br />
(c). Use the appropriate residual plots to check the assumptions of the model.<br />
(d). Estimate the overall mean, the treatment effects and block effects.<br />
(e). Testiftheaverageresponseofthe1stand3rdsolutionarethesamebyusingasuitablecomparison.<br />
(f). Estimate the mean response of the 1st solution. Report the mean, its standard error, and a 95%<br />
confidence interval (unadjusted for multiple comparisons).<br />
(g). Estimate the difference in mean response between the 1st and 3rd solution and find the a 95%<br />
confidence interval (unadjusted for multiple comparisons).<br />
2. A consumer products company relies on direct mail marketing pieces as a major component of its<br />
advertising <strong>ca</strong>mpaigns. The company has three different designs for a new brochure and wants to<br />
evaluate their effectiveness, as there are substantial differences in costs between the three designs. The<br />
company decides to test the three designs by mailing 5000 samples of each of potential customers in<br />
four different regions of the country. Since there are known regional differences in the customer base,<br />
regions are considered as blocks. The number of responses to each mailing is as follows.<br />
Region<br />
Design NE NW SE SW<br />
1 250 350 219 375<br />
2 400 525 390 580<br />
3 275 340 200 310<br />
1
(a). Analyze the data from this experiment. Hint: Carry out an ANOVA and a suitable hypothesis<br />
test.<br />
(b). Use the Fisher LSD method to make comparisonamong the three designs to determine specifi<strong>ca</strong>lly<br />
which designs differ in the mean response rate.<br />
(c). Analyze the residuals from this experiment.<br />
3. Find all standard Latin squares of side 5 with the following form<br />
A B C D E<br />
B C D<br />
C<br />
D<br />
E<br />
4. Using the notation in class, show that Var(ˆτ j −ˆτ i ) = (2k/(λa))σ 2 for a BIBD. If the experiment is run<br />
as a complete randomized block design, we <strong>ca</strong>n show that Var(ˆτ j − ˆτ i ) = Var(ȳ j. −ȳ i. ) = 2σ 2 /b. Now,<br />
prove that 2k/(λa) > 2/b.<br />
2


