Kent International Airport's Master Plan - Manston Airport
Kent International Airport's Master Plan - Manston Airport
Kent International Airport's Master Plan - Manston Airport

Create successful ePaper yourself
Turn your PDF publications into a flip-book with our unique Google optimized e-Paper software.
<strong>Kent</strong> <strong>International</strong> <strong>Airport</strong> – <strong>Manston</strong><br />
<strong>Master</strong> <strong>Plan</strong><br />
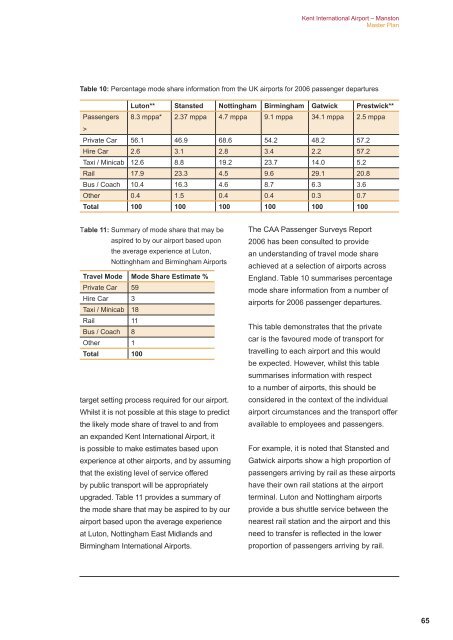
Table 10: Percentage mode share information from the UK airports for 2006 passenger departures<br />
Luton** Stansted Nottingham Birmingham Gatwick Prestwick**<br />
Passengers 8.3 mppa* 2.37 mppa 4.7 mppa 9.1 mppa 34.1 mppa 2.5 mppa<br />
><br />
Private Car 56.1 46.9 68.6 54.2 48.2 57.2<br />
Hire Car 2.6 3.1 2.8 3.4 2.2 57.2<br />
Taxi / Minicab 12.6 8.8 19.2 23.7 14.0 5.2<br />
Rail 17.9 23.3 4.5 9.6 29.1 20.8<br />
Bus / Coach 10.4 16.3 4.6 8.7 6.3 3.6<br />
Other 0.4 1.5 0.4 0.4 0.3 0.7<br />
Total 100 100 100 100 100 100<br />
Table 11: Summary of mode share that may be<br />
aspired to by our airport based upon<br />
the average experience at Luton,<br />
Nottinghham and Birmingham <strong>Airport</strong>s<br />
Travel Mode Mode Share Estimate %<br />
Private Car 59<br />
Hire Car 3<br />
Taxi / Minicab 18<br />
Rail 11<br />
Bus / Coach 8<br />
Other 1<br />
Total 100<br />
target setting process required for our airport.<br />
Whilst it is not possible at this stage to predict<br />
the likely mode share of travel to and from<br />
an expanded <strong>Kent</strong> <strong>International</strong> <strong>Airport</strong>, it<br />
is possible to make estimates based upon<br />
experience at other airports, and by assuming<br />
that the existing level of service offered<br />
by public transport will be appropriately<br />
upgraded. Table 11 provides a summary of<br />
the mode share that may be aspired to by our<br />
airport based upon the average experience<br />
at Luton, Nottingham East Midlands and<br />
Birmingham <strong>International</strong> <strong>Airport</strong>s.<br />
The CAA Passenger Surveys Report<br />
2006 has been consulted to provide<br />
an understanding of travel mode share<br />
achieved at a selection of airports across<br />
England. Table 10 summarises percentage<br />
mode share information from a number of<br />
airports for 2006 passenger departures.<br />
This table demonstrates that the private<br />
car is the favoured mode of transport for<br />
travelling to each airport and this would<br />
be expected. However, whilst this table<br />
summarises information with respect<br />
to a number of airports, this should be<br />
considered in the context of the individual<br />
airport circumstances and the transport offer<br />
available to employees and passengers.<br />
For example, it is noted that Stansted and<br />
Gatwick airports show a high proportion of<br />
passengers arriving by rail as these airports<br />
have their own rail stations at the airport<br />
terminal. Luton and Nottingham airports<br />
provide a bus shuttle service between the<br />
nearest rail station and the airport and this<br />
need to transfer is reflected in the lower<br />
proportion of passengers arriving by rail.<br />
65