Big Five Factors of Personality and Replicated Predictions of Behavior
Big Five Factors of Personality and Replicated Predictions of Behavior
Big Five Factors of Personality and Replicated Predictions of Behavior
You also want an ePaper? Increase the reach of your titles
YUMPU automatically turns print PDFs into web optimized ePapers that Google loves.
Journal <strong>of</strong> <strong>Personality</strong> <strong>and</strong> Social Psychology<br />
Copyright 2003 by the American Psychological Association, Inc.<br />
2003, Vol. 84, No. 2, 411–424 0022-3514/03/$12.00 DOI: 10.1037/0022-3514.84.2.411<br />
<strong>Big</strong> <strong>Five</strong> <strong>Factors</strong> <strong>of</strong> <strong>Personality</strong> <strong>and</strong> <strong>Replicated</strong> <strong>Predictions</strong> <strong>of</strong> <strong>Behavior</strong><br />
Sampo V. Paunonen<br />
University <strong>of</strong> Western Ontario<br />
Measures <strong>of</strong> the <strong>Big</strong> <strong>Five</strong> factors <strong>of</strong> personality were used to predict a variety <strong>of</strong> criterion variables<br />
thought to represent behaviors <strong>of</strong> some social <strong>and</strong> cultural significance (e.g., alcohol consumption, grade<br />
point average). Analyses focused on replicated predictions across 2 independent samples <strong>of</strong> participants<br />
(Ns 276 <strong>and</strong> 142) with 3 different measures <strong>of</strong> the <strong>Big</strong> <strong>Five</strong> (the NEO <strong>Five</strong>-Factor Inventory, the<br />
Revised NEO <strong>Personality</strong> Inventory, <strong>and</strong> the <strong>Five</strong>-Factor Nonverbal <strong>Personality</strong> Questionnaire, the latter<br />
an experimental nonverbal personality inventory). The results indicated substantial consistency in<br />
behavior predictions across the different <strong>Big</strong> <strong>Five</strong> assessments. The data are interpreted as supporting<br />
both the construct validity <strong>of</strong> the personality measures used <strong>and</strong> the role <strong>of</strong> the <strong>Big</strong> <strong>Five</strong> factors as<br />
determinants <strong>of</strong> certain complex behaviors.<br />
The five-factor model <strong>of</strong> personality structure has generated<br />
substantial interest among personality researchers. The belief is<br />
that personality-based variations in behavior are largely interpretable<br />
in terms <strong>of</strong> the <strong>Big</strong> <strong>Five</strong> factors <strong>of</strong> Extraversion, Agreeableness,<br />
Conscientiousness, Neuroticism, <strong>and</strong> Openness to Experience<br />
(see McCrae & John, 1992). This view <strong>of</strong> personality<br />
structure has consequently led to the development <strong>of</strong> several<br />
questionnaires, inventories, <strong>and</strong> adjective rating scales designed to<br />
measure those broad dimensions <strong>of</strong> behavior (e.g., see De Raad &<br />
Perugini, 2002).<br />
My primary purpose in this study is to evaluate the generalizability<br />
<strong>of</strong> a few <strong>Big</strong> <strong>Five</strong> personality factor inventories as predictors<br />
<strong>of</strong> a common set <strong>of</strong> criteria, criteria representing behaviors <strong>of</strong><br />
some social significance. By assessing people using multiple inventories<br />
purporting to measure the <strong>Big</strong> <strong>Five</strong> personality factors,<br />
one can determine whether the different measures <strong>of</strong> the same<br />
personality constructs show any consistency in their prediction <strong>of</strong><br />
the same criterion variables. If the <strong>Big</strong> <strong>Five</strong> inventories are all<br />
designed to measure equivalent dimensions <strong>of</strong> personality, then<br />
they should show a nontrivial amount <strong>of</strong> agreement in the variables<br />
they are able to predict.<br />
I used three measures <strong>of</strong> the <strong>Big</strong> <strong>Five</strong> in this study. Two <strong>of</strong> these<br />
were the well-known NEO <strong>Five</strong>-Factor Inventory (NEO–FFI;<br />
Costa & McCrae, 1992) <strong>and</strong> Revised NEO <strong>Personality</strong> Inventory<br />
(NEO–PI–R; Costa & McCrae, 1992) questionnaires. The third<br />
measure is a new, structured, nonverbal measure <strong>of</strong> the five personality<br />
factors called the <strong>Five</strong>-Factor Nonverbal <strong>Personality</strong><br />
Questionnaire (FF–NPQ; Paunonen, Ashton, & Jackson, 2001).<br />
The construction <strong>of</strong> the FF–NPQ has been described in detail<br />
elsewhere (Paunonen & Ashton, 2002; Paunonen et al., 2001), so<br />
I summarize it only briefly.<br />
This research was supported by Social Sciences <strong>and</strong> Humanities Research<br />
Council <strong>of</strong> Canada Research Grant 410-98-1555. I thank Paul<br />
MacDonald <strong>and</strong> Andrew Holownych for their assistance in the data collection<br />
<strong>and</strong> Ray Wolfe <strong>and</strong> Paul Olczak for their comments on a draft <strong>of</strong><br />
this article.<br />
Correspondence concerning this article should be addressed to Sampo<br />
V. Paunonen, Department <strong>of</strong> Psychology, University <strong>of</strong> Western Ontario,<br />
London, Ontario N6A 5C2, Canada.<br />
The FF–NPQ<br />
The FF–NPQ is a 60-item five-factor measure based on the<br />
Nonverbal <strong>Personality</strong> Questionnaire (NPQ), which is a longer<br />
136-item measure <strong>of</strong> 16 Murray needs (see Paunonen & Ashton,<br />
1998; Paunonen, Jackson, & Keinonen, 1990; Paunonen, Jackson,<br />
Trzebinski, & Forsterling, 1992; Paunonen et al., 1996; Paunonen,<br />
Zeidner, Engvik, Oosterveld, & Maliphant, 2000). Most items in<br />
the FF–NPQ were selected from the NPQ (a few new items were<br />
created) using item analysis <strong>and</strong> factoring procedures to identify<br />
the best <strong>Big</strong> <strong>Five</strong> exemplars in the nonverbal item pool (see<br />
Paunonen & Ashton, 2002).<br />
Each NPQ <strong>and</strong> FF–NPQ item represents a line drawing <strong>of</strong> a<br />
central character performing a trait- or factor-relevant behavior in<br />
a specific situation. Respondents are asked to consider each item in<br />
a questionnaire <strong>and</strong> to decide, using a 7-point rating scale, the<br />
likelihood that they would engage in the type <strong>of</strong> behavior depicted<br />
in the illustration. An example FF–NPQ item (representing thrillseeking<br />
behavior) is shown on the Instructions <strong>and</strong> Rating Form<br />
page reproduced in Figure 1. Other examples <strong>of</strong> the nonverbal<br />
items can be found in the articles by Paunonen <strong>and</strong> Ashton (2002),<br />
Paunonen et al. (1990, 1996, 2001), <strong>and</strong> Paunonen <strong>and</strong> Jackson<br />
(1979).<br />
As already stated, the items <strong>of</strong> the FF–NPQ were selected<br />
empirically from the longer NPQ to measure the <strong>Big</strong> <strong>Five</strong> factors<br />
<strong>of</strong> personality. The particular conceptualization <strong>of</strong> personality<br />
structure chosen for this task was the same five-factor model<br />
underlying the construction <strong>of</strong> the NEO–FFI <strong>and</strong> the NEO–PI–R.<br />
In fact, the domain scales on the NEO–FFI were used as one basis<br />
for selecting FF–NPQ items from the nonverbal item pool—NPQ<br />
items that correlated well with the particular NEO–FFI scales were<br />
assigned to measure those factors in the FF–NPQ (see Paunonen et<br />
al., 2001). An implication <strong>of</strong> this test construction procedure is that<br />
one <strong>of</strong> the FF–NPQ scales measures Openness to Experience,<br />
instead <strong>of</strong> a dimension that others have labeled as Culture or<br />
Intellect (see Digman, 1990).<br />
In preliminary studies with the FF–NPQ (Paunonen et al., 2001),<br />
the five nonverbal factor scales showed good levels <strong>of</strong> internal<br />
consistency reliability <strong>and</strong> convergent validity. For example, in a<br />
sample <strong>of</strong> 304 Canadian students, the mean internal consistency <strong>of</strong><br />
411
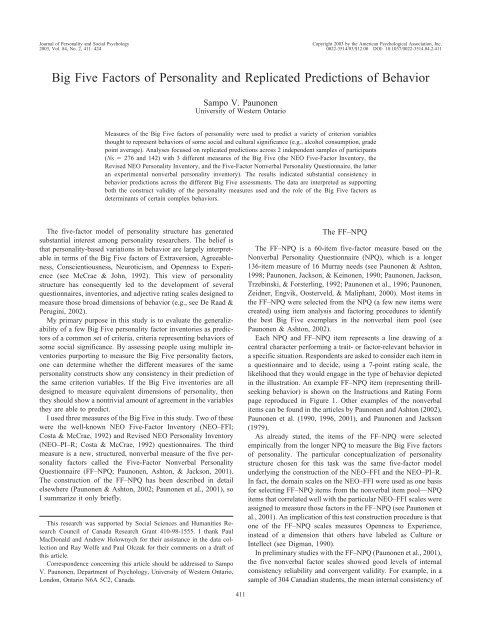
Figure 1. Instructions <strong>and</strong> Rating Form page <strong>of</strong> the <strong>Five</strong>-Factor Nonverbal <strong>Personality</strong> Questionnaire. From the<br />
<strong>Five</strong>-Factor Nonverbal <strong>Personality</strong> Questionnaire, by S. V. Paunonen, 2000, unpublished test. Copyright 2000<br />
by S. V. Paunonen. Reprinted with permission.
BIG FIVE PREDICTORS<br />
413<br />
the scales was .80, <strong>and</strong> the mean convergence with corresponding<br />
NEO–FFI scales was .52. Self-ratings <strong>and</strong> peer ratings <strong>of</strong> university<br />
residence roommates collected on the FF–NPQ scales also<br />
correlated positively, with a mean value <strong>of</strong> .41. Moreover, both the<br />
FF–NPQ <strong>and</strong> the NEO–FFI were found to show a strikingly<br />
similar pattern <strong>of</strong> relations in predicting different criterion variables.<br />
For example, in a set <strong>of</strong> 14 behavior criteria, both <strong>Big</strong> <strong>Five</strong><br />
questionnaires best predicted the same criterion (self-reported alcohol<br />
consumption <strong>of</strong> students), <strong>and</strong> both had the same mean<br />
multiple correlation <strong>of</strong> scales with criteria (both R .25, each<br />
averaged across the 14 criterion variables).<br />
The FF–NPQ, being a nonverbal personality inventory, is <strong>of</strong><br />
obvious interest to cross-cultural researchers. Because no translation<br />
<strong>of</strong> the items is required (the instructions shown in Figure 1 do,<br />
<strong>of</strong> course, require translation), the questionnaire can be easily<br />
administered to people in many different language groups as well<br />
as to people who have difficulty reading or underst<strong>and</strong>ing any<br />
language. Further evaluations <strong>of</strong> the FF–NPQ items (Paunonen et<br />
al., 2001) have shown those <strong>Big</strong> <strong>Five</strong> scales to have good levels <strong>of</strong><br />
internal consistency reliability <strong>and</strong> reasonable degrees <strong>of</strong> convergence<br />
with verbal indicators <strong>of</strong> the <strong>Big</strong> <strong>Five</strong> in several crosscultural<br />
samples (see also Paunonen & Ashton, 2002).<br />
The <strong>Big</strong> <strong>Five</strong> as Predictors<br />
Construct valid measures <strong>of</strong> personality variables should predict<br />
human behaviors, assuming those behaviors have personality determinants.<br />
This is especially true <strong>of</strong> <strong>Big</strong> <strong>Five</strong> inventories because<br />
those factors are presumed to account for most <strong>of</strong> the personalitybased<br />
variation in behavior. But some predictions are more remarkable<br />
than are others. For example, personality test scores that<br />
correlate with respondent self-ratings using other methods <strong>of</strong> measuring<br />
the same trait (e.g., comparing respondents’ FF–NPQ scale<br />
scores with their NEO–FFI scale scores, as reported in the previous<br />
section) is a m<strong>and</strong>atory requirement <strong>of</strong> good psychometric assessment<br />
<strong>and</strong>, as such, is unremarkable. One might also consider<br />
unremarkable test scores that correlate with ratings <strong>of</strong> respondents<br />
on the trait by well-acquainted peers, using the same or different<br />
inventories (e.g., comparing respondents’ self-ratings with roommate<br />
ratings on the FF–NPQ scales). What is remarkable, however,<br />
is a personality measure that predicts complex human behaviors,<br />
behaviors that are not so obviously <strong>and</strong> simply parallel<br />
indicators <strong>of</strong> the assessed construct.<br />
What are such human behaviors? Examples are alcohol consumption,<br />
grade point average, self-perceived level <strong>of</strong> physical<br />
attractiveness, dating behavior, tobacco consumption, participation<br />
in sports, <strong>and</strong> so on. Such individual-differences variables are<br />
complex in the sense that they probably have multiple determinants,<br />
including genetic factors <strong>and</strong> environmental influences. But<br />
if those determinants include personality variables, then a good<br />
omnibus measure <strong>of</strong> personality should predict those behaviors.<br />
Note that such behavior criteria are important variables in the<br />
sense that they are <strong>of</strong> some social <strong>and</strong> cultural significance <strong>and</strong><br />
have implications for personal well-being. If specific personality<br />
measures were able to predict some <strong>of</strong> those complex behaviors,<br />
then certainly that would be remarkable.<br />
Not a lot <strong>of</strong> data exist demonstrating the utility <strong>of</strong> personality<br />
trait or factor measures in predicting complex criteria <strong>of</strong> the type<br />
described above (Funder, 2001). A notable exception has been in<br />
the area <strong>of</strong> industrial <strong>and</strong> organizational psychology. Dozens <strong>of</strong><br />
studies, summarized in several meta-analytic reviews, have shown<br />
that Conscientiousness is a good predictor <strong>of</strong> overall job performance<br />
in many occupations (e.g., see Barrick & Mount, 1991;<br />
Tett, Jackson, & Rothstein, 1991). Measures related to Conscientiousness<br />
have even been found to predict narrower criteria, such<br />
as job effort <strong>and</strong> irresponsible work behavior (Hough, 1992). In the<br />
area <strong>of</strong> educational psychology, <strong>Big</strong> <strong>Five</strong> factor measures sometimes<br />
have been used successfully to predict academic achievement.<br />
G<strong>of</strong>f <strong>and</strong> Ackerman (1992) reported that the Conscientiousness<br />
factor was positively related to undergraduate students’ grade<br />
point averages in their study, whereas Extraversion was negatively<br />
related. Paunonen <strong>and</strong> Ashton (2001b) showed that Conscientiousness<br />
but not Openness to Experience predicted the grades <strong>of</strong><br />
undergraduates enrolled in a course on personality theory. Using a<br />
different criterion <strong>of</strong> academic performance—classroom participation<br />
grades in a large sample <strong>of</strong> master’s <strong>of</strong> business administration<br />
students—Rothstein, Paunonen, Rush, <strong>and</strong> King<br />
(1994) found significant positive correlations for the Extraversion<br />
<strong>and</strong> Openness to Experience factors but no correlation for<br />
Conscientiousness.<br />
Although there have been some demonstrations <strong>of</strong> the utility <strong>of</strong><br />
<strong>Big</strong> <strong>Five</strong> factor measures in predicting work performance <strong>and</strong><br />
academic achievement, the better levels <strong>of</strong> predictive validity<br />
usually have been in the neighborhood <strong>of</strong> only .20. In some earlier<br />
work, I presented logical arguments <strong>and</strong> empirical data showing<br />
that the facets <strong>of</strong> the <strong>Big</strong> <strong>Five</strong> factors (i.e., the narrow personality<br />
traits that constitute each personality factor) can have even more<br />
utility than the factors themselves in predicting such complex,<br />
real-life criteria (Paunonen, 1993, 1998; Paunonen & Ashton,<br />
2001a, 2001b; Paunonen & Nicol, 2001; Paunonen, Rothstein, &<br />
Jackson, 1999). For example, in the study by Paunonen <strong>and</strong> Ashton<br />
(2001b), a broad measure <strong>of</strong> Conscientiousness predicted grade<br />
point average with a value <strong>of</strong> .20, but a narrower measure <strong>of</strong><br />
achievement motivation (a facet <strong>of</strong> Conscientiousness) predicted<br />
that criterion with a value <strong>of</strong> .26. Even more telling, in the<br />
Rothstein et al. (1994) study, Extraversion predicted classroom<br />
participation grades with a correlation <strong>of</strong> .19, whereas a measure <strong>of</strong><br />
exhibitionism (a facet <strong>of</strong> Extraversion) predicted the same criterion<br />
with a correlation <strong>of</strong> .33.<br />
Arithmetically combining several narrow trait or facet measures<br />
to derive a broad factor measure can have undesirable consequences.<br />
Some <strong>of</strong> the traits might be predictive <strong>of</strong> a criterion <strong>of</strong><br />
interest, <strong>and</strong> others might not. When the predictive <strong>and</strong> nonpredictive<br />
facets are aggregated in the pursuit <strong>of</strong> their common<br />
variance, the trait-specific but criterion-valid variance that exists in<br />
the former can be canceled by the trait-specific but nonpredictive<br />
variance in the latter. It is for this reason that I have argued that<br />
personality researchers <strong>and</strong> assessors should avoid the temptation<br />
to use short global measures <strong>of</strong> the <strong>Big</strong> <strong>Five</strong> personality factors<br />
instead <strong>of</strong> more specific <strong>Big</strong> <strong>Five</strong> facet or trait measures. The<br />
former assessment strategy might seem expeditious, because four<br />
or five factor measures are generally quicker to administer <strong>and</strong><br />
easier to interpret than are many more component facet measures.<br />
But my studies have indicated very real costs in adopting that<br />
expedient to personality measurement—less accuracy in behavior<br />
prediction <strong>and</strong> a poorer underst<strong>and</strong>ing <strong>of</strong> behavior determinants<br />
(see also Ashton, 1998; Ashton, Jackson, Paunonen, Helmes, &<br />
Rothstein, 1995; Mershon & Gorsuch, 1988).
414 PAUNONEN<br />
Purpose <strong>of</strong> This Study<br />
I have two primary goals in this study. First, despite the argument<br />
I advanced above that there are predictive benefits to using<br />
<strong>Big</strong> <strong>Five</strong> facets <strong>of</strong> personality over <strong>Big</strong> <strong>Five</strong> factors as predictors<br />
<strong>of</strong> complex criteria, it is nevertheless important to demonstrate that<br />
the latter also have some utility in that regard. Furthermore, as<br />
mentioned earlier, different (construct valid) measures <strong>of</strong> the same<br />
factors should show some agreement in the variables they are able<br />
to predict. Because I administered three different measures <strong>of</strong> the<br />
<strong>Big</strong> <strong>Five</strong> in this study <strong>and</strong> because I assessed many socially<br />
important criterion variables, I was able to evaluate these requisites<br />
<strong>of</strong> measurement validity in this research. Although some <strong>of</strong> the<br />
studies I have already cited have demonstrated predictive utility to<br />
certain <strong>Big</strong> <strong>Five</strong> factor measures, no study has yet applied such a<br />
st<strong>and</strong>ard <strong>of</strong> replication as I describe below to the prediction <strong>of</strong> such<br />
a large set <strong>of</strong> complex behaviors.<br />
My second goal in this study, related to the first, is to provide<br />
further evidence <strong>of</strong> convergent validity for the new nonverbal <strong>Big</strong><br />
<strong>Five</strong> questionnaire, the FF–NPQ. New measures <strong>of</strong> personality are<br />
required to show some degree <strong>of</strong> correlation with established<br />
measures <strong>of</strong> the same traits. This study provides me with an<br />
opportunity to evaluate this aspect <strong>of</strong> the FF–NPQ’s construct<br />
validity by comparing the nonverbal <strong>Big</strong> <strong>Five</strong> scales against corresponding<br />
verbal <strong>Big</strong> <strong>Five</strong> scales.<br />
Participants<br />
Method<br />
I administered measures <strong>of</strong> personality factors <strong>and</strong> behavior criteria to<br />
two different samples <strong>of</strong> university students. The first sample consisted <strong>of</strong><br />
276 introductory psychology students (152 men <strong>and</strong> 124 women), <strong>and</strong> the<br />
second sample consisted <strong>of</strong> 142 introductory psychology students (56 men<br />
<strong>and</strong> 86 women). Although I analyzed the data separately by sample, I<br />
discuss them together in terms <strong>of</strong> the consistencies <strong>of</strong> particular <strong>Big</strong> <strong>Five</strong><br />
factors in predicting specific criterion variables.<br />
Materials<br />
The FF–NPQ. Both samples <strong>of</strong> participants completed the FF–NPQ,<br />
which has already been described in the introduction. This questionnaire is<br />
a 60-item measure <strong>of</strong> the <strong>Big</strong> <strong>Five</strong> personality factors, with 12 nonverbal<br />
items on each factor scale. The items consist <strong>of</strong> pictorial depictions <strong>of</strong><br />
personality-relevant behaviors being performed in specific situations. Respondents<br />
rate the likelihood that they would engage in the types <strong>of</strong><br />
behaviors illustrated using 7-point rating scales (see Figure 1).<br />
The NEO–FFI <strong>and</strong> NEO–PI–R. One sample <strong>of</strong> participants completed<br />
the NEO–FFI, whereas the other sample completed the NEO–PI–R. Although<br />
both inventories are measures <strong>of</strong> the <strong>Big</strong> <strong>Five</strong> personality factors,<br />
the former is a 60-item questionnaire, <strong>and</strong> the latter is a 240-item questionnaire.<br />
The NEO–FFI was constructed to measure the five factors<br />
with 12 items each. The much longer NEO–PI–R consists <strong>of</strong> 30 eight-item<br />
facet scales, 6 <strong>of</strong> which are summed to derive each <strong>of</strong> the <strong>Big</strong> <strong>Five</strong> factor<br />
measures. The items on both inventories are rated by respondents on<br />
5-point scales. Note that the 60 items <strong>of</strong> the NEO–FFI constitute a subset<br />
<strong>of</strong> the 240 items in the NEO–PI–R.<br />
The <strong>Behavior</strong> Report Form. All participants completed the <strong>Behavior</strong><br />
Report Form, which is a measure I designed to assess several complex<br />
behaviors <strong>of</strong> some social significance. I first used it in Paunonen (1993)<br />
<strong>and</strong> Paunonen (1998) <strong>and</strong> later exp<strong>and</strong>ed <strong>and</strong> revised it (Paunonen &<br />
Ashton, 2001a). The four separate pages <strong>of</strong> the <strong>Behavior</strong> Report Form are<br />
reproduced in the Appendix. For the present analysis, I transformed a few<br />
<strong>of</strong> the behaviors measured by that form somewhat, for reasons that become<br />
apparent below (e.g., for Item 18, the total <strong>of</strong> all medications taken<br />
regularly was computed). I also omitted a few variables because <strong>of</strong> excessive<br />
missing data (e.g., for Item 12, almost no students were members <strong>of</strong><br />
a fraternity) or highly skewed data (e.g., for Item 20, very few students<br />
worked many hours at a part-time job). In addition, some variables were<br />
not analyzed because they did not represent behaviors as such (e.g., the<br />
rating <strong>of</strong> eyesight in Item 19) or were redundant with other variables (e.g.,<br />
in Item 9, the number <strong>of</strong> cigarettes smoked per day was highly redundant<br />
with the smoking behavior rating).<br />
The specific <strong>Behavior</strong> Report Form variables evaluated in this study <strong>and</strong><br />
used as behavior criteria number 27 in all. These criteria, with their labels<br />
in italics, include (1) self-perceived attractiveness, (2) self-perceived intelligence,<br />
(3) self-perceived popularity, (4) self-perceived femininity, (5)<br />
self-perceived religiosity, (6) self-perceived honesty, (7) grade point average,<br />
(8) dating frequency as number <strong>of</strong> dates per month, (9) dating<br />
variety as number <strong>of</strong> different people dated over a year, (10) tobacco<br />
consumption as the 5-point rating <strong>of</strong> smoking behavior, (11) alcohol<br />
consumption as the 5-point rating <strong>of</strong> drinking behavior, (12) preference for<br />
a liberal arts program <strong>of</strong> study, (13) 9-point rating <strong>of</strong> interest in fraternity<br />
or sorority membership, (14) mean number <strong>of</strong> all traffic violations received<br />
per year, (15) driving fast as the maximum speed driving a car, (16) money<br />
spent buying lottery tickets per month, (17) number <strong>of</strong> parties attended per<br />
month, (18) having engaged in long-term dieting behavior, (19) total<br />
number <strong>of</strong> prescription medications used regularly, (20) preference for<br />
contacts over glasses as prescription lenses, (21) engaged in part-time<br />
work, (22) ability to play musical instruments, (23) participation in sports,<br />
(24) performing routine exercise, (25) donating blood occasionally, (26) an<br />
obesity index defined by weight/height 2 , <strong>and</strong> (27) participant sex or gender.<br />
(Sex was also used in this study as a covariate in analyses <strong>of</strong> the other<br />
criteria.) Note that four <strong>of</strong> the criteria listed above were computed variables,<br />
based on combinations <strong>of</strong> two or more <strong>Behavior</strong> Report Form items<br />
(i.e., Criteria 14, 19, 20, <strong>and</strong> 26).<br />
Note also that the first six criterion variables listed above are each<br />
qualified by the term self-perceived. This labeling is to highlight the fact<br />
that ratings on those variables do not necessarily reflect objective levels <strong>of</strong><br />
the nominal attributes (i.e., attractiveness, intelligence, popularity, femininity,<br />
religiosity, <strong>and</strong> honesty). Instead, those ratings are best thought <strong>of</strong><br />
in this study as representing behaviors related to the self-evaluation <strong>of</strong><br />
those physical or psychological characteristics that, for a variety <strong>of</strong> reasons,<br />
might not agree well with more objective assessments. To illustrate,<br />
self-perceived physical attractiveness could be a complexly determined<br />
belief, based on one’s interpersonal experiences, personal st<strong>and</strong>ard <strong>of</strong><br />
beauty, social comparison network, self-enhancement tendency, <strong>and</strong> so<br />
forth, including some element <strong>of</strong> objective beauty. This issue <strong>of</strong> selfperception<br />
versus objective assessment <strong>and</strong> the validity <strong>of</strong> the <strong>Behavior</strong><br />
Report Form variables is raised again in the Discussion section <strong>of</strong> this<br />
article.<br />
Procedure<br />
I administered the <strong>Big</strong> <strong>Five</strong> personality factor measures <strong>and</strong> the behavior<br />
criterion measures to the two samples <strong>of</strong> university undergraduates. The<br />
first sample (n 276) completed the FF–NPQ, the NEO–FFI, <strong>and</strong> the<br />
<strong>Behavior</strong> Report Form. Because <strong>of</strong> an oversight on the part <strong>of</strong> a research<br />
assistant, data were collected from only 178 <strong>of</strong> the respondents with the<br />
FF–NPQ. Also, 3 students failed to complete the NEO–FFI. The second<br />
sample (n 142) completed the FF–NPQ, the NEO–PI–R, <strong>and</strong> the <strong>Behavior</strong><br />
Report Form. Seven students in that sample failed to complete the<br />
NEO–PI–R.
BIG FIVE PREDICTORS<br />
415<br />
Results<br />
<strong>Big</strong> <strong>Five</strong> Scale Summary Statistics<br />
Table 1 lists some <strong>of</strong> the statistics obtained from the four<br />
personality assessments <strong>of</strong> participants using the FF–NPQ (two<br />
assessments), the NEO–FFI, <strong>and</strong> the NEO–PI–R. Comparison <strong>of</strong><br />
the scale means for the three different inventories shows that,<br />
although no measure was conspicuously far from the midpoint <strong>of</strong><br />
its items’ rating scale (7-point rating scale for the FF–NPQ items,<br />
<strong>and</strong> 5-point rating scale for the NEO–FFI <strong>and</strong> NEO–PI–R items),<br />
the Neuroticism scale scores were below that midpoint in all four<br />
assessments, whereas all other scale scores were above the midpoint.<br />
The apparent differences in the st<strong>and</strong>ard deviations <strong>of</strong> the<br />
factors’ mean scores between the nonverbal measures <strong>and</strong> the<br />
verbal measures most likely reflect the differences in the item<br />
rating scales used by the inventories (i.e., 7-point vs. 5-point rating<br />
scales, respectively).<br />
The alpha coefficients <strong>of</strong> internal consistency are shown for<br />
each <strong>Big</strong> <strong>Five</strong> scale in the last column <strong>of</strong> Table 1 <strong>and</strong> indicate good<br />
levels <strong>of</strong> reliability for all measures. Note that the NEO–PI–R<br />
scales had higher reliabilities, in general, than did the other scales.<br />
This is no doubt due to the length <strong>of</strong> the former scales, at 48 items<br />
each, compared with only 12 items each for the other scales.<br />
Observe also that the FF–NPQ reliabilities were slightly higher<br />
than were the NEO–FFI reliabilities for the scales <strong>of</strong> Extraversion,<br />
Openness, <strong>and</strong> Agreeableness but slightly lower for Neuroticism<br />
<strong>and</strong> Conscientiousness.<br />
Table 1<br />
Summary Statistics for <strong>Big</strong> <strong>Five</strong> <strong>Personality</strong> Factor Measures<br />
Measure No. items M SD <br />
FF–NPQ (n 178)<br />
Neuroticism 12 3.61 1.01 .81<br />
Extraversion 12 4.36 1.08 .87<br />
Openness 12 4.65 1.02 .85<br />
Agreeableness 12 5.21 1.04 .85<br />
Conscientiousness 12 4.52 0.75 .79<br />
FF–NPQ (n 142)<br />
Neuroticism 12 3.85 0.98 .80<br />
Extraversion 12 4.16 0.92 .81<br />
Openness 12 4.63 0.91 .82<br />
Agreeableness 12 5.15 0.91 .80<br />
Conscientiousness 12 4.74 0.76 .74<br />
NEO–FFI (n 273)<br />
Neuroticism 12 2.65 0.68 .86<br />
Extraversion 12 3.66 0.49 .79<br />
Openness 12 3.36 0.52 .72<br />
Agreeableness 12 3.65 0.50 .76<br />
Conscientiousness 12 3.45 0.60 .86<br />
NEO–PI–R (n 135)<br />
Neuroticism 48 2.97 0.40 .89<br />
Extraversion 48 3.50 0.36 .87<br />
Openness 48 3.42 0.36 .86<br />
Agreeableness 48 3.41 0.34 .87<br />
Conscientiousness 48 3.27 0.36 .87<br />
Note. Mean scores represent the average 7-point item rating for the<br />
FF–NPQ scales <strong>and</strong> the average 5-point item rating for the NEO–FFI <strong>and</strong><br />
NEO–PI–R scales. FF–NPQ <strong>Five</strong>-Factor Nonverbal <strong>Personality</strong> Questionnaire;<br />
NEO–FFI NEO <strong>Five</strong>-Factor Inventory; NEO–PI–R Revised<br />
NEO <strong>Personality</strong> Inventory.<br />
<strong>Big</strong> <strong>Five</strong> Scale Intercorrelations<br />
Table 2 shows the monomethod–heterotrait correlations <strong>of</strong> the<br />
<strong>Big</strong> <strong>Five</strong> factors measured using different inventories. The overall<br />
level <strong>of</strong> scale relatedness in each <strong>of</strong> the four data sets was about the<br />
same, as indicated by the size <strong>of</strong> the first eigenvalue <strong>of</strong> each<br />
correlation matrix (1.82, 1.99, 1.74, <strong>and</strong> 1.89, respectively). However,<br />
some differences can be discerned between the specific<br />
correlations among the FF–NPQ scales <strong>and</strong> those among the two<br />
verbal measures. For example, Neuroticism was consistently correlated<br />
negatively with the other four factor scales in both the<br />
NEO–FFI <strong>and</strong> the NEO–PI–R inventories (consistent with a desirability<br />
response bias interpretation). In the case <strong>of</strong> the FF–NPQ,<br />
however, those correlations were slightly positive, even noticeably<br />
positive in the case <strong>of</strong> Neuroticism’s correlation with Conscientiousness<br />
(consistent with an acquiescence bias interpretation—<br />
with the exception <strong>of</strong> the Agreeableness scale, the items <strong>of</strong> the<br />
FF–NPQ scales are all positively keyed.) Other differences were<br />
that Extraversion <strong>and</strong> Agreeableness were positively correlated in<br />
the verbal scales but were uncorrelated in the nonverbal scales <strong>and</strong><br />
that Openness <strong>and</strong> Conscientiousness were correlated in the FF–<br />
NPQ inventory but not in the NEO–FFI or NEO–PI–R inventories.<br />
The differences in scale correlations described above suggest<br />
that the nonverbal items <strong>and</strong> the verbal items may be measuring<br />
somewhat different aspects <strong>of</strong> the same <strong>Big</strong> <strong>Five</strong> factors. However,<br />
despite these differences in heterotrait correlations, the FF–NPQ<br />
correlated .55 on average with the corresponding NEO–FFI factor<br />
scales in the first sample’s data (Neuroticism .57, Extraversion<br />
.51, Openness .64, Agreeableness .48, Conscientiousness<br />
.56; in contrast, the mean absolute value <strong>of</strong> the<br />
heteromethod–heterotrait correlations was appropriately low at<br />
only .11). Coincidentally, the FF–NPQ also correlated .55 with the<br />
NEO–PI–R scales in the second sample’s data (Neuroticism .51,<br />
Extraversion .57, Openness .63, Agreeableness .58, Conscientiousness<br />
.46, with a mean absolute heteromethod–<br />
heterotrait correlation <strong>of</strong> only .17). These convergent validity<br />
values between the verbal <strong>and</strong> nonverbal scales are not much lower<br />
than the .59 mean correlation reported between NEO–FFI factor<br />
scales <strong>and</strong> adjective-based <strong>Big</strong> <strong>Five</strong> marker variables (Costa &<br />
McCrae, 1992, p. 54).<br />
The results <strong>of</strong> the heterotrait <strong>and</strong> monotrait comparisons for the<br />
present <strong>Big</strong> <strong>Five</strong> inventories suggest a convergence <strong>of</strong> the corresponding<br />
factor measures. However, the verbal <strong>and</strong> nonverbal<br />
scales are probably measuring slightly different variants <strong>of</strong> the<br />
same personality dimensions. As has been noted elsewhere (e.g.,<br />
Paunonen et al., 1992), certain behaviors are more easily represented<br />
with verbal items than with nonverbal items. This limits, to<br />
some extent, the range <strong>of</strong> trait content that can be incorporated in<br />
nonverbal personality scales <strong>of</strong> the type found in the FF–NPQ.<br />
<strong>Replicated</strong> Significant <strong>Big</strong> <strong>Five</strong> Predictors<br />
As an overall summary <strong>of</strong> how well the <strong>Big</strong> <strong>Five</strong> inventories<br />
could predict the present criteria, I first computed the multiple<br />
correlations between the five factor scales in an inventory <strong>and</strong> each<br />
behavior criterion. Averaged across all 27 criteria used in this<br />
study, the mean multiple correlations for the two FF–NPQ data<br />
sets were .27 <strong>and</strong> .28 (n 178 <strong>and</strong> n 142, respectively). The<br />
corresponding mean multiple correlations were .27 for the NEO–
416 PAUNONEN<br />
Table 2<br />
Scale Intercorrelations for <strong>Big</strong> <strong>Five</strong> <strong>Personality</strong> Factor<br />
Measures<br />
Measure 1 2 3 4 5<br />
FF–NPQ (n 178)<br />
1. Neuroticism — .05 .06 .11 .27<br />
2. Extraversion — .18 .05 .05<br />
3. Openness — .37 .38<br />
4. Agreeableness — .34<br />
5. Conscientiousness —<br />
FF–NPQ (n 142)<br />
1. Neuroticism — .16 .14 .05 .38<br />
2. Extraversion — .22 .08 .18<br />
3. Openness — .42 .48<br />
4. Agreeableness — .29<br />
5. Conscientiousness —<br />
NEO–FFI (n 273)<br />
1. Neuroticism — .33 .14 .14 .18<br />
2. Extraversion — .17 .27 .19<br />
3. Openness — .09 .02<br />
4. Agreeableness — .25<br />
5. Conscientiousness —<br />
NEO–PI–R (n 135)<br />
1. Neuroticism — .26 .14 .17 .27<br />
2. Extraversion — .40 .33 .11<br />
3. Openness — .26 .11<br />
4. Agreeableness — .12<br />
5. Conscientiousness —<br />
Note. FF–NPQ <strong>Five</strong>-Factor Nonverbal <strong>Personality</strong> Questionnaire;<br />
NEO–FFI NEO <strong>Five</strong>-Factor Inventory; NEO–PI–R Revised NEO<br />
<strong>Personality</strong> Inventory.<br />
FFI (n 273) <strong>and</strong> .33 for the much longer NEO–PI–R (n 135).<br />
These multiple correlations indicate some degree <strong>of</strong> criterion predictiveness<br />
to the factor measures overall, but they do not indicate<br />
the extent to which the three personality inventories were able to<br />
replicate each other in the prediction <strong>of</strong> specific criterion variables<br />
across the four data sets.<br />
I chose to identify replicated factor predictors <strong>of</strong> the present<br />
behavior criteria by comparing correlations <strong>of</strong> each <strong>Big</strong> <strong>Five</strong> factor<br />
scale with each criterion across the four personality assessments.<br />
These were partial correlations, in which participant sex or gender<br />
was removed. Simple sex differences on the criterion <strong>and</strong> predictor<br />
variables could contribute to a correlation between those variables<br />
that does not exist within the sexes. (Gender was not partialed, <strong>of</strong><br />
course, when participant sex was the criterion variable.)<br />
For these analyses, I had to set some st<strong>and</strong>ard <strong>of</strong> replication in<br />
factor–criterion correlations across the four personality assessments<br />
(i.e., the NEO–FFI, NEO–PI–R, <strong>and</strong> two FF–NPQ assessments).<br />
I decided on the following arbitrary decision rule: If the<br />
four correlations for a particular factor–criterion combination were<br />
all in the same direction <strong>and</strong> at least three <strong>of</strong> the four were<br />
statistically significant ( p .05), then I would conclude that the<br />
empirical finding replicated across the four data sets. When this<br />
decision rule is used, the Type I error rate is appropriately small for<br />
each replication evaluation. The probability <strong>of</strong> finding four out <strong>of</strong><br />
four empirical tests significant, with a predictor–criterion association<br />
that is actually zero in the population, is .00000625. When<br />
one allows for three or four tests to be significant, that probability<br />
is still small at .00048125. Furthermore, the experimentwise Type<br />
I error rate for this procedure, considered across all five factor<br />
predictors <strong>and</strong> 27 criteria, is less than .065.<br />
Table 3 lists the replicated factor–criterion correlations found<br />
across the four data sets. Overall, 12 <strong>of</strong> the 27 criteria were<br />
predicted by the same factors in each <strong>of</strong> the four assessments.<br />
Those criteria are ordered in the table roughly in terms <strong>of</strong> the<br />
strength <strong>of</strong> the associations. For example, sex differences on the<br />
factor scales were the strongest predictors <strong>of</strong> participant gender,<br />
with the men in the samples being consistently lower in Neuroticism,<br />
Agreeableness, <strong>and</strong> Conscientiousness than were the women.<br />
Self-perceptions <strong>of</strong> intelligence were also consistently <strong>and</strong> well<br />
predicted by scores on the Neuroticism (low), Openness, <strong>and</strong><br />
Conscientiousness factor scales. The <strong>Big</strong> <strong>Five</strong> factor scales in the<br />
present data were further able to predict such important variables<br />
as alcohol consumption (high Extraversion, low Conscientiousness)<br />
<strong>and</strong> tobacco consumption (low Agreeableness).<br />
<strong>Replicated</strong> Nonsignificant <strong>Big</strong> <strong>Five</strong> Predictors<br />
In evaluating the generalizability <strong>of</strong> different <strong>Big</strong> <strong>Five</strong> factor<br />
measures as predictors <strong>of</strong> the present criteria, it is also relevant to<br />
consider the null results. That is, it is important to know the extent<br />
to which the factor scales are in agreement in not being able to<br />
predict a particular criterion. For this evaluation, I used the following<br />
arbitrary decision rule for a replicated null finding: for each<br />
factor–criterion comparison, all four correlations nonsignificant<br />
( p .05) or, at most, one significant correlation <strong>and</strong> three<br />
nonsignificant.<br />
One way to guarantee replicated nonsignificant results, <strong>of</strong><br />
course, is to ensure low power in one’s statistical tests. Low power,<br />
however, was not a major issue in the present analyses. Assuming<br />
a small to medium effect size for a factor–criterion correlation <strong>of</strong><br />
.20 in the population, the probabilities <strong>of</strong> correctly detecting that<br />
association (i.e., power) in the four data samples <strong>of</strong> this study (with<br />
.05) are about .86 for n 178, .77 for n 142, .95 for n <br />
273, <strong>and</strong> .75 for n 135 (Cohen, 1988, p. 87). Therefore, the<br />
probabilities <strong>of</strong> erroneously finding a null result (i.e., committing<br />
a Type II error) in any single statistical test with those four samples<br />
are about .14, .23, .05, <strong>and</strong> .25, respectively.<br />
Using the lowest estimated level <strong>of</strong> power for the individual<br />
statistical tests in this study (i.e., .75 for n 135), one can<br />
compute the probability <strong>of</strong> making a Type II error when using the<br />
conjoint decision rule I set for replicated null results. That is, if one<br />
accepts either three or four nonsignificant findings as a replicated<br />
null effect, what is the probability that one would erroneously<br />
conclude that the factor–criterion correlation is zero when in fact<br />
it is .20 in the population? The probability <strong>of</strong> obtaining exactly<br />
four out <strong>of</strong> four nonsignificant statistical tests under the present<br />
conditions is less than .0039. The probability <strong>of</strong> three or four<br />
nonsignificant results is still acceptably low at less than .0507.<br />
These values represent liberal estimates <strong>of</strong> the present Type II<br />
error rate because they are based on only the data sample yielding<br />
the least powerful statistical tests.<br />
Applying my st<strong>and</strong>ard <strong>of</strong> (lack <strong>of</strong>) prediction, I found very high<br />
consistency <strong>of</strong> results in the present data. Consider first the 12<br />
criteria listed in Table 3. That table represents 60 independent<br />
factor–criterion evaluations (five factors 12 criteria), <strong>of</strong><br />
which 18 were judged to have replicated across the four data sets<br />
with significant predictions (as shown in the 18 rows <strong>of</strong> the table).
BIG FIVE PREDICTORS<br />
417<br />
Table 3<br />
<strong>Replicated</strong> Partial Correlations (With Sex Removed) Between Criteria <strong>and</strong><br />
<strong>Big</strong> <strong>Five</strong> Factor Scales<br />
Criterion<br />
Factor scale<br />
FF–NPQ<br />
(n 178)<br />
FF–NPQ<br />
(n 142)<br />
NEO–FFI<br />
(n 273)<br />
NEO–PI–R<br />
(n 135)<br />
Participant sex a Neuroticism .53*** .54*** .31*** .20*<br />
Agreeableness .33*** .23** .25*** .23**<br />
Conscientiousness .19** .30*** .06 .22*<br />
Intelligence Neuroticism .23** .12 .30*** .33***<br />
Openness .13* .24** .25*** .32***<br />
Conscientiousness .07 .17* .20*** .36***<br />
Alcohol consumption Extraversion .30*** .33*** .14* .24**<br />
Conscientiousness .21*** .15 .26*** .29***<br />
Honesty Agreeableness .23*** .19* .17** .26**<br />
Conscientiousness .25*** .12 .27*** .27***<br />
Popularity Extraversion .39*** .36*** .39*** .51***<br />
Parties attended Extraversion .31*** .33*** .29*** .33***<br />
Grade point average Conscientiousness .23*** .13 .27*** .19*<br />
Plays musical instruments Openness .19** .24** .19** .20*<br />
Attractiveness Extraversion .25*** .07 .35*** .18*<br />
Tobacco consumption Agreeableness .23*** .16 .26*** .18*<br />
Dating variety Extraversion .17** .24** .07 .28***<br />
Routinely exercises Extraversion .23*** .18* .29*** .14<br />
Note. FF–NPQ <strong>Five</strong>-Factor Nonverbal <strong>Personality</strong> Questionnaire; NEO–FFI NEO <strong>Five</strong>-Factor Inventory;<br />
NEO–PI–R Revised NEO <strong>Personality</strong> Inventory.<br />
a Participant sex was not partialed.<br />
* p .05. ** p .01. *** p .001.<br />
Of the remaining 42 evaluations (60 18), 37 replicated across<br />
data sets with nonsignificant predictions (i.e., 88%). Thus, in<br />
only 5 cases (12%) were there some noteworthy disagreements<br />
among the four personality assessments in terms <strong>of</strong> whether a<br />
particular factor predicted a particular criterion. What <strong>of</strong> the predictions<br />
<strong>of</strong> the other 15 criteria not listed in Table 3? Their absence<br />
from that table means that none <strong>of</strong> those criteria met my st<strong>and</strong>ard<br />
<strong>of</strong> replicated significant predictions. For the st<strong>and</strong>ard <strong>of</strong> replicated<br />
null predictions, however, the large majority <strong>of</strong> the results for<br />
those 15 criteria showed consistency. Of the 75 evaluations <strong>of</strong><br />
replicated null effects (five factors 15 criteria), 67 <strong>of</strong> them<br />
agreed in their results across the different <strong>Big</strong> <strong>Five</strong> assessments<br />
(89%).<br />
Nonreplicated <strong>Big</strong> <strong>Five</strong> Predictors<br />
The present evaluations <strong>of</strong> the predictive generalizability <strong>of</strong> <strong>Big</strong><br />
<strong>Five</strong> factor measures across different inventories have shown substantially<br />
positive results overall, in terms <strong>of</strong> both replicated significant<br />
predictions <strong>and</strong> replicated null predictions. But there may<br />
be an additional informative value in studying the discrepant<br />
findings, in which some <strong>Big</strong> <strong>Five</strong> factor measures predicted a<br />
criterion but others did not. The specific discrepancies in factor–<br />
criterion predictions found in this study, based on correlations that<br />
failed the above-mentioned tests for replicated significant <strong>and</strong><br />
replicated nonsignificant results, are listed in Table 4. The 13<br />
behavior criteria listed in that table have been organized to highlight<br />
possible reasons for the discrepant findings in those particular<br />
cases.<br />
Note the pattern <strong>of</strong> factor–criterion relations for the four personality<br />
assessments <strong>and</strong> the first seven criteria listed in Table 4.<br />
In each <strong>of</strong> those cases, the verbal NEO–FFI <strong>and</strong> NEO–PI–R<br />
questionnaires resulted in the same factor predicting the same<br />
criterion, whereas the nonverbal FF–NPQ measures failed to replicate<br />
those results. This pattern <strong>of</strong> correlations suggests that there<br />
is possibly some difference in the content <strong>of</strong> the verbal <strong>and</strong><br />
nonverbal scales that gives one an advantage over the other in the<br />
prediction <strong>of</strong> certain criterion variables. As an example, the NEO–<br />
PI–R Neuroticism scale contains statements intended to measure<br />
self-consciousness, referring to a tendency to suffer feelings <strong>of</strong><br />
inferiority or discomfort when being scrutinized by others. Such<br />
behaviors are difficult to convey with nonverbal personality items<br />
<strong>of</strong> the type used in this study <strong>and</strong>, therefore, are not represented in<br />
the FF–NPQ Neuroticism measure. This might explain why the<br />
verbal Neuroticism scale but not the nonverbal scale predicted<br />
(low) self-perceived attractiveness.<br />
The next four criteria listed in Table 4 (Rows 8 to 11) show<br />
systematic discrepancies in factor–criterion correlations across the<br />
two independent samples <strong>of</strong> participants. Specifically, Agreeableness<br />
predicted religiosity, <strong>and</strong> Openness to Experience predicted<br />
preference for liberal arts study in the smaller sample <strong>of</strong> participants<br />
(n 142) but not in the larger sample (n 276). The<br />
opposite sample effects were true for Agreeableness predicting<br />
dieting behavior <strong>and</strong> driving fast, both being significant (<strong>and</strong><br />
negative) in the larger sample but not in the smaller sample. These<br />
results suggest that the participants in the two samples may have<br />
had slightly different personality compositions or different underlying<br />
behavior determinants.<br />
The discrepant correlations for the last two factor–criterion<br />
combinations listed in Table 4 (Rows 12 <strong>and</strong> 13) are not interpretable<br />
in terms <strong>of</strong> differences in the verbal versus nonverbal personality<br />
assessments. Nor are they interpretable in terms <strong>of</strong> Sample 1<br />
versus Sample 2 participant differences. It is likely that those
418 PAUNONEN<br />
Table 4<br />
Nonreplicated Partial Correlations (With Sex Removed) Between Criteria <strong>and</strong> <strong>Big</strong> <strong>Five</strong> Factor<br />
Scales<br />
Criterion<br />
Factor scale<br />
FF–NPQ<br />
(n 178)<br />
FF–NPQ<br />
(n 142)<br />
NEO–FFI<br />
(n 273)<br />
NEO–PI–R<br />
(n 135)<br />
Attractiveness Neuroticism .01 .08 .25*** .23**<br />
Dating frequency Conscientiousness .02 .10 .14* .21*<br />
Fraternity interest Extraversion .11 .14 .16* .19*<br />
Participation in sports Extraversion .10 .12 .13* .26**<br />
Routinely exercises Neuroticism .13 .03 .19** .18*<br />
Traffic violations Conscientiousness .03 .02 .14* .20*<br />
Participant sex a Extraversion .08 .08 .14* .28**<br />
Religiosity Agreeableness .08 .25** .00 .19*<br />
Liberal arts Openness .06 .25** .10 .38***<br />
Dieting behavior Agreeableness .15* .05 .13* .04<br />
Driving fast Agreeableness .15* .17 .14* .17<br />
Tobacco consumption Extraversion .18** .13 .09 .22*<br />
Dating variety Agreeableness .19** .15 .10 .24**<br />
Note. FF–NPQ <strong>Five</strong>-Factor Nonverbal <strong>Personality</strong> Questionnaire; NEO–FFI NEO <strong>Five</strong>-Factor Inventory;<br />
NEO–PI–R Revised NEO <strong>Personality</strong> Inventory.<br />
a Participant sex was not partialed.<br />
* p .05. ** p .01. *** p .001.<br />
differences in prediction results are simply due to r<strong>and</strong>om measurement<br />
error.<br />
Paunonen <strong>and</strong> Ashton’s data (i.e., 72%), <strong>and</strong> all 18 were in the<br />
same direction as those shown in Table 3.<br />
Discussion<br />
My purpose in this study was to evaluate the utility <strong>and</strong> generalizability<br />
<strong>of</strong> different assessments <strong>of</strong> the <strong>Big</strong> <strong>Five</strong> factors <strong>of</strong><br />
personality as predictors <strong>of</strong> diverse behavior criteria. The criteria<br />
were argued to have wide-ranging social <strong>and</strong> cultural implications<br />
<strong>and</strong> included behaviors such as donating blood <strong>and</strong> driving automobiles<br />
at excessive speeds. These criterion variables are most<br />
likely complex variables in the sense that they are multifaceted <strong>and</strong><br />
multidetermined—they do not simply represent alternative measures<br />
<strong>of</strong> the <strong>Big</strong> <strong>Five</strong> factors. Such alternative personality factor<br />
measures should, <strong>of</strong> course, correlate with the present <strong>Big</strong> <strong>Five</strong><br />
predictors, but such evidence would not satisfy the purpose <strong>of</strong> this<br />
study regarding the evaluation <strong>of</strong> measurement utility <strong>and</strong><br />
generalizability. 1<br />
The results <strong>of</strong> this research generally support the interpretation<br />
that the present assessments <strong>of</strong> the <strong>Big</strong> <strong>Five</strong> factors <strong>of</strong> personality—using<br />
the NEO–FFI, NEO–PI–R, <strong>and</strong> a new five-factor measure<br />
called the FF–NPQ—are able, in many cases, to predict<br />
important behavior criteria. Furthermore, for the personality measures<br />
evaluated in this research, there was a remarkable consistency<br />
in their ability to predict those criteria. That consistency<br />
manifested itself in factor–criterion correlations that were well<br />
replicated, both in their significant effects <strong>and</strong> in their null effects.<br />
Some further replication <strong>of</strong> the present personality–behavior<br />
correlations can be found in related data presented by Paunonen<br />
<strong>and</strong> Ashton (2001a). In that study, our participants (N 141) also<br />
completed both the NEO–PI–R <strong>and</strong> the present version <strong>of</strong> the<br />
<strong>Behavior</strong> Report Form, among other measures. I have reviewed<br />
those data from the point <strong>of</strong> view <strong>of</strong> the 18 replicated partial<br />
correlations shown in Table 3. Of those 18 tests <strong>of</strong> predictor–<br />
criterion association, 13 were also significant ( p .05) in<br />
Validity <strong>of</strong> the <strong>Behavior</strong> Measures<br />
The behavior criterion variables used in this study were derived<br />
from participants’ self-ratings on individual items contained in the<br />
<strong>Behavior</strong> Report Form. One might legitimately question, therefore,<br />
the psychometric properties <strong>of</strong> those measures. The fact that they<br />
constitute single-item indicators <strong>of</strong> behavior suggests that they<br />
might be fraught with measurement error <strong>and</strong>, as a consequence,<br />
be <strong>of</strong> low reliability. Moreover, the fact that they constitute selfreports<br />
<strong>of</strong> behavior suggests that they might not agree with more<br />
objective behavior assessments <strong>and</strong>, as a result, might not be valid.<br />
I have argued in the past that criterion ratings such as those used<br />
in this study represent mostly innocuous self-reports <strong>of</strong> behavior<br />
occurrence or frequency <strong>and</strong>, therefore, are probably relatively<br />
reliable <strong>and</strong> valid (e.g., Paunonen, 1998; Paunonen & Ashton,<br />
2001a). For example, it seems reasonable to trust a person’s<br />
self-report <strong>of</strong> whether he or she wears eyeglasses, is enrolled in a<br />
liberal arts program <strong>of</strong> study, or works at a part-time job. Some <strong>of</strong><br />
the ratings, however, might be less trustworthy, because they<br />
involve a greater degree <strong>of</strong> subjective judgment <strong>and</strong>, thus, could be<br />
1 One might argue in this context that the criterion variables labeled as<br />
intelligence, femininity, religiosity, <strong>and</strong> honesty are merely narrow personality<br />
traits that each underlie some <strong>Big</strong> <strong>Five</strong> personality factor <strong>and</strong>, thus,<br />
ought to be predicted by those factors. However, although intelligence is<br />
expected to be related to the Openness to Experience factor, that<br />
individual-differences variable is not considered to be a facet <strong>of</strong> Openness<br />
or any other <strong>Big</strong> <strong>Five</strong> dimension (Allik & Realo, 1997; Costa & McCrae,<br />
1992, p. 55). Furthermore, masculinity–femininity, religiosity, <strong>and</strong> honesty<br />
have been empirically determined to be three behavior domains, among<br />
several others, that are also questionable as facets <strong>of</strong> the <strong>Big</strong> <strong>Five</strong> factor<br />
space (see Ashton et al., 2000; Paunonen & Jackson, 2000).
BIG FIVE PREDICTORS<br />
419<br />
prone to memory errors or desirability biases. In particular, the<br />
first six <strong>Behavior</strong> Report Form items might be problematic in this<br />
regard—the items that represent self-ratings <strong>of</strong> attractiveness, intelligence,<br />
popularity, masculinity–femininity, religiosity, <strong>and</strong><br />
honesty.<br />
Because <strong>of</strong> a well-founded concern about the psychometric<br />
properties <strong>of</strong> the present behavior criteria, empirical evidence <strong>of</strong><br />
their validities is <strong>of</strong> some interest. One can estimate such validities<br />
by, for example, correlating the participants’ self-reports on the<br />
behavior items with the reports <strong>of</strong> independent observers. I was, in<br />
fact, able to do this in the present study using data collected<br />
previously by Paunonen <strong>and</strong> Ashton (2001a). In that earlier study,<br />
we had participants living in a university residence (N 141)<br />
complete the <strong>Behavior</strong> Report Form in its usual self-rating format.<br />
We then asked each participant’s roommate to complete that<br />
questionnaire in a peer rating format, providing an independent<br />
report <strong>of</strong> each person’s behavior.<br />
The correlations between self-ratings <strong>and</strong> roommate ratings on<br />
each <strong>Behavior</strong> Report Form item, based on Paunonen <strong>and</strong> Ashton’s<br />
(2001a) data, are listed in Table 5, ordered by magnitude. (Correlations<br />
could not be computed for three <strong>of</strong> the <strong>Behavior</strong> Report<br />
Form items—fraternity membership, use <strong>of</strong> diabetes medication,<br />
<strong>and</strong> use <strong>of</strong> depression medication—because <strong>of</strong> a lack <strong>of</strong> response<br />
variance.) The validity estimates for the <strong>Behavior</strong> Report Form<br />
items ranged in size from .12 to .92, with the mean <strong>of</strong> .52. For three<br />
<strong>of</strong> the four computed behavior criteria used in this study, the<br />
self–peer correlations were as follows: preference for contact<br />
lenses .90, mean number <strong>of</strong> traffic violations .49, <strong>and</strong> total<br />
medication usage .45. (The computed obesity index could not be<br />
evaluated for validity because roommate judgments <strong>of</strong> weight <strong>and</strong><br />
height were not collected.)<br />
The sizes <strong>of</strong> the self–peer correlations for the present behavior<br />
ratings gain perspective if one compares them with typical results<br />
for personality measures. The mean correlation <strong>of</strong> .52 shown in<br />
Table 5 is as high as the .52 mean convergent validity reported by<br />
Paunonen <strong>and</strong> Jackson (1985, Table 2) between self-ratings <strong>and</strong><br />
roommate ratings on the trait scales <strong>of</strong> the <strong>Personality</strong> Research<br />
Form (PRF; Jackson, 1984). The .52 mean value for the <strong>Behavior</strong><br />
Report Form items is even higher than the .43 mean self–peer<br />
correlation reported for the domain scales <strong>of</strong> the NEO–PI–R<br />
(Costa & McCrae, 1992, Table 8). Unlike the present single-item<br />
measures, however, the PRF trait scales are 16-item measures, <strong>and</strong><br />
the NEO–PI–R domain scales are 48-item measures. Validity<br />
estimates for those personality scales, therefore, benefit from the<br />
aggregation <strong>of</strong> items. What is the size <strong>of</strong> the correlation between<br />
self <strong>and</strong> peer for only a single item on the PRF or the NEO–PI–R?<br />
If one uses the Spearman–Brown formula (Lord & Novick, 1968,<br />
p. 114) <strong>and</strong> assumes that the self-rated <strong>and</strong> peer-rated personality<br />
scales have reliabilities <strong>of</strong> .70 for the PRF <strong>and</strong> .90 for the NEO–<br />
PI–R (close to those scales’ values reported in their respective<br />
manuals), the expected correlation between self-ratings <strong>and</strong> peer<br />
ratings on any single personality item is only .10 for the PRF <strong>and</strong><br />
.09 for the NEO–PI–R. As is evident in Table 5, the single items<br />
<strong>of</strong> the <strong>Behavior</strong> Report Form well exceeded this region <strong>of</strong> measurement<br />
validity (a notable exception being the .12 correlation<br />
between self-ratings <strong>and</strong> peer ratings <strong>of</strong> attractiveness).<br />
Note in Table 5 that the relatively high correlations between<br />
self-reports <strong>and</strong> peer reports on some variables are not unexpected,<br />
such as whether one wears glasses (r .86) <strong>and</strong> contact lenses<br />
Table 5<br />
Self–Peer Correlations for <strong>Behavior</strong> Report Form Items<br />
Item no. Item label r<br />
9a Tobacco consumption .92<br />
9b Number <strong>of</strong> cigarettes .92<br />
19c Wears contacts .90<br />
19b Wears glasses .86<br />
18a Asthma medication .84<br />
20a Part-time work .73<br />
10b Number <strong>of</strong> drinks .70<br />
19a Eyesight .69<br />
7 Grade-point average .66<br />
21c Routinely exercises .65<br />
10a Alcohol consumption .64<br />
11 Liberal arts .60<br />
15 Buys lottery tickets .60<br />
13b Speeding tickets .58<br />
21b Participation in sports .58<br />
14 High school grade .57<br />
20b Part-time hours .56<br />
21a Plays musical instruments .56<br />
5 Religiosity .55<br />
13a Driving experience .52<br />
18b Allergy medication .45<br />
21d Blood donations .42<br />
8b Dating variety .41<br />
12b Fraternity interest .39<br />
13d Other traffic violations .38<br />
8a Dating frequency .37<br />
2 Intelligence .35<br />
13c Parking tickets .34<br />
13e Driving fast .33<br />
17 Dieting behavior .32<br />
4 Femininity .30<br />
18e Other medication .30<br />
6 Honesty .23<br />
3 Popularity .21<br />
16 Parties attended .20<br />
1 Attractiveness .12<br />
12a<br />
Fraternity membership<br />
18c<br />
Diabetes medication<br />
18d<br />
Depression medication<br />
Note. Empty cells indicate that the correlation was not computed for the<br />
item because <strong>of</strong> lack <strong>of</strong> response variance.<br />
(r .90), works at a part-time job (r .73), takes asthma<br />
medication (r .84), or participates in sports (r .58). But there<br />
are other variables with high validities that are, perhaps, somewhat<br />
surprising. Those variables include ratings <strong>of</strong> alcohol <strong>and</strong> tobacco<br />
consumption (r .64 <strong>and</strong> .92, respectively) <strong>and</strong> estimates <strong>of</strong><br />
number <strong>of</strong> drinks imbibed per week (r .70) <strong>and</strong> cigarettes<br />
smoked per day (r .92). One might expect self-ratings <strong>of</strong> those<br />
less-than-desirable habits to show somewhat lower consensus with<br />
peer ratings, because <strong>of</strong> a penchant for some people to minimize<br />
the presence <strong>of</strong> negative attributes in rating themselves, especially<br />
in an experimental context, but not necessarily in rating others.<br />
As surmised previously, self-ratings requiring more subjective<br />
judgments were not as highly correlated with the corresponding<br />
peer ratings. Specifically, ratings <strong>of</strong> attractiveness, popularity,<br />
honesty, femininity, <strong>and</strong> intelligence were near the bottom <strong>of</strong> the<br />
list in Table 5, with a mean estimated validity <strong>of</strong> only .24. The<br />
reason for their lower overall validity is probably that self-ratings<br />
on those variables are subject to self-enhancement biases that are
420 PAUNONEN<br />
not part <strong>of</strong> peer ratings. This is why it is important to emphasize<br />
that it was the self-perception <strong>of</strong> intelligence, for example, that was<br />
the variable <strong>of</strong> interest in the results reported in this study, <strong>and</strong> not<br />
intelligence as inferred by others or as measured more objectively<br />
(which helps to explain the negative correlations between intelligence<br />
<strong>and</strong> Neuroticism observed in Table 3). The same interpretation<br />
applies to the present analyses <strong>of</strong> the attractiveness, popularity,<br />
honesty, <strong>and</strong> femininity criteria. It is interesting that the<br />
religiosity self-ratings seem to have had a less subjective selfenhancement<br />
component to them, showing a relatively high convergence<br />
<strong>of</strong> .55 with peer ratings. 2<br />
In general, the self–peer correlations for the present criteria<br />
indicated behaviors about which independent observers showed<br />
good consensus in their ratings <strong>of</strong> occurrence or frequency. And as<br />
long as one acknowledges some <strong>of</strong> the self-assessments for what<br />
they are—namely, self-perceptions, <strong>and</strong> not objective measures, <strong>of</strong><br />
attractiveness, popularity, honesty, femininity, <strong>and</strong> intelligence—<br />
then it is maintained that the <strong>Behavior</strong> Report Form items are<br />
generally accurate indicators <strong>of</strong> behavior tendencies, having utility<br />
for behavior prediction research.<br />
Validity <strong>of</strong> the FF–NPQ<br />
I consider the consistency in behavior predictions found in this<br />
study to be remarkable mostly because <strong>of</strong> fundamental differences<br />
between the measures <strong>of</strong> the <strong>Big</strong> <strong>Five</strong> personality factors used. The<br />
FF–NPQ is substantially different in its items <strong>and</strong> format from the<br />
NEO–FFI <strong>and</strong> NEO–PI–R, despite the fact that the latter questionnaires<br />
were referred to in the construction <strong>of</strong> the former (see the<br />
FF–NPQ section in the introduction). The FF–NPQ is an experimental<br />
nonverbal personality questionnaire, whereas the NEO–FFI<br />
<strong>and</strong> the NEO–PI–R are st<strong>and</strong>ard verbal personality inventories.<br />
From this perspective, one would expect the two verbal forms to be<br />
much more similar to each other in their predictions than would<br />
either verbal form be to the nonverbal form. This is especially true<br />
<strong>of</strong> the present verbal assessments, because the items <strong>of</strong> the NEO–<br />
FFI are also the very same items found in the NEO–PI–R. However,<br />
the operations <strong>of</strong> all three questionnaires in predicting the<br />
criteria were quite similar. With the exception <strong>of</strong> a few cases<br />
described in Table 4, there was little evidence that the verbal forms<br />
were, in general, more similar to each other in predicting criterion<br />
variables than was either form to the nonverbal inventory.<br />
The results <strong>of</strong> this study not only support the claim that there are<br />
significant relations between the <strong>Big</strong> <strong>Five</strong> personality factors <strong>and</strong><br />
important behavior criteria but also support the construct validity<br />
<strong>of</strong> the new nonverbal measure <strong>of</strong> those factors, the FF–NPQ.<br />
(Simultaneously <strong>and</strong> equally, the results support the construct<br />
validity <strong>of</strong> the NEO–FFI <strong>and</strong> the NEO–PI–R.) Two sources <strong>of</strong><br />
evidence in this study can be interpreted as substantiating the<br />
assertion that the measured FF–NPQ variables reside well within<br />
the five-factor model <strong>of</strong> personality. First, there were the relatively<br />
high correlations between the FF–NPQ scales <strong>and</strong> the corresponding<br />
verbal scales <strong>of</strong> the NEO–FFI <strong>and</strong> the NEO–PI–R. Those<br />
verbal inventories represent well-established, construct valid personality<br />
measures in their own right. The second source <strong>of</strong> evidence<br />
verifying the assertion that the FF–NPQ scales measure the<br />
<strong>Big</strong> <strong>Five</strong> personality factors exists in the congruence <strong>of</strong> the nonverbal<br />
<strong>and</strong> verbal prediction results vis-à-vis the present behavior<br />
criteria. If the nonverbal items were measuring substantially different<br />
factors than were the items <strong>of</strong> the two verbal forms, their<br />
empirical prediction results would be expected to be noticeably<br />
different, which they most certainly were not. Some corroborating<br />
evidence <strong>of</strong> convergent validity between FF–NPQ <strong>and</strong> NEO–FFI<br />
measurements <strong>and</strong> criterion predictions has been reported by<br />
Paunonen et al. (2001). 3<br />
As mentioned in the introduction, a nonverbal personality questionnaire<br />
has certain advantages over verbal measures <strong>of</strong> the same<br />
constructs. These advantages pertain primarily to the measurement<br />
<strong>of</strong> personality in different language groups. The fact that the<br />
questionnaire’s items do not need to be translated into those<br />
languages means that cross-cultural research can be expedited.<br />
This is not to imply, however, that the FF–NPQ is a culture-free<br />
test. Its nonverbal items, in fact, are most relevant to educated,<br />
middle-class people in Western cultures. For detailed discussions<br />
<strong>of</strong> these <strong>and</strong> other issues related to using personality tests, both<br />
verbal <strong>and</strong> nonverbal, developed in one culture with people from<br />
another culture, see Paunonen (2000), Paunonen et al. (2001), <strong>and</strong><br />
Paunonen <strong>and</strong> Ashton (1998, 2002).<br />
Attenuated Levels <strong>of</strong> Prediction<br />
One might be tempted to consider the levels <strong>of</strong> factor–criterion<br />
correlation found in this study to be unsubstantial, the significant<br />
ones being mostly in the range <strong>of</strong> .20 to .30. One should remember,<br />
however, the various causes that tend to lower correlations <strong>of</strong> the<br />
type reported in this article. First, despite the relatively high<br />
validities <strong>of</strong> the present criterion measures (Table 5), both those<br />
criteria <strong>and</strong> the personality predictors scales still contain some<br />
amount <strong>of</strong> measurement error. That measurement error serves to<br />
attenuate the observed factor–criterion interrelations. Attenuationcorrected<br />
predictive validity coefficients would necessarily be<br />
higher than the correlation coefficients reported in this article.<br />
Another reason why the correlations in this study are not higher<br />
is because the criterion behaviors, as I have already stated, are<br />
2 We also had in our earlier study (Paunonen & Ashton, 2001a) university<br />
transcripts <strong>of</strong> the roommates’ grades. Their self-ratings <strong>of</strong> grade point<br />
averages on the <strong>Behavior</strong> Report Form correlated well with their university<br />
records (r .47) but not as highly as with their peers’ rated grades (r <br />
.66). The difference in those two correlations could be explained by a<br />
self-enhancement bias on the part <strong>of</strong> the students both in their reporting <strong>of</strong><br />
grade point averages on the <strong>Behavior</strong> Report Form <strong>and</strong> in their recounting<br />
<strong>of</strong> those grades in conversations with their roommates. Those roommates<br />
would generally have to rely on their partners’ verbal reports in making<br />
their peer ratings, having little access to more objective grade records.<br />
3 Verbal mediation is a process that might be relevant in explaining the<br />
similarity between the present verbal <strong>and</strong> nonverbal personality assessments.<br />
That is, when completing the FF–NPQ, respondents could have<br />
attached verbal labels to the behavior acts represented in the nonverbal<br />
items. Their FF–NPQ item ratings could then have been based on those<br />
verbal cues, cues that might be similar to the verbal information used to<br />
arrive at their NEO–FFI <strong>and</strong> NEO–PI–R item responses. But even if verbal<br />
mediation did occur on the nonverbal questionnaire items, it is still remarkable<br />
that the verbal <strong>and</strong> nonverbal results were so similar. The extra<br />
encoding step involved in making a nonverbal item response would be<br />
expected to add to unreliability in the nonverbal scale scores, because not<br />
everyone would be using the same encoding process <strong>and</strong> consequent verbal<br />
labels in arriving at their item responses (see Paunonen & Jackson, 1979,<br />
for further discussion <strong>of</strong> verbal mediation in responding to the present type<br />
<strong>of</strong> nonverbal personality item).
BIG FIVE PREDICTORS<br />
421<br />
probably multifaceted <strong>and</strong> multidetermined. This is to imply that<br />
<strong>Big</strong> <strong>Five</strong> personality factors are not the only variables involved in<br />
the determination <strong>of</strong> complex criteria such as grade point average,<br />
alcohol consumption, or tendency to engage in dieting behavior.<br />
Surely such behaviors have multiple causes, including genetic<br />
predispositions, hormonal influences, various environmental determinants,<br />
<strong>and</strong> their interactions. <strong>Personality</strong> may, in fact, have<br />
only a minor influence on the behaviors evaluated in this research.<br />
The empirical factor–criterion correlations would be expected to<br />
improve to the extent that other relevant predictors are included in<br />
the analyses.<br />
A third reason why the correlations in this study are probably<br />
attenuated concerns the personality predictors themselves. Data<br />
have been presented elsewhere showing that, although the <strong>Big</strong> <strong>Five</strong><br />
factors <strong>of</strong> personality have some utility in predicting criterion<br />
behaviors <strong>of</strong> the type studied here, the constituent facets <strong>of</strong> those<br />
factors can do better in that regard (e.g., Ashton, 1998; Ashton et<br />
al., 1995; Mershon & Gorsuch, 1988; Paunonen, 1993, 1998;<br />
Paunonen et al., 1999; Paunonen & Ashton, 2001a, 2001b;<br />
Paunonen & Nicol, 2001; Rothstein et al., 1994). Consider the<br />
example <strong>of</strong> low Conscientiousness predicting alcohol consumption<br />
shown in Table 3. This (replicated) empirical finding might not<br />
make theoretical sense at first glance. However, Conscientiousness<br />
is a factor <strong>of</strong> personality that represents several distinct but correlated<br />
personality traits or facets. These facets purportedly include<br />
orderliness, achievement orientation, <strong>and</strong> self-discipline, among<br />
others. The aforementioned negative correlation could thus be<br />
entirely due to an inverse association between self-discipline <strong>and</strong><br />
alcohol consumption. It might have absolutely nothing to do with<br />
orderliness, achievement orientation, or any other facet <strong>of</strong> that<br />
factor. Consequently, combining several relatively narrow Conscientiousness<br />
facets together into a single indicator <strong>of</strong> that broad<br />
personality factor could actually lead to a lower coefficient <strong>of</strong><br />
prediction than would be obtained if the individual facets were<br />
treated as separate predictors.<br />
There is yet another reason for the seemingly low coefficients <strong>of</strong><br />
correlation reported between the present personality variables <strong>and</strong><br />
behavior criteria. There may be other variables, personality variables,<br />
that might be implicated in the prediction <strong>of</strong> the behaviors<br />
but that were not included in this study. I refer not to the facets <strong>of</strong><br />
the <strong>Big</strong> <strong>Five</strong> personality factors mentioned in the preceding paragraph<br />
but to other lower level personality traits that do not fit well<br />
into the five-factor model <strong>of</strong> personality structure <strong>and</strong>, hence, are<br />
not incorporated as components <strong>of</strong> typical <strong>Big</strong> <strong>Five</strong> factor measures.<br />
I have studied such variables (Paunonen & Jackson, 2000)<br />
<strong>and</strong> concluded that there might be several well-defined personality<br />
traits that exist beyond the <strong>Big</strong> <strong>Five</strong> factors (cf. Saucier & Goldberg,<br />
1998). Honesty is one possible example <strong>of</strong> such a dimension<br />
(see also Ashton, Lee, & Son, 2000). Including a measure <strong>of</strong><br />
honesty in the present study might have increased the prediction <strong>of</strong><br />
some <strong>of</strong> the behavior criteria, such as number <strong>of</strong> traffic violations,<br />
for instance. Other non-<strong>Big</strong> <strong>Five</strong> variables might have served as<br />
useful predictors <strong>of</strong> other criteria.<br />
There are many reasons why the present levels <strong>of</strong> factor–<br />
criterion correlation might be as high as can be expected under the<br />
circumstances. Changing those circumstances could readily lead to<br />
nontrivial improvements in the accuracies <strong>of</strong> behavior predictions.<br />
Adding different personality variables into the predictor set would<br />
be an easy first step. Less easy would be the identification <strong>and</strong><br />
assessment <strong>of</strong> relevant nonpersonality determinants <strong>of</strong> behavior,<br />
such as genetic factors, environmental influences, <strong>and</strong> their<br />
interplay.<br />
Conclusions<br />
The present results are interpreted as supporting the following<br />
conclusions. The <strong>Big</strong> <strong>Five</strong> factor inventories used in this study<br />
show a strong convergence in their measurements <strong>and</strong> predictions.<br />
That consistency <strong>of</strong> results supports the construct validity <strong>of</strong> those<br />
inventories. Furthermore, the replicated behavior predictions<br />
found in this research strongly implicate specific personality constructs<br />
as underlying determinants <strong>of</strong> specific complex behaviors.<br />
That conclusion notwithst<strong>and</strong>ing, it is argued that even better<br />
empirical predictions can be achieved if other variables are included<br />
in the battery <strong>of</strong> behavior predictors, leading to an even<br />
better underst<strong>and</strong>ing <strong>of</strong> the nomological network <strong>of</strong> behavior determinants.<br />
Those other variables might include (a) the narrow<br />
personality facets that constitute the broad <strong>Big</strong> <strong>Five</strong> factors, (b)<br />
personality traits that are largely independent <strong>of</strong> the <strong>Big</strong> <strong>Five</strong>, <strong>and</strong><br />
(c) other determinants <strong>of</strong> behavior related to genetics <strong>and</strong> the<br />
environment.<br />
References<br />
Allik, J., & Realo, A. (1997). Intelligence, academic abilities, <strong>and</strong> personality.<br />
<strong>Personality</strong> <strong>and</strong> Individual Differences, 23, 809–814.<br />
Ashton, M. C. (1998). <strong>Personality</strong> <strong>and</strong> job performance: The importance <strong>of</strong><br />
narrow traits. Journal <strong>of</strong> Organizational <strong>Behavior</strong>, 19, 289–303.<br />
Ashton, M. C., Jackson, D. N., Paunonen, S. V., Helmes, E., & Rothstein,<br />
M. G. (1995). The criterion validity <strong>of</strong> broad factor scales versus specific<br />
trait scales. Journal <strong>of</strong> Research in <strong>Personality</strong>, 29, 432–442.<br />
Ashton, M. C., Lee, K., & Son, C. (2000). Honesty as the sixth factor <strong>of</strong><br />
personality: Correlations with Machiavellianism, primary psychopathy,<br />
<strong>and</strong> social adroitness. European Journal <strong>of</strong> <strong>Personality</strong>, 14, 359–368.<br />
Barrick, M. R., & Mount, M. K. (1991). The <strong>Big</strong> <strong>Five</strong> personality dimensions<br />
<strong>and</strong> job performance: A meta-analysis. Personnel Psychology, 44,<br />
1–26.<br />
Cohen, J. (1988). Statistical power analysis for the behavioral sciences.<br />
Hillsdale, NJ: Erlbaum.<br />
Costa, P. T., Jr., & McCrae, R. R. (1992). Revised NEO <strong>Personality</strong><br />
Inventory (NEO–PI–R) <strong>and</strong> NEO <strong>Five</strong>-Factor Inventory (NEO–FFI)<br />
pr<strong>of</strong>essional manual. Odessa, FL: Psychological Assessment Resources,<br />
Inc.<br />
De Raad, B., & Perugini, M. (Eds.). (2002). <strong>Big</strong> <strong>Five</strong> assessment. Göttingen,<br />
Germany: Hogrefe & Huber.<br />
Digman, J. M. (1990). <strong>Personality</strong> structure: Emergence <strong>of</strong> the <strong>Five</strong>-Factor<br />
Model. Annual Review <strong>of</strong> Psychology, 41, 417–440.<br />
Funder, D. C. (2001). <strong>Personality</strong>. Annual Review <strong>of</strong> Psychology, 52,<br />
197–221.<br />
G<strong>of</strong>f, M., & Ackerman, P. L. (1992). <strong>Personality</strong>–intelligence relations:<br />
Assessment <strong>of</strong> typical intellectual engagement. Journal <strong>of</strong> Educational<br />
Psychology, 84, 537–552.<br />
Hough, L. M. (1992). The “<strong>Big</strong> <strong>Five</strong>” personality variables–construct<br />
confusion: Description versus prediction. Human Performance, 5, 139–<br />
155.<br />
Jackson, D. N. (1984). <strong>Personality</strong> Research Form manual. Port Huron,<br />
MI: Research Psychologists Press.<br />
Lord, F. M., & Novick, M. R. (1968). Statistical theories <strong>of</strong> mental test<br />
scores. Menlo Park, CA: Addison-Wesley.<br />
McCrae, R. R., & John, O. P. (1992). An introduction to the <strong>Five</strong>-Factor<br />
Model <strong>and</strong> its applications. Journal <strong>of</strong> <strong>Personality</strong>, 60, 175–215.
422 PAUNONEN<br />
Mershon, B., & Gorsuch, R. L. (1988). Number <strong>of</strong> factors in the personality<br />
sphere: Does increase in factors increase predictability <strong>of</strong> real-life criteria?<br />
Journal <strong>of</strong> <strong>Personality</strong> <strong>and</strong> Social Psychology, 55, 675–680.<br />
Paunonen, S. V. (1993, August). Sense, nonsense, <strong>and</strong> the <strong>Big</strong> <strong>Five</strong> factors<br />
<strong>of</strong> personality. Paper presented at the 101st Annual Convention <strong>of</strong> the<br />
American Psychological Association, Toronto, Ontario, Canada.<br />
Paunonen, S. V. (1998). Hierarchical organization <strong>of</strong> personality <strong>and</strong><br />
prediction <strong>of</strong> behavior. Journal <strong>of</strong> <strong>Personality</strong> <strong>and</strong> Social Psychology,<br />
74, 538–556.<br />
Paunonen, S. V. (2000). Construct validity <strong>and</strong> the search for crosssituational<br />
consistencies in personality. In R. D. G<strong>of</strong>fin & E. Helmes<br />
(Eds.), Problems <strong>and</strong> solutions in human assessment: Honoring Douglas<br />
N. Jackson at seventy (pp. 123–140). Norwell, MA: Kluwer.<br />
Paunonen, S. V., & Ashton, M. C. (1998). The structured assessment <strong>of</strong><br />
personality across cultures. Journal <strong>of</strong> Cross-Cultural Psychology, 29,<br />
150–170.<br />
Paunonen, S. V., & Ashton, M. C. (2001a). <strong>Big</strong> <strong>Five</strong> factors <strong>and</strong> facets <strong>and</strong><br />
the prediction <strong>of</strong> behavior. Journal <strong>of</strong> <strong>Personality</strong> <strong>and</strong> Social Psychology,<br />
81, 524–539.<br />
Paunonen, S. V., & Ashton, M. C. (2001b). <strong>Big</strong> <strong>Five</strong> predictors <strong>of</strong> academic<br />
achievement. Journal <strong>of</strong> Research in <strong>Personality</strong>, 35, 78–90.<br />
Paunonen, S. V., & Ashton, M. C. (2002). The nonverbal assessment <strong>of</strong><br />
personality: The NPQ <strong>and</strong> the FF–NPQ. In B. De Raad & M. Perugini<br />
(Eds.), <strong>Big</strong> <strong>Five</strong> assessment (pp. 171–194). Göttingen, Germany:<br />
Hogrefe & Huber.<br />
Paunonen, S. V., Ashton, M. C., & Jackson, D. N. (2001). Nonverbal<br />
assessment <strong>of</strong> the <strong>Big</strong> <strong>Five</strong> personality factors. European Journal <strong>of</strong><br />
<strong>Personality</strong>, 15, 3–18.<br />
Paunonen, S. V., & Jackson, D. N. (1979). Nonverbal trait inference.<br />
Journal <strong>of</strong> <strong>Personality</strong> <strong>and</strong> Social Psychology, 37, 1645–1659.<br />
Paunonen, S. V., & Jackson, D. N. (1985). Idiographic measurement<br />
strategies for personality <strong>and</strong> prediction: Some unredeemed promissory<br />
notes. Psychological Review, 92, 486–511.<br />
Paunonen, S. V., & Jackson, D. N. (2000). What is beyond the <strong>Big</strong> <strong>Five</strong>?<br />
Plenty! Journal <strong>of</strong> <strong>Personality</strong>, 68, 821–835.<br />
Paunonen, S. V., Jackson, D. N., & Keinonen, M. (1990). The structured<br />
nonverbal assessment <strong>of</strong> personality. Journal <strong>of</strong> <strong>Personality</strong>, 58, 481–502.<br />
Paunonen, S. V., Jackson, D. N., Trzebinski, J., & Forsterling, F. (1992).<br />
<strong>Personality</strong> structure across cultures: A multimethod evaluation. Journal<br />
<strong>of</strong> <strong>Personality</strong> <strong>and</strong> Social Psychology, 62, 447–456.<br />
Paunonen, S. V., Keinonen, M., Trzebinski, J., Forsterling, F., Grishenko-<br />
Roze, N., Kouznetsova, L., & Chan, D. W. (1996). The structure <strong>of</strong><br />
personality in six cultures. Journal <strong>of</strong> Cross-Cultural Psychology, 27,<br />
339–353.<br />
Paunonen, S. V., & Nicol, A. A. M. (2001). The personality hierarchy <strong>and</strong><br />
the prediction <strong>of</strong> work behaviors. In R. Hogan & B. W. Roberts (Eds.),<br />
<strong>Personality</strong> psychology in the workplace (pp. 161–191). Washington,<br />
DC: American Psychological Association.<br />
Paunonen, S. V., Rothstein, M. G., & Jackson, D. N. (1999). Narrow<br />
reasoning about the use <strong>of</strong> broad personality measures in personnel<br />
selection. Journal <strong>of</strong> Organizational <strong>Behavior</strong>, 20, 389–405.<br />
Paunonen, S. V., Zeidner, M., Engvik, H., Oosterveld, P., & Maliphant, R.<br />
(2000). The nonverbal assessment <strong>of</strong> personality in five cultures. Journal<br />
<strong>of</strong> Cross-Cultural Psychology, 31, 220–239.<br />
Rothstein, M. G., Paunonen, S. V., Rush, J. C., & King, G. A. (1994).<br />
<strong>Personality</strong> <strong>and</strong> cognitive ability predictors <strong>of</strong> performance in graduate<br />
business school. Journal <strong>of</strong> Educational Psychology, 86, 516–530.<br />
Saucier, G., & Goldberg, L. R. (1998). What is beyond the <strong>Big</strong> <strong>Five</strong>?<br />
Journal <strong>of</strong> <strong>Personality</strong>, 66, 495–524.<br />
Tett, R. P., Jackson, D. N., & Rothstein, M. G. (1991). <strong>Personality</strong><br />
measures as predictors <strong>of</strong> job performance: A meta-analytic review.<br />
Personnel Psychology, 44, 703–742.<br />
Appendix<br />
<strong>Behavior</strong> Report Form<br />
INSTRUCTIONS<br />
Please describe yourself by answering all <strong>of</strong> the questions in this booklet.<br />
Be as accurate as possible in describing you, <strong>and</strong> try not to omit any item.<br />
First, please indicate the following about you.<br />
Your Name:<br />
Your Student No.:<br />
Your Sex: (1) M or (2) F<br />
Your Age: (years)<br />
Your Height: (in.) or (cm.)<br />
Your Weight: (lbs.) or (kg.)<br />
Your H<strong>and</strong> Preference: (1) Right or (2) Left<br />
Your Year <strong>of</strong> Study:<br />
Please answer the following six questions by circling a number on each <strong>of</strong> the corresponding 9-point rating scales.<br />
1. How would you rate your level <strong>of</strong> physical attractiveness compared to the average student?<br />
Circle a number on the following scale:<br />
UNATTRACTIVE AVERAGE ATTRACTIVE<br />
1 2 3 4 5 6 7 8 9<br />
Extremely Very Moderately Somewhat Somewhat Moderately Very Extremely
BIG FIVE PREDICTORS<br />
423<br />
2. How would you rate your level <strong>of</strong> general intelligence compared to the average student?<br />
Circle a number on the following scale:<br />
UNINTELLIGENT AVERAGE INTELLIGENT<br />
1 2 3 4 5 6 7 8 9<br />
Extremely Very Moderately Somewhat Somewhat Moderately Very Extremely<br />
3. In relation to people you know, how would you describe your popularity among your peers?<br />
UNPOPULAR AVERAGE POPULAR<br />
1 2 3 4 5 6 7 8 9<br />
Extremely Very Moderately Somewhat Somewhat Moderately Very Extremely<br />
4. In relation to other people <strong>of</strong> your sex, how masculine/feminine are you?<br />
MASCULINE<br />
AVERAGE<br />
FEMININE<br />
FOR MY SEX<br />
1 2 3 4 5 6 7 8 9<br />
Extremely Very Moderately Somewhat Somewhat Moderately Very Extremely<br />
5. Would you consider yourself a religious person who, for example, might be interested in attending (or already does<br />
attend) formal religious services?<br />
NONRELIGIOUS AVERAGE RELIGIOUS<br />
1 2 3 4 5 6 7 8 9<br />
Extremely Very Moderately Somewhat Somewhat Moderately Very Extremely<br />
6. How would you describe your honesty compared to that <strong>of</strong> your friends?<br />
DISHONEST AVERAGE HONEST<br />
1 2 3 4 5 6 7 8 9<br />
Extremely Very Moderately Somewhat Somewhat Moderately Very Extremely<br />
7. Indicate your overall average grade for last year. % (percent)<br />
8. Estimate the average number <strong>of</strong> dates per month that you have had over the past year with someone <strong>of</strong> the opposite<br />
sex? (per month)<br />
How many different people did you date over the course <strong>of</strong> the past year?<br />
9. Do you consider yourself a nonsmoker, infrequent smoker, light smoker, moderate smoker, or heavy smoker? Circle<br />
a number below.<br />
1 2 3 4 5<br />
Infrequent Light Moderate<br />
Smoker Smoker Smoker<br />
Non-<br />
Smoker<br />
Heavy<br />
Smoker<br />
If you smoke, how many cigarettes do you smoke a day on average?<br />
(per day)<br />
10. Do you consider yourself a nondrinker, infrequent drinker, light drinker, moderate drinker, or heavy drinker <strong>of</strong><br />
alcohol? Circle a number below.<br />
1 2 3 4 5<br />
Infrequent Light Moderate<br />
Drinker Drinker Drinker<br />
Non-<br />
Drinker<br />
If you drink, how many drinks do you consume a week on average?<br />
(one drink 1 ounce spirits 1 glass wine 1 bottle beer) (drinks per wk.)<br />
Heavy<br />
Drinker<br />
11. If you had to choose one program <strong>of</strong> study (or, if you have already chosen one), which <strong>of</strong> the two below would<br />
you (did you) choose? Check one.<br />
(1) Liberal Arts (Arts, Fine Arts, Humanities, etc.)<br />
(2) Non-Liberal Arts (Natural Sciences, Social Sciences, Pr<strong>of</strong>essional Schools, etc.)<br />
(Appendix continues)
424 PAUNONEN<br />
12. Are you currently a fraternity/sorority member or pledge? Check one.<br />
(1) no (2) yes<br />
If you are not currently a fraternity/sorority member or pledge, how much interest would you have in joining a<br />
fraternity/sorority?<br />
UNINTERESTED NEUTRAL INTERESTED<br />
1 2 3 4 5 6 7 8 9<br />
Extremely Very Moderately Somewhat Somewhat Moderately Very Extremely<br />
13. How long have you had a driver’s license? Put 0 if never. (years)<br />
If you have a driver’s license:<br />
How many speeding tickets have you had in the past?<br />
How many parking tickets?<br />
How many other traffic violations?<br />
What is the fastest you have driven? (m.p.h.) or (k.p.h.)<br />
14. Indicate your graduating average grade from high school. % (percent)<br />
15. On average, how much money do you spend monthly buying lottery tickets?<br />
($ per month)<br />
16. Estimate the average number <strong>of</strong> parties per month that you attend. (per month)<br />
17. Have you ever been on a long-term diet (i.e., one month or more)? Check one.<br />
(1) no (2) yes<br />
18. Do you regularly take any prescription medications for the following ailments? Check each item.<br />
asthma: (1) no (2) yes<br />
allergies: (1) no (2) yes<br />
diabetes: (1) no (2) yes<br />
depression: (1) no (2) yes<br />
other: (1) no (2) yes<br />
19. How would you describe your uncorrected eyesight? Check one.<br />
(1) normal vision<br />
(2) nearsighted<br />
(3) farsighted<br />
(4) nearsighted in one eye, farsighted in the other<br />
Do you wear vision-correcting prescription lenses? Check both items.<br />
glasses: (1) no (2) yes<br />
contacts: (1) no (2) yes<br />
20. Do you currently hold a part-time job? Check one.<br />
(1) no (2) yes<br />
If yes, how many hours do you work in the average week?<br />
(hrs. per week)<br />
21. Do you: play any musical instrument(s)? (1) no (2) yes<br />
play any organized sport(s)? (1) no (2) yes<br />
exercise regularly (aerobics, weights, running, etc.)? (1) no (2) yes<br />
donate blood occasionally? (1) no (2) yes<br />
Note. From “Hierarchical organization <strong>of</strong> personality <strong>and</strong> prediction <strong>of</strong> behavior,” by S. V. Paunonen, 1998, Journal <strong>of</strong><br />
<strong>Personality</strong> <strong>and</strong> Social Psychology, 74, 538–556. Copyright 1998 by the American Psychological Association.<br />
Received June 19, 2001<br />
Revision received June 21, 2002<br />
Accepted July 2, 2002


