Description and assessment of the OSTIA reanalysis. - Met Office
Description and assessment of the OSTIA reanalysis. - Met Office
Description and assessment of the OSTIA reanalysis. - Met Office

Create successful ePaper yourself
Turn your PDF publications into a flip-book with our unique Google optimized e-Paper software.
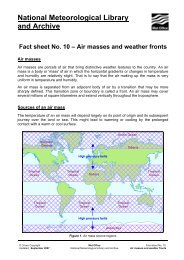
(a) June 1989 (b) December 1989<br />
Figure 3.2: Number <strong>of</strong> AVHRR Pathfinder observations in <strong>OSTIA</strong> for each 1/4 o grid box over 1<br />
month, quality flags 4 to 7 (where 7 is highest quality). Spurious observations over sea ice regions<br />
are seen in all summer months <strong>of</strong> <strong>the</strong> Pathfinder dataset (e.g. (a) June image) but this is not an<br />
issue at o<strong>the</strong>r times <strong>of</strong> <strong>the</strong> year (e.g. (b) December image).<br />
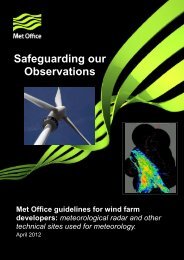
(a) No ice mask<br />
(b) Observations under ice masked out<br />
Figure 3.3: Sea ice concentration <strong>and</strong> -1.7 o C SST contour for 21 June 1989, without masking <strong>of</strong> SST<br />
observations under ice (a) <strong>and</strong> with mask (b). Use <strong>of</strong> mask greatly improves consistency between<br />
SST <strong>and</strong> sea ice concentration. -1.7 o C contour used to indicate freezing temperatures ra<strong>the</strong>r than<br />
-1.8 o C as relaxation to -1.8 o C (section 3.3) means SST never reaches this value. -1.7 o C contour<br />
encompasses all values close to or below freezing <strong>and</strong> <strong>the</strong>refore regions which should be under<br />
sea ice.<br />
© c Crown Copyright 2011 27