Description and assessment of the OSTIA reanalysis. - Met Office
Description and assessment of the OSTIA reanalysis. - Met Office
Description and assessment of the OSTIA reanalysis. - Met Office

You also want an ePaper? Increase the reach of your titles
YUMPU automatically turns print PDFs into web optimized ePapers that Google loves.
A background <strong>of</strong> <strong>the</strong> previous day’s bias field, scaled by 0.9, is used toge<strong>the</strong>r with a longer correlation<br />
length scale <strong>of</strong> 700km. This bias field is <strong>the</strong>n interpolated to <strong>the</strong> satellite observation locations<br />
<strong>and</strong> <strong>the</strong> bias value is removed from <strong>the</strong> measurements prior to assimilation.<br />
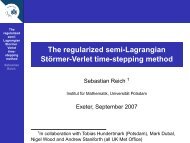
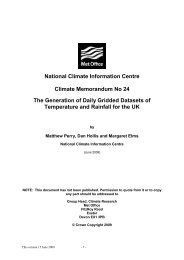
(a) AATSR observations<br />
(b) AVHRR observations<br />
(c) All in-situ observations<br />
Figure 3.4: Global observation minus background RMS (red) <strong>and</strong> Mean (black) statistics for preliminary<br />
run <strong>of</strong> <strong>the</strong> <strong>OSTIA</strong> <strong>reanalysis</strong><br />
The decision not to use ATSR-1 data as a reference data set was taken following results from<br />
a preliminary version <strong>of</strong> <strong>the</strong> <strong>reanalysis</strong> in which all (A)ATSR missions were used as reference.<br />
Figure 3.4 shows <strong>the</strong> observation minus background statistics for (A)ATSR, AVHRR Pathfinder <strong>and</strong><br />
in-situ observation (see section 4.1 for description <strong>of</strong> how <strong>the</strong> statistics where calculated) for <strong>the</strong><br />
preliminary version <strong>of</strong> <strong>the</strong> <strong>reanalysis</strong> for <strong>the</strong> full <strong>reanalysis</strong> time period. It is evident that <strong>the</strong> use <strong>of</strong><br />
<strong>the</strong> ATSR-1 data as a reference data set in <strong>the</strong> bias correction has had a detrimental impact on both<br />
<strong>the</strong> mean <strong>and</strong> <strong>the</strong> RMS <strong>of</strong> <strong>the</strong> observation minus background values for both <strong>the</strong> in-situ <strong>and</strong> AVHRR<br />
Pathfinder observations. This is clearly seen in <strong>the</strong> disruption to <strong>the</strong> seasonal cycle in both. The<br />
statistics recover towards <strong>the</strong> end <strong>of</strong> <strong>the</strong> ATSR-1 period <strong>and</strong> once <strong>the</strong> ATSR-2 data comes online in<br />
June 1995.<br />
Figure 3.5 is <strong>the</strong> similar to figure 3.4 but for 1990-1992 only. On <strong>the</strong> left are statistics from <strong>the</strong><br />
© c Crown Copyright 2011 29