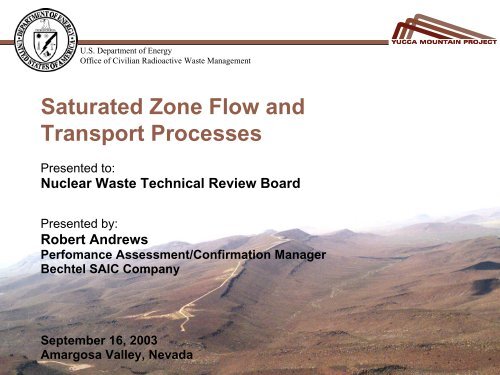
Robert Andrews - US Nuclear Waste Technical Review Board
Robert Andrews - US Nuclear Waste Technical Review Board
Robert Andrews - US Nuclear Waste Technical Review Board

You also want an ePaper? Increase the reach of your titles
YUMPU automatically turns print PDFs into web optimized ePapers that Google loves.
U.S. Department of Energy<br />
Office of Civilian Radioactive <strong>Waste</strong> Management<br />
Saturated Zone Flow and<br />
Transport Processes<br />
Presented to:<br />
<strong>Nuclear</strong> <strong>Waste</strong> <strong>Technical</strong> <strong>Review</strong> <strong>Board</strong><br />
Presented by:<br />
<strong>Robert</strong> <strong>Andrews</strong><br />
Perfomance Assessment/Confirmation Manager<br />
Bechtel SAIC Company<br />
September 16, 2003<br />
Amargosa Valley, Nevada
Outline<br />
• Introduction - Objectives<br />
• Regional Ground-water Flow Processes<br />
• Regional Hydrochemistry<br />
• Site Scale Ground-Water Flow Processes<br />
• Site-Scale Radionuclide Transport Processes<br />
• Results of Radionuclide Transport Model<br />
• Comparison to Alternative Model<br />
• Summary and Conclusions<br />
00414PR_SZ_NRC_<strong>Andrews</strong>.ppt 2
Components Affecting <strong>Technical</strong> Basis of<br />
Post-Closure Safety Analysis<br />
• Saturated zone flow<br />
and transport is one<br />
of 14 components of<br />
post closure safety<br />
• Saturated zone<br />
provides pathways for<br />
potential release of<br />
radionuclides to<br />
reasonably maximally<br />
exposed individual<br />
• Saturated zone affects<br />
performance in both<br />
nominal scenario<br />
class and disruptive<br />
event scenario<br />
classes initiated by<br />
seismic and volcanic<br />
events<br />
00414PR_SZ_NRC_<strong>Andrews</strong>.ppt 3
Introduction<br />
• Saturated zone flow defines the flow paths and flow rates of<br />
ground-water from where radionuclides are potentially<br />
released from unsaturated zone to where they are used by<br />
hypothetical person (the reasonably maximally exposed<br />
individual of 40 CFR Part 197 and 10 CFR Part 63)<br />
• Saturated zone transport defines the advective-dispersive<br />
transport velocities of any radionuclides potentially released<br />
from the unsaturated zone and their transport times, including<br />
the effects of matrix diffusion and retardation, along the paths<br />
of likely ground-water flow<br />
• Performance measure of interest is mass (or activity) flux at<br />
point of compliance (about 18 km south of Yucca Mountain)<br />
• The bases for quantifying the above processes relies on sitespecific<br />
hydrogeologic, geochemical and transport testing<br />
conducted by numerous scientists over the last 20+ years<br />
00414PR_SZ_NRC_<strong>Andrews</strong>.ppt 4
Introduction –<br />
Performance Assessment Use of Saturated Zone Flow<br />
and Transport Analyses<br />
Groundwater Flow Paths<br />
from Yucca Mountain<br />
Advective Dispersive Mass<br />
Breakthrough Curves to<br />
Compliance Boundary<br />
00414PR_SZ_NRC_<strong>Andrews</strong>.ppt 5
Key Documents Describing <strong>Technical</strong> Basis<br />
D’Agnese, F.A., O’Brien, G.M., Faunt, C.C., Belcher, W.R., and SanJuan, C., 2002. A Three-<br />
Dimensional Numerical Model of Predevelopment Conditions in the Death Valley Regional<br />
Ground-Water Flow System, Nevada and California. Water-Resources Investigations Report<br />
02-4102.<br />
<strong>US</strong>GS, 2001. Water-Level Data Analysis for the Saturated Zone Site-Scale Flow and<br />
Transport Model. ANL-NBS-HS-000034, Rev 00, ICN 01.<br />
Hevesi, J.A., Flint, A.L., and Flint L.E., 2002. Preliminary Estimates of Spatially Distributed<br />
Net Infiltration and Recharge for the Death Valley Region, Nevada-California. Water-<br />
Resources Investigation Report 02-4010.<br />
Analyses and Model Reports (in development):<br />
Saturated Zone In-situ Testing (Reimus, P. and M.J. Umari)<br />
Geochemical and Isotopic Constraints on Groundwater Flow Directions and Magnitudes,<br />
Mixing and Recharge at Yucca Mountain (Kwickles, E. and R. Robeck)<br />
Site-Scale Saturated Zone Flow Model (Eddebbarh, A.A. and Zyvoloski, G.)<br />
Site-Scale Saturated Zone Transport Model (Kelkar, S. and Robinson, B.)<br />
Saturated Zone Colloid Transport Model (Viswanathan, H.)<br />
Saturated Zone Flow and Transport Abstractions (Arnold, B.W. and Kuzio, S.)<br />
00414PR_SZ_NRC_<strong>Andrews</strong>.ppt 6
Conceptual Framework for Saturated Zone<br />
Flow and Transport Processes<br />
• Radionuclides<br />
potentially released<br />
from unsaturated zone<br />
are transported<br />
through saturated<br />
zone to point of<br />
compliance<br />
• Flow paths determine<br />
the geologic units<br />
likely to be contacted<br />
by radionuclidebearing<br />
groundwater<br />
• Portion of flow and<br />
transport in fractured<br />
tuff and portion in<br />
porous alluvium<br />
00414PR_SZ_NRC_<strong>Andrews</strong>.ppt 7
Regional Hydrogeology<br />
• Regional groundwater flow system investigated by <strong>US</strong>GS<br />
and other scientists for 20+ years<br />
• Regional groundwater flow characterized by<br />
representations of<br />
– relevant physiographic features,<br />
– recharge/discharge locations/amounts,<br />
– regional geology,<br />
– regional potentiometric surfaces and<br />
– regional geochemistry<br />
• Result of regional characterization indicates general<br />
groundwater flow paths and flow rates in vicinity of<br />
Yucca Mountain<br />
00414PR_SZ_NRC_<strong>Andrews</strong>.ppt 8
Major Physiographic<br />
Features of<br />
Death Valley Regional<br />
Flow System<br />
• Death valley region<br />
encompasses about 70,000 km 2<br />
• Major features include Spring<br />
Mountains, Death Valley, and<br />
Amargosa Valley<br />
• Region is an enclosed<br />
hydrologic basin<br />
• Different boundaries used for<br />
different regional modeling<br />
studies<br />
00414PR_SZ_NRC_<strong>Andrews</strong>.ppt 9
Major Recharge<br />
within Death<br />
Valley Regional<br />
Flow System<br />
• Recharge generally occurs at<br />
topograpphic elevations<br />
greater than 1500 m asl<br />
• Recharge a function of<br />
precipitation, slope, geology,<br />
and vegetation<br />
• Uncertainty in recharge<br />
depending on estimation<br />
method<br />
00414PR_SZ_NRC_<strong>Andrews</strong>.ppt 10
Cumulative Recharge Estimates in Death<br />
Valley Regional Flow System<br />
Precipitation<br />
Model<br />
1980 to 1995<br />
Modeled<br />
Precipitation<br />
1920 to 1993<br />
Cokriged<br />
Precipitation<br />
Model Type<br />
Average Value for<br />
Area of Death Valley<br />
Groundwater Flow<br />
Model (mm/yr)<br />
Total Area<br />
Volume<br />
(million m 3 /yr)<br />
Net Infiltration<br />
or Recharge as<br />
a Percentage of<br />
Precipitation<br />
202 7,980 ⎯<br />
Model net infiltration 7.8 310 3.9<br />
Model net infiltration<br />
of areas with<br />
>200 mm/yr<br />
precipitation<br />
Modified Maxey-<br />
Eakin estimated<br />
recharge<br />
Modified Maxey-<br />
Eakin of areas with<br />
>200 mm/yr<br />
precipitation<br />
Original Maxey-<br />
Eakin estimated<br />
recharge<br />
Modified Maxey-<br />
Eakin estimated<br />
recharge<br />
Original Maxey-<br />
Eakin estimated<br />
recharge<br />
4.8 190 6.2<br />
6.3 250 3.1<br />
2.6 110 5.1<br />
4.8 190 2.4<br />
188 7,430 ⎯<br />
5.1 200 2.7<br />
3.7 150 2.0<br />
Source: Based on Hevesi et al. 2002 , Table 2).<br />
NOTE: Volumetric flows rounded to the nearest 10 million m 3 /yr.<br />
00414PR_SZ_NRC_<strong>Andrews</strong>.ppt 11
Time Out for a Comparison of Commonly<br />
Used Volumetric Flow Units<br />
• One million gallons per day = 1,100 Acre-foot per year<br />
• One million gallons per day = 1.4 million m 3 /yr<br />
• One acre-foot per year = 1250 m 3 /yr<br />
• One acre-inch = 27,000 gallons<br />
• Average water consumption in Las Vegas is about 20,000<br />
gallons per month per household or about 1000 m 3 /yr (a<br />
little less than one acre-foot/year)<br />
• 3,000 acre-feet/year (3.7 million m 3 /yr) is the annual water<br />
demand by the reasonably maximally exposed individual<br />
specified in 10 CFR 63.312<br />
00414PR_SZ_NRC_<strong>Andrews</strong>.ppt 12
Discharge Locations<br />
in Death Valley<br />
Regional Flow<br />
System<br />
• Natural groundwater<br />
discharge occurs at<br />
topographic lows<br />
• Significant discharge<br />
occurs from carbonate<br />
springs and<br />
evapotranspiration from<br />
shallow groundwater at<br />
playas<br />
00414PR_SZ_NRC_<strong>Andrews</strong>.ppt 13
Cumulative Regional Discharge Estimates in<br />
Death Valley Regional Flow System<br />
DISCHARGE REGION<br />
ESTIMATED DISCHARGE<br />
(thousand m 3 /day)<br />
ESTIMATED DISCHARGE<br />
(million m 3 /yr)<br />
Death Valley 92 32<br />
Ash Meadows 61 22<br />
Sarcobatus Flat 44 16<br />
Pahrump/Stewart Valley 26 10<br />
Tecopa Basin 21 8<br />
Oasis Valley 20 7<br />
Penoyer Valley 13 5<br />
Shoshone Basin 7 2<br />
Franklin Lake 3 1<br />
Others 8 3<br />
TOTAL 295 106<br />
Source: Modified from D/Agnese et al., 2002<br />
Regional recharge and discharge estimates agree within a<br />
factor of 1 to 3<br />
00414PR_SZ_NRC_<strong>Andrews</strong>.ppt 14
Groundwater<br />
Withdrawals in the<br />
Death Valley Regional<br />
Flow System<br />
• Groundwater used for irrigation,<br />
mining and domestic purposes<br />
• Values presented are<br />
cumulative estimates over 12<br />
years (1987 to 1998)<br />
• To convert 12-yr cumulative<br />
withdrawals to average annual<br />
withdrawal in m3/yr multiply<br />
by 100<br />
• NOTE - Subbasin boundary is<br />
different from regional flow<br />
system boundary<br />
00414PR_SZ_NRC_<strong>Andrews</strong>.ppt 15
Annual Groundwater Withdrawals in the<br />
Amargosa Valley Area<br />
Acre-feet<br />
16,000<br />
14,000<br />
12,000<br />
10,000<br />
8,000<br />
6,000<br />
4,000<br />
2,000<br />
0<br />
1985<br />
1987<br />
1989<br />
1991<br />
1993<br />
Year<br />
Irrigation<br />
Total<br />
Annual water withdrawals in Amargosa Desert hydrologic basin (#230).<br />
Sources: 1985−1997: Thiel Engineering Consultants 1999<br />
1998−2000: Fenelon and Moreo, 2002 (Data on irrigation<br />
withdrawals not available for 1999−2000).<br />
1995<br />
1997<br />
1999<br />
• Irrigation water use<br />
comprises ~ 75% of total<br />
water use in Amargosa<br />
Valley<br />
• About 2000 acres are<br />
commercially farmed in<br />
Amargosa Valley (more<br />
than 90% in alfalfa or<br />
other hay)<br />
• Average water use is<br />
about 5 to 6 acre-ft per<br />
acre of alfalfa<br />
00414PR_SZ_NRC_<strong>Andrews</strong>.ppt 16
Potentiometric<br />
Surface of Death<br />
Valley Regional<br />
Flow System<br />
• Potentiometric contours<br />
indicate significant recharge<br />
in Spring Mountains,<br />
Amargosa Range and Rainier<br />
Mesa<br />
• Significant discharge in Death<br />
Valley<br />
• Although this surface is<br />
indicative of regional trends,<br />
local anomalies exist<br />
• NOTE: Regional flow system<br />
boundary is based on 1997<br />
version<br />
00414PR_SZ_NRC_<strong>Andrews</strong>.ppt 17
General Inferred Flow<br />
Directions in Death<br />
Valley Regional<br />
Flow System –<br />
Central Death Valley Subregion<br />
• General flow direction is<br />
southerly from recharge areas in<br />
north to discharge areas in south<br />
• In vicinity of Yucca Mountain<br />
apparent flow direction is<br />
southerly<br />
• Southwesterly flow inferred from<br />
Specter Range to Death Valley<br />
00414PR_SZ_NRC_<strong>Andrews</strong>.ppt 18
Geochemistry<br />
Signatures and Inferred<br />
Flow Directions and<br />
Mixing in Death Valley<br />
Regional Flow System<br />
• Dissolved constituents<br />
(chloride, sulfate, deltadeuterium,<br />
etc) indicative of<br />
common trends<br />
• Water types are grouped by<br />
similar geochemical<br />
signatures along flow paths<br />
• Mixing zones indicate areas<br />
where distinct waters mix in<br />
larger flow system<br />
00414PR_SZ_NRC_<strong>Andrews</strong>.ppt 19
Geochemical Signatures and Inferred<br />
Groundwater Flow Paths – Chloride example<br />
• Chloride concentration<br />
generally increases<br />
along flow path due to<br />
water-rock interactions<br />
• Path 9 represents deep<br />
underflow in carbonate<br />
aquifer<br />
• Geochemistry in<br />
vicinity of Yucca<br />
Mountain indicates<br />
generally a southerly<br />
flow with eastern<br />
component across<br />
Solitario Canyon fault<br />
(Path 7)<br />
00414PR_SZ_NRC_<strong>Andrews</strong>.ppt 20
Regional Variation<br />
in Uranium<br />
and Uranium<br />
Isotope Ratios<br />
• Generally uranium<br />
concentrations increase in<br />
the direction of<br />
groundwater flow<br />
• Generally uranium<br />
234 U/ 238 U isotope ratios are<br />
greatest in areas<br />
recharged beneath thick<br />
unsaturated sections and<br />
decrease along the flow<br />
path<br />
• These data are indicative<br />
of a generally southerly<br />
groundwater flow direction<br />
00414PR_SZ_NRC_<strong>Andrews</strong>.ppt 21
Groundwater Flow<br />
Model of the Death<br />
Valley Regional<br />
Flow System<br />
• Regional model developed by<br />
<strong>US</strong>GS was updated in<br />
D’Agnese et al., 2002<br />
• Updated model included<br />
refined hydrogeologic<br />
framework model and revised<br />
recharge and discharge<br />
estimates<br />
• Hydraulic head residuals<br />
indicate reasonable agreement<br />
in vicinity of Yucca Mountain<br />
• Largest difference are in areas<br />
of steeper hydraulic gradients<br />
or areas with limited<br />
observations<br />
00414PR_SZ_NRC_<strong>Andrews</strong>.ppt 22
Comparison of Inferred and<br />
Simulated Groundwater Discharge<br />
in Regional Flow Model<br />
• Regional discharge<br />
estimates compare<br />
well to regional model<br />
predictions<br />
• Comparison of<br />
regional recharge and<br />
discharge helps<br />
constrain the water<br />
budget in the Death<br />
Valley region<br />
00414PR_SZ_NRC_<strong>Andrews</strong>.ppt 23
Site-Scale Groundwater Flow Model<br />
• Regional model allows definition of general flow<br />
directions and provides contraints on volumetric flow<br />
rates through aquifers<br />
• Site-scale model provides greater detail of flow directions<br />
and flow rates through different hydrogeologic units of<br />
relevance to repository performance<br />
• Site-scale model builds on observations of hydraulic<br />
heads and permeability in DOE and Nye County boreholes<br />
and discrete large scale aquifer tests conducted in the<br />
C-wells complex and the Alluvial Testing Complex<br />
00414PR_SZ_NRC_<strong>Andrews</strong>.ppt 24
Boreholes used<br />
in the Development<br />
of the Site-Scale<br />
Groundwater<br />
Flow Model<br />
• DOE and Nye County<br />
boreholes used to develop<br />
parameters and measure<br />
hydraulic head<br />
• Borehole coverage<br />
significantly expanded by<br />
Nye County-DOE<br />
cooperative drilling<br />
program (especially in<br />
alluvium and in vicinity of<br />
alluvium-tuff contact)<br />
00414PR_SZ_NRC_<strong>Andrews</strong>.ppt 25
Site-Scale<br />
Geologic<br />
Representation –<br />
Geologic Unit<br />
Outcrops<br />
• Geology in saturated<br />
zone consists of<br />
continuation of strata<br />
identified in<br />
unsaturated zone<br />
• Lateral continuity of<br />
tuff aquifers is limited<br />
due to offset along<br />
N-S trending faults<br />
00414PR_SZ_NRC_<strong>Andrews</strong>.ppt 26
Site Scale Geologic Representation –<br />
Hydrogeologic Cross Sections<br />
• 20 discrete<br />
layers used to<br />
define hydrostratigraphy<br />
of<br />
the site scale<br />
groundwater<br />
flow model<br />
• Total vertical<br />
extent about<br />
3000 meters<br />
00414PR_SZ_NRC_<strong>Andrews</strong>.ppt 27
Extent of Alluvium<br />
Identified in Nye County<br />
Boreholes<br />
• Nye County boreholes drilled along<br />
U.S. 95 and northward toward Yucca<br />
Mountain<br />
• Nye County borehole<br />
information available<br />
on their web site -<br />
www.nyecounty.gov<br />
00414PR_SZ_NRC_<strong>Andrews</strong>.ppt 28
Extent of Alluvium Identified in Nye County<br />
Boreholes and Geophysics<br />
• Alluvium thickness<br />
varies over the site<br />
• Generally alluvium<br />
is thickest under<br />
Fortymile Wash<br />
(about 800 ft) and<br />
southward towards<br />
Amargosa Valley<br />
• This information<br />
used to constrain<br />
location of tuffalluvium<br />
contact<br />
00414PR_SZ_NRC_<strong>Andrews</strong>.ppt 29
Site-Scale<br />
Potentiometric Surface<br />
• Representation considers<br />
heads at <strong>US</strong>W G-2 and UE-25<br />
WT#6 to be locally perched<br />
• Assuming isotropic<br />
permeability, this potential<br />
surface indicates generally<br />
southeasterly flow from Yucca<br />
Mountain and then southerly<br />
flow under Fortymile Wash<br />
00414PR_SZ_NRC_<strong>Andrews</strong>.ppt 30
Site Scale Boundary Fluxes Compared to<br />
Regional Model Fluxes<br />
Boundary Regional Model Site-Scale Model (million m 3 /yr)<br />
North -6.1 -5.4<br />
East - 17.7 - 16.4<br />
West -3.7 -0.1<br />
South 28.9 22.8<br />
NOTE: Negative values represent lateral inflow, positive values represent outflow.<br />
Regional model provides pre calibration targets for site scale results.<br />
00414PR_SZ_NRC_<strong>Andrews</strong>.ppt 31
Location of<br />
C-Wells and<br />
Alluvial Testing<br />
Complexes<br />
• Detailed hydrogeologic<br />
and tracer tests<br />
conducted in tuff<br />
aquifers at C-wells and in<br />
alluvial aquifer at ATC<br />
• Spacing of wells (tens of<br />
meters) determined from<br />
desire to develop flow<br />
recirculation cells for<br />
tracer tests<br />
• Long duration pump test<br />
at C-wells stressed wells<br />
several kilometers away<br />
00414PR_SZ_NRC_<strong>Andrews</strong>.ppt 32
C-Wells Stratigraphy<br />
and Hydraulic<br />
Characteristics<br />
• Fluid logging indicated<br />
that only small portion of<br />
borehole was providing<br />
most of flow (with<br />
spacing of several ten’s<br />
of meters)<br />
• Tracer tests conducted in<br />
both Prow Pass and<br />
Bullfrog units<br />
NOTE: Well logs represent matrix porosity (left)<br />
and fracture spacing (fractures/m) (right)<br />
00414PR_SZ_NRC_<strong>Andrews</strong>.ppt 33
C-Wells Long Term Pump Test<br />
30,000 minutes = 21 days<br />
463,000 minutes = 321 days<br />
• C-wells pumped at ~ 800<br />
m 3 /day from May 1996<br />
to November 1997 (total<br />
0.44 million m 3 )<br />
• Drawdowns observed<br />
over 2 km away<br />
• Drawdowns interpreted<br />
to develop large scale<br />
estimates of<br />
transmissivity and<br />
anisotropy<br />
00414PR_SZ_NRC_<strong>Andrews</strong>.ppt 34
Site Scale Modeled and Observed<br />
Potentiometric Surfaces<br />
• Observed (left) and predicted (right) heads agree with greatest<br />
differences in areas of steep hydraulic gradients<br />
00414PR_SZ_NRC_<strong>Andrews</strong>.ppt 35
Site-Scale Modeled and Observed<br />
Permeability Values<br />
• Generally cross<br />
holes tests<br />
intersect larger<br />
rock mass and are<br />
more indicative of<br />
in situ conditions<br />
• Single cross hole<br />
test in Tram Tuff is<br />
believed more<br />
indicative of fault<br />
near test<br />
• Reasonable match<br />
achieved<br />
00414PR_SZ_NRC_<strong>Andrews</strong>.ppt 36
Calculated<br />
Site Scale<br />
Groundwater<br />
Flow Paths<br />
• Nominal flow path trajectory<br />
is generally southeasterly<br />
from Yucca Mountain<br />
• Flow beneath Fortymile<br />
Wash is southsouthwesterly<br />
• Uncertainty in flow paths<br />
due to anisotropy and<br />
uncertainty in boundary<br />
conditions<br />
• Flow rates of about 0.7 m/yr<br />
under Yucca Mountain<br />
increasing to about 2.3 m/yr<br />
at 18 km<br />
00414PR_SZ_NRC_<strong>Andrews</strong>.ppt 37
Comparison of<br />
Calculated Flow<br />
Paths with<br />
Geochemistry<br />
Inferred Flow Paths<br />
• Calculated flow paths<br />
follow geochemically<br />
inferred paths 2 and 7<br />
– southeasterly flow to<br />
axis of Fortymile Wash<br />
and then along axis of<br />
Fortymile Wash<br />
00414PR_SZ_NRC_<strong>Andrews</strong>.ppt 38
UTM Northing (m)<br />
4090000<br />
4085000<br />
4080000<br />
4075000<br />
4070000<br />
4065000<br />
4060000<br />
4055000<br />
4050000<br />
Uncertainty in Flow<br />
Paths Lengths<br />
in Alluvium<br />
• Uncertainty in flow path a<br />
function of uncertainty in<br />
anisotropy in tuff aquifers<br />
– green: 0.05<br />
– blue: 1.0<br />
– red: 20<br />
• Uncertainty in alluvium<br />
contact indicated by<br />
dashed lines<br />
• Flow path length in<br />
alluvium to point of<br />
compliance ranges from<br />
1 to 10 km<br />
535000 540000 545000 550000 555000 560000<br />
UTM Easting (m)<br />
00414PR_SZ_NRC_<strong>Andrews</strong>.ppt 39
Radionuclide Transport Processes<br />
• Transport processes<br />
include advection,<br />
dispersion, matrix<br />
diffusion and<br />
retardation<br />
• Advection occurs<br />
primarily through<br />
fractures in tuff<br />
aquifers and through<br />
matrix in alluvial<br />
aquifer<br />
• Transport<br />
characteristics differ<br />
between tuff and<br />
alluvium<br />
00414PR_SZ_NRC_<strong>Andrews</strong>.ppt 40
Site Scale Radionuclide Transport<br />
• Groundwater flow models provide projections of flow<br />
paths and flow rates<br />
• Transport model provide projections of flow velocities<br />
and radionuclide transport times between the point<br />
radionuclides enter the saturated zone to the point they<br />
are withdrawn from the well used by the hypothetical<br />
person<br />
• Although transport model also project the spatial<br />
variation in concentration along the flow path, this<br />
information is not used due to the conservative<br />
assumption that all the activity is captured by the well<br />
– therefore only activity flux is required<br />
– concentration of water in well (in Ci/m 3 ) = activity flux (in<br />
Ci/yr) divided by the annual water demand (3.7 million<br />
m 3 /yr)<br />
00414PR_SZ_NRC_<strong>Andrews</strong>.ppt 41
C-Wells Transport Test Data<br />
PFBA - Pentafluorobenzoic Acid<br />
• Tracer tests confirm<br />
dual continuum<br />
(fracture - matrix)<br />
transport model<br />
• Matrix diffusion model<br />
confirmed (Bromide<br />
larger diameter than<br />
PFBA)<br />
• Sorbing tracers (e.g.,<br />
Lithium) behave<br />
analogously to lab<br />
sorption<br />
measurements<br />
• Colloid mobility<br />
confirmed using<br />
microsphere analogs<br />
00414PR_SZ_NRC_<strong>Andrews</strong>.ppt 42
Matrix Diffusion Coefficient Evaluated<br />
in Lab and Field Experiments<br />
• Matrix diffusion<br />
constrained between<br />
10 -7 and 10 -5 cm 2 /sec<br />
• Lab and field data<br />
show similar trends<br />
Left hand curve represents linear relationship based on porosity and permeability<br />
and Rundberg et al, 1987 and Triay 1993 data. Right hand curve represents lab<br />
and field data (Reimus et al., 2002): Squares 3 HHO lab data, diamonds TCO 4<br />
lab data, circles Br - and PFBA field data.<br />
00414PR_SZ_NRC_<strong>Andrews</strong>.ppt 43
Comparison of Lithium Transport<br />
in Laboratory and Field Tests<br />
• Laboratory (top figure) and<br />
field (bottom figure) Lithium<br />
retardation coefficients are<br />
similar<br />
• Field K d (range from 0.6 to<br />
4.1 ml/g) are slightly larger<br />
than laboratory K d (range<br />
from 0.1 to 0.3 ml/g)<br />
– difference perhaps a result<br />
of alteration minerals (e.g.,<br />
clays) removed during<br />
preparation of lab samples<br />
• Using laboratory-derived K d<br />
is conservative for post<br />
closure performance<br />
assessment<br />
00414PR_SZ_NRC_<strong>Andrews</strong>.ppt 44
Single Hole Tracer Test at<br />
Alluvial Testing Complex<br />
The plots are fits of three injection-pumpback tracer tests with theoretical<br />
curves that result from three solutions to the advection-dispersion equation<br />
for the three phases of injection, drift, and pumpback. “Plot 0” is the model fit<br />
and “Plot 1” is the data curve. The parameters used in the calculations are:<br />
flow porosity = 0.1, natural gradient = 0.002 m/m, T for gradient = 20.0 m 2 /d,<br />
specific discharge = 1.5 m/yr.<br />
• Single hole injectionwithdrawal<br />
tests<br />
determine<br />
– range of alluvium<br />
fluxes between 1.2<br />
and 9.4 m/yr<br />
– effective porosity of<br />
alluvium between<br />
0.05 and 0.3<br />
• Site-scale model<br />
calculated flux is about<br />
2.3 m/yr for nominal<br />
conditions<br />
00414PR_SZ_NRC_<strong>Andrews</strong>.ppt 45
Site Scale Carbon 14 Observations<br />
and Interpretation<br />
• Radiocarbon used to<br />
investigate<br />
groundwater velocities<br />
• Carbon-14 (half life of<br />
5700 yrs) has been<br />
used to evaluate<br />
groundwater ages<br />
• Groundwater velocity<br />
estimates range from 5<br />
to 40 m/yr<br />
(corresponding to<br />
advective transport<br />
times over 18 km) of<br />
several hundred to<br />
several thousand years<br />
for unretarded species)<br />
00414PR_SZ_NRC_<strong>Andrews</strong>.ppt 46
Carbon-14 versus Delta Carbon-13<br />
• Filled symbols indicate<br />
saturated groundwaters,<br />
open symbols indicate<br />
perched waters<br />
• Increase in Delta Carbon-13<br />
inferred to be due to calcite<br />
dissolution along flow path<br />
00414PR_SZ_NRC_<strong>Andrews</strong>.ppt 47
Sorption of Radionuclides on Tuff<br />
• Sorption (K d )<br />
determined in lab tests<br />
• Sorption is a function<br />
of radionuclide,<br />
chemistry and<br />
geologic media<br />
• Data indicate “old”<br />
(pre-1990) and “new”<br />
(post-1990) tests using<br />
J-13 or p#1 water for<br />
both sorption and<br />
desorption<br />
experiments<br />
00414PR_SZ_NRC_<strong>Andrews</strong>.ppt 48
Sorption of<br />
Radionuclides<br />
on Alluvium<br />
• Np and U sorption evaluated<br />
using alluvium samples from<br />
Nye County boreholes<br />
• Sorption is a function of grain<br />
size as smaller grains have<br />
higher percentage of clays<br />
• 75-2000 micron grain size tests<br />
only conducted using NC-<br />
EWDP-19D and -1X samples<br />
Neptunium Sorption (K d ) ml/g<br />
00414PR_SZ_NRC_<strong>Andrews</strong>.ppt 49
Calculated Radionuclide Mass Breakthrough<br />
• Plot indicative of nominal<br />
properties<br />
• Mass flux for non sorbing<br />
radionuclides indicates<br />
the bulk of the<br />
breakthrough occurs<br />
between several hundred<br />
and several thousand<br />
years<br />
– consistent with C-14<br />
interpretations<br />
• Moderately sorbing<br />
species (Np-237) only<br />
~ 5% breakthrough at<br />
10,000 years<br />
00414PR_SZ_NRC_<strong>Andrews</strong>.ppt 50
Calculated Radionuclide<br />
Breakthrough –<br />
Technetium<br />
• Technetium is a non-retarded<br />
radionuclide<br />
• Median Technetium<br />
breakthrough occurs at about<br />
500 years with a distribution<br />
from less 100 to more than<br />
10,000 years<br />
00414PR_SZ_NRC_<strong>Andrews</strong>.ppt 51
Calculated Radionuclide<br />
Breakthrough –<br />
Neptunium<br />
• Neptunium is a moderately sorbing<br />
radionuclide (Kd between 1 and 10<br />
ml/gm or Rd between about 10 and<br />
100)<br />
• Transport times generally between<br />
1000 and > 100,000 yrs<br />
• Mode of breakthrough distribution<br />
at about 20,000 years<br />
00414PR_SZ_NRC_<strong>Andrews</strong>.ppt 52
Calculated Radionuclide<br />
Breakthrough –<br />
Plutonium (dissolved)<br />
• Uncertainty in breakthrough<br />
indicates about 5% breakthrough<br />
before 10,000 years<br />
• Distribution of breakthroughs<br />
between < 10,000 years and ><br />
100,000 years<br />
00414PR_SZ_NRC_<strong>Andrews</strong>.ppt 53
Calculated Radionuclide Breakthrough –<br />
Plutonium (colloidal)<br />
• Colloid transport is<br />
significantly delayed<br />
from non sorbing<br />
radionuclides due to<br />
filtration-type<br />
processes<br />
• Colloid transport<br />
parameters developed<br />
from tests using<br />
analog microspheres<br />
in C-Wells<br />
00414PR_SZ_NRC_<strong>Andrews</strong>.ppt 54
Comparison to Alternative Representations<br />
Developed by NRC/CNWRA Staff<br />
• The Center for <strong>Nuclear</strong> <strong>Waste</strong> Regulatory Analysis has<br />
developed several models of saturated zone flow and<br />
transport<br />
• Winterle 2002 provides CNWRA analyses of alternate<br />
conceptual models of geologic structure and hydrologic<br />
boundary conditions on saturated zone flow and transport<br />
• The results of these analyses are presented here for<br />
information only<br />
• None of the cases presented are favored by NRC to be<br />
more representative of actual conditions<br />
00414PR_SZ_NRC_<strong>Andrews</strong>.ppt 55
NRC/CNWRA Flow<br />
Model Results<br />
• Flow paths are similar to<br />
those based on site-scale<br />
flow model<br />
• Increased southerly flow<br />
the result of enhanced<br />
north-south anisotropy<br />
00414PR_SZ_NRC_<strong>Andrews</strong>.ppt 56
NRC/CNWRA<br />
Transport Model<br />
Results<br />
• Particle travel times represent<br />
non retarded radionuclide<br />
advective-dispersive transport<br />
times<br />
• Similar results to our travel<br />
time distributions except at<br />
low end of advective transport<br />
times<br />
00414PR_SZ_NRC_<strong>Andrews</strong>.ppt 57
Summary and Conclusions –<br />
Groundwater Flow<br />
• Saturated zone flow models developed to evaluate flow directions<br />
and rates<br />
• Flow models are constrained by regional water budget and<br />
geochemistry and site-specific hydraulic heads and permeabilities<br />
• Flow model projects travel paths generally southeasterly and then<br />
southwesterly<br />
• Flow model predicts fluxes in the range of 0.7 to 2.3 m/yr<br />
• These fluxes are reasonably constrained by Carbon 14 ages and a<br />
single well tracer test in the alluvium<br />
• The fraction of the flow path in the alluvium is a function of the flow<br />
path and ranges between 1 and 10 km<br />
00414PR_SZ_NRC_<strong>Andrews</strong>.ppt 58
Summary and Conclusions –<br />
Radionuclide Transport<br />
• Effective flow porosities in the tuff and alluvium have<br />
been determined from tracer tests<br />
• Effective transport velocities developed from the flow and<br />
transport model yield transport times of between several<br />
100 and several 1000 years for unretarded species<br />
• These transport times are consistent with Carbon-14 ages<br />
• Confirmation of matrix diffusion and sorption processes<br />
have been confirmed in field tests<br />
• Sorption characteristics of radionuclides have been<br />
determined in range of laboratory experiments<br />
00414PR_SZ_NRC_<strong>Andrews</strong>.ppt 59
Summary and Conclusions –<br />
Results of Barrier Performance<br />
• Projections of saturated zone performance indicate a<br />
range of performance varying between 100’s to 1,000’s of<br />
years for non sorbing radionuclides (Tc, I, C), 1,000’s to<br />
10,000’s of years for moderately sorbing radionuclides<br />
(Np and U) and more than 10,000 years for highly sorbing<br />
radionuclides (Pu, Am)<br />
• Uncertainty in key flow and transport parameters has<br />
been included in projections of saturated zone<br />
performance<br />
• Additional drilling and testing continues as part of Nye<br />
County Early Warning Drilling Program<br />
00414PR_SZ_NRC_<strong>Andrews</strong>.ppt 60