PDF - New York Power Authority
PDF - New York Power Authority
PDF - New York Power Authority

You also want an ePaper? Increase the reach of your titles
YUMPU automatically turns print PDFs into web optimized ePapers that Google loves.
Strategic Initiatives<br />
The <strong>Authority</strong> is considering several projects, which are in varying stages of review and/or development. These<br />
initiatives include consideration of the following: entering into a contract for capacity on a proposed new transmission<br />
line between <strong>New</strong> Jersey and Manhattan for the benefit of its NYC Customers; a potential new transmission line that<br />
would deliver power from Canada and upstate <strong>New</strong> <strong>York</strong> to <strong>New</strong> <strong>York</strong> City; an off-shore wind generating facility in<br />
the <strong>New</strong> <strong>York</strong> waters of the Great Lakes and a second off-shore wind generating facility in the Atlantic Ocean off of<br />
Long Island; and the potential development of 100 MW of solar photovoltaic systems throughout the state. Contractual<br />
arrangements, if any, for the <strong>Authority</strong> to undertake these initiatives or for customers to take the related power are still to be<br />
determined. As a result, the financial plan does not reflect any costs or revenues with respect to these initiatives.<br />
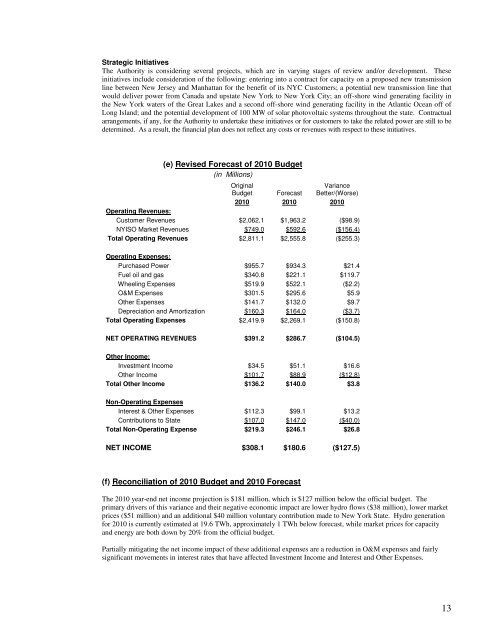
(e) Revised Forecast of 2010 Budget<br />
(in Millions)<br />
Original<br />
Budget Forecast<br />
Variance<br />
Better/(Worse)<br />
2010 2010 2010<br />
Operating Revenues:<br />
Customer Revenues $2,062.1 $1,963.2 ($98.9)<br />
NYISO Market Revenues $749.0 $592.6 ($156.4)<br />
Total Operating Revenues $2,811.1 $2,555.8 ($255.3)<br />
Operating Expenses:<br />
Purchased <strong>Power</strong> $955.7 $934.3 $21.4<br />
Fuel oil and gas $340.8 $221.1 $119.7<br />
Wheeling Expenses $519.9 $522.1 ($2.2)<br />
O&M Expenses $301.5 $295.6 $5.9<br />
Other Expenses $141.7 $132.0 $9.7<br />
Depreciation and Amortization $160.3 $164.0 ($3.7)<br />
Total Operating Expenses $2,419.9 $2,269.1 ($150.8)<br />
NET OPERATING REVENUES $391.2 $286.7 ($104.5)<br />
Other Income:<br />
Investment Income $34.5 $51.1 $16.6<br />
Other Income $101.7 $88.9 ($12.8)<br />
Total Other Income $136.2 $140.0 $3.8<br />
Non-Operating Expenses<br />
Interest & Other Expenses $112.3 $99.1 $13.2<br />
Contributions to State $107.0 $147.0 ($40.0)<br />
Total Non-Operating Expense $219.3 $246.1 $26.8<br />
NET INCOME $308.1 $180.6 ($127.5)<br />
(f) Reconciliation of 2010 Budget and 2010 Forecast<br />
The 2010 year-end net income projection is $181 million, which is $127 million below the official budget. The<br />
primary drivers of this variance and their negative economic impact are lower hydro flows ($38 million), lower market<br />
prices ($51 million) and an additional $40 million voluntary contribution made to <strong>New</strong> <strong>York</strong> State. Hydro generation<br />
for 2010 is currently estimated at 19.6 TWh, approximately 1 TWh below forecast, while market prices for capacity<br />
and energy are both down by 20% from the official budget.<br />
Partially mitigating the net income impact of these additional expenses are a reduction in O&M expenses and fairly<br />
significant movements in interest rates that have affected Investment Income and Interest and Other Expenses.<br />
13