PDF - New York Power Authority
PDF - New York Power Authority
PDF - New York Power Authority

Create successful ePaper yourself
Turn your PDF publications into a flip-book with our unique Google optimized e-Paper software.
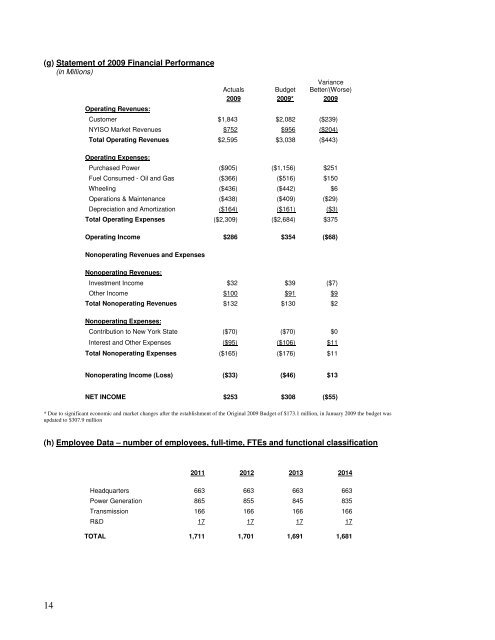
(g) Statement of 2009 Financial Performance<br />
(in Millions)<br />
Operating Revenues:<br />
Variance<br />
Actuals Budget Better/(Worse)<br />
2009 2009* 2009<br />
Customer $1,843 $2,082 ($239)<br />
NYISO Market Revenues $752 $956 ($204)<br />
Total Operating Revenues $2,595 $3,038 ($443)<br />
Operating Expenses:<br />
Purchased <strong>Power</strong> ($905) ($1,156) $251<br />
Fuel Consumed - Oil and Gas ($366) ($516) $150<br />
Wheeling ($436) ($442) $6<br />
Operations & Maintenance ($438) ($409) ($29)<br />
Depreciation and Amortization ($164) ($161) ($3)<br />
Total Operating Expenses ($2,309) ($2,684) $375<br />
Operating Income $286 $354 ($68)<br />
Nonoperating Revenues and Expenses<br />
Nonoperating Revenues:<br />
Investment Income $32 $39 ($7)<br />
Other Income $100 $91 $9<br />
Total Nonoperating Revenues $132 $130 $2<br />
Nonoperating Expenses:<br />
Contribution to <strong>New</strong> <strong>York</strong> State ($70) ($70) $0<br />
Interest and Other Expenses ($95) ($106) $11<br />
Total Nonoperating Expenses ($165) ($176) $11<br />
Nonoperating Income (Loss) ($33) ($46) $13<br />
NET INCOME $253 $308 ($55)<br />
* Due to significant economic and market changes after the establishment of the Original 2009 Budget of $173.1 million, in January 2009 the budget was<br />
updated to $307.9 million<br />
(h) Employee Data – number of employees, full-time, FTEs and functional classification<br />
2011 2012 2013 2014<br />
Headquarters 663 663 663 663<br />
<strong>Power</strong> Generation 865 855 845 835<br />
Transmission 166 166 166 166<br />
R&D 17 17 17 17<br />
TOTAL 1,711 1,701 1,691 1,681<br />
14