PDF - New York Power Authority
PDF - New York Power Authority
PDF - New York Power Authority

Create successful ePaper yourself
Turn your PDF publications into a flip-book with our unique Google optimized e-Paper software.
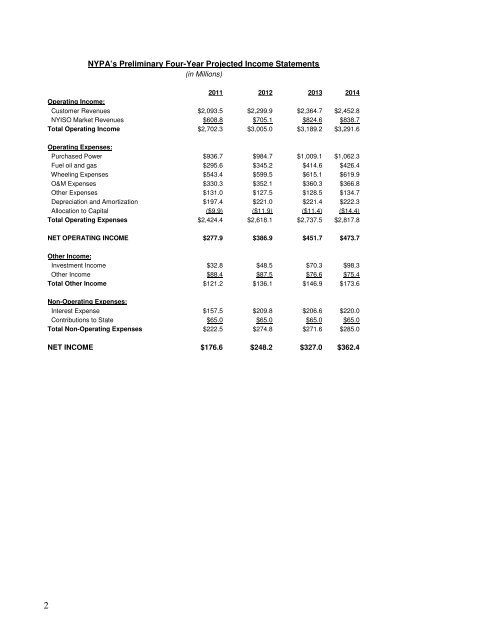
NYPA’s Preliminary Four-Year Projected Income Statements<br />
(in Millions)<br />
2011 2012 2013 2014<br />
Operating Income:<br />
Customer Revenues $2,093.5 $2,299.9 $2,364.7 $2,452.8<br />
NYISO Market Revenues $608.8 $705.1 $824.6 $838.7<br />
Total Operating Income $2,702.3 $3,005.0 $3,189.2 $3,291.6<br />
Operating Expenses:<br />
Purchased <strong>Power</strong> $936.7 $984.7 $1,009.1 $1,062.3<br />
Fuel oil and gas $295.6 $345.2 $414.6 $426.4<br />
Wheeling Expenses $543.4 $599.5 $615.1 $619.9<br />
O&M Expenses $330.3 $352.1 $360.3 $366.8<br />
Other Expenses $131.0 $127.5 $128.5 $134.7<br />
Depreciation and Amortization $197.4 $221.0 $221.4 $222.3<br />
Allocation to Capital ($9.9) ($11.9) ($11.4) ($14.4)<br />
Total Operating Expenses $2,424.4 $2,618.1 $2,737.5 $2,817.8<br />
NET OPERATING INCOME $277.9 $386.9 $451.7 $473.7<br />
Other Income:<br />
Investment Income $32.8 $48.5 $70.3 $98.3<br />
Other Income $88.4 $87.5 $76.6 $75.4<br />
Total Other Income $121.2 $136.1 $146.9 $173.6<br />
Non-Operating Expenses:<br />
Interest Expense $157.5 $209.8 $206.6 $220.0<br />
Contributions to State $65.0 $65.0 $65.0 $65.0<br />
Total Non-Operating Expenses $222.5 $274.8 $271.6 $285.0<br />
NET INCOME $176.6 $248.2 $327.0 $362.4<br />
2