PDF - New York Power Authority
PDF - New York Power Authority
PDF - New York Power Authority

You also want an ePaper? Increase the reach of your titles
YUMPU automatically turns print PDFs into web optimized ePapers that Google loves.
(i) Gap-Closing Initiatives – revenue enhancement or cost-reduction initiatives<br />
As the <strong>Authority</strong> is projecting positive net income for the 2011-2014 financial plan period, there are no planned gapclosing<br />
programs.<br />
(j) Material Non-recurring Resources – source and amount<br />
See discussion in “Other Income” section.<br />
(k) Shift in Material Resources<br />
There are no anticipated shifts in material resources from one year to another.<br />
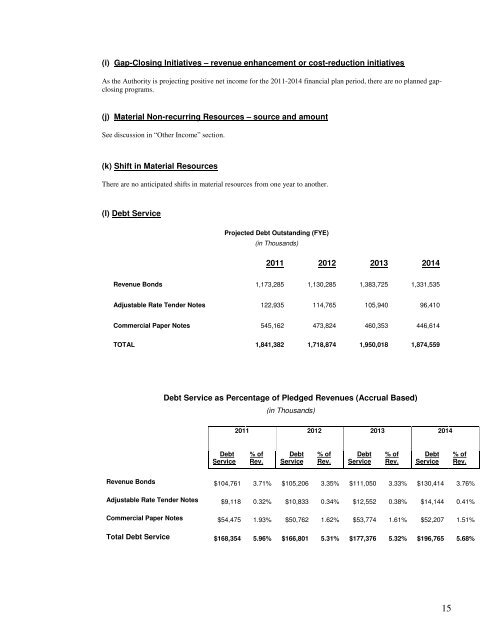
(l) Debt Service<br />
Projected Debt Outstanding (FYE)<br />
(in Thousands)<br />
2011 2012 2013 2014<br />
Revenue Bonds 1,173,285 1,130,285 1,383,725 1,331,535<br />
Adjustable Rate Tender Notes 122,935 114,765 105,940 96,410<br />
Commercial Paper Notes 545,162 473,824 460,353 446,614<br />
TOTAL 1,841,382 1,718,874 1,950,018 1,874,559<br />
Debt Service as Percentage of Pledged Revenues (Accrual Based)<br />
(in Thousands)<br />
2011 2012 2013 2014<br />
Debt<br />
Service<br />
% of<br />
Rev.<br />
Debt<br />
Service<br />
% of<br />
Rev.<br />
Debt<br />
Service<br />
% of<br />
Rev.<br />
Debt<br />
Service<br />
% of<br />
Rev.<br />
Revenue Bonds $104,761 3.71% $105,206 3.35% $111,050 3.33% $130,414 3.76%<br />
Adjustable Rate Tender Notes $9,118 0.32% $10,833 0.34% $12,552 0.38% $14,144 0.41%<br />
Commercial Paper Notes $54,475 1.93% $50,762 1.62% $53,774 1.61% $52,207 1.51%<br />
Total Debt Service $168,354 5.96% $166,801 5.31% $177,376 5.32% $196,765 5.68%<br />
15