Annual Report 2011 / 12 - New Zealand Trade and Enterprise
Annual Report 2011 / 12 - New Zealand Trade and Enterprise
Annual Report 2011 / 12 - New Zealand Trade and Enterprise

You also want an ePaper? Increase the reach of your titles
YUMPU automatically turns print PDFs into web optimized ePapers that Google loves.
26<br />
NEW ZEALAND TRADE AND ENTERPRISE ANNUAL REPORT <strong>2011</strong>/<strong>12</strong><br />
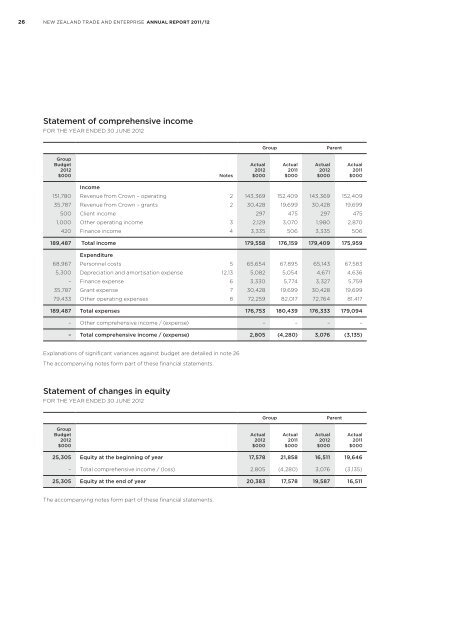
Statement of comprehensive income<br />
FOR THE YEAR ENDED 30 JUNE 20<strong>12</strong><br />
Group<br />
Parent<br />
Group<br />
Budget<br />
20<strong>12</strong><br />
$000 Notes<br />
Actual<br />
20<strong>12</strong><br />
$000<br />
Actual<br />
<strong>2011</strong><br />
$000<br />
Actual<br />
20<strong>12</strong><br />
$000<br />
Actual<br />
<strong>2011</strong><br />
$000<br />
Income<br />
151,780 Revenue from Crown – operating 2 143,369 152,409 143,369 152,409<br />
35,787 Revenue from Crown – grants 2 30,428 19,699 30,428 19,699<br />
500 Client income 297 475 297 475<br />
1,000 Other operating income 3 2,<strong>12</strong>9 3,070 1,980 2,870<br />
420 Finance income 4 3,335 506 3,335 506<br />
189,487 Total income 179,558 176,159 179,409 175,959<br />
Expenditure<br />
68,967 Personnel costs 5 65,654 67,895 65,143 67,583<br />
5,300 Depreciation <strong>and</strong> amortisation expense <strong>12</strong>,13 5,082 5,054 4,671 4,636<br />
– Finance expense 6 3,330 5,774 3,327 5,759<br />
35,787 Grant expense 7 30,428 19,699 30,428 19,699<br />
79,433 Other operating expenses 8 72,259 82,017 72,764 81,417<br />
189,487 Total expenses 176,753 180,439 176,333 179,094<br />
– Other comprehensive income / (expense) – – – –<br />
– Total comprehensive income / (expense) 2,805 (4,280) 3,076 (3,135)<br />
Explanations of significant variances against budget are detailed in note 26<br />
The accompanying notes form part of these financial statements.<br />
Statement of changes in equity<br />
FOR THE YEAR ENDED 30 JUNE 20<strong>12</strong><br />
Group<br />
Parent<br />
Group<br />
Budget<br />
20<strong>12</strong><br />
$000<br />
Actual<br />
20<strong>12</strong><br />
$000<br />
Actual<br />
<strong>2011</strong><br />
$000<br />
Actual<br />
20<strong>12</strong><br />
$000<br />
Actual<br />
<strong>2011</strong><br />
$000<br />
25,305 Equity at the beginning of year 17,578 21,858 16,511 19,646<br />
– Total comprehensive income / (loss) 2,805 (4,280) 3,076 (3,135)<br />
25,305 Equity at the end of year 20,383 17,578 19,587 16,511<br />
The accompanying notes form part of these financial statements.