immigrants' use of prestige brands to convey status - Emerald
immigrants' use of prestige brands to convey status - Emerald
immigrants' use of prestige brands to convey status - Emerald

Create successful ePaper yourself
Turn your PDF publications into a flip-book with our unique Google optimized e-Paper software.
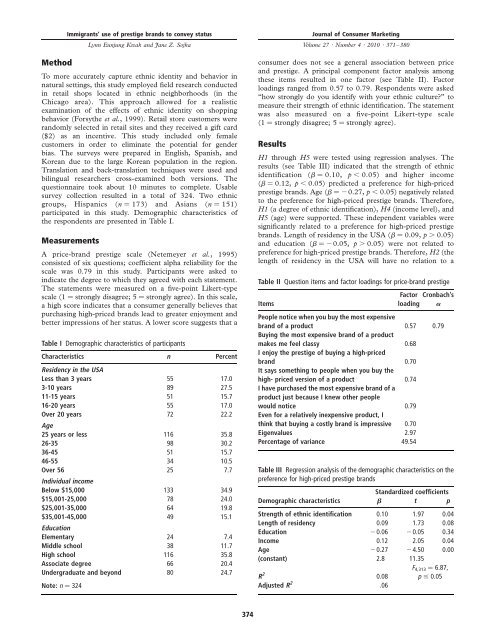
Method<br />
To more accurately capture ethnic identity and behavior in<br />
natural settings, this study employed field research conducted<br />
in retail shops located in ethnic neighborhoods (in the<br />
Chicago area). This approach allowed for a realistic<br />
examination <strong>of</strong> the effects <strong>of</strong> ethnic identity on shopping<br />
behavior (Forsythe et al., 1999). Retail s<strong>to</strong>re cus<strong>to</strong>mers were<br />
randomly selected in retail sites and they received a gift card<br />
($2) as an incentive. This study included only female<br />
cus<strong>to</strong>mers in order <strong>to</strong> eliminate the potential for gender<br />
bias. The surveys were prepared in English, Spanish, and<br />
Korean due <strong>to</strong> the large Korean population in the region.<br />
Translation and back-translation techniques were <strong>use</strong>d and<br />
bilingual researchers cross-examined both versions. The<br />
questionnaire <strong>to</strong>ok about 10 minutes <strong>to</strong> complete. Usable<br />
survey collection resulted in a <strong>to</strong>tal <strong>of</strong> 324. Two ethnic<br />
groups, Hispanics (n ¼ 173) and Asians (n ¼ 151)<br />
participated in this study. Demographic characteristics <strong>of</strong><br />
the respondents are presented in Table I.<br />
Measurements<br />
A price-brand <strong>prestige</strong> scale (Netemeyer et al., 1995)<br />
consisted <strong>of</strong> six questions; coefficient alpha reliability for the<br />
scale was 0.79 in this study. Participants were asked <strong>to</strong><br />
indicate the degree <strong>to</strong> which they agreed with each statement.<br />
The statements were measured on a five-point Likert-type<br />
scale (1 ¼ strongly disagree; 5 ¼ strongly agree). In this scale,<br />
a high score indicates that a consumer generally believes that<br />
purchasing high-priced <strong>brands</strong> lead <strong>to</strong> greater enjoyment and<br />
better impressions <strong>of</strong> her <strong>status</strong>. A lower score suggests that a<br />
Table I Demographic characteristics <strong>of</strong> participants<br />
Characteristics n Percent<br />
Residency in the USA<br />
Less than 3 years 55 17.0<br />
3-10 years 89 27.5<br />
11-15 years 51 15.7<br />
16-20 years 55 17.0<br />
Over 20 years 72 22.2<br />
Age<br />
25 years or less 116 35.8<br />
26-35 98 30.2<br />
36-45 51 15.7<br />
46-55 34 10.5<br />
Over 56 25 7.7<br />
Individual income<br />
Below $15,000 133 34.9<br />
$15,001-25,000 78 24.0<br />
$25,001-35,000 64 19.8<br />
$35,001-45,000 49 15.1<br />
Education<br />
Elementary 24 7.4<br />
Middle school 38 11.7<br />
High school 116 35.8<br />
Associate degree 66 20.4<br />
Undergraduate and beyond 80 24.7<br />
Note: n ¼ 324<br />
Immigrants’ <strong>use</strong> <strong>of</strong> <strong>prestige</strong> <strong>brands</strong> <strong>to</strong> <strong>convey</strong> <strong>status</strong><br />
Lynn Eunjung Kwak and Jane Z. Sojka<br />
consumer does not see a general association between price<br />
and <strong>prestige</strong>. A principal component fac<strong>to</strong>r analysis among<br />
these items resulted in one fac<strong>to</strong>r (see Table II). Fac<strong>to</strong>r<br />
loadings ranged from 0.57 <strong>to</strong> 0.79. Respondents were asked<br />
“how strongly do you identify with your ethnic culture?” <strong>to</strong><br />
measure their strength <strong>of</strong> ethnic identification. The statement<br />
was also measured on a five-point Likert-type scale<br />
(1 ¼ strongly disagree; 5 ¼ strongly agree).<br />
Results<br />
H1 through H5 were tested using regression analyses. The<br />
results (see Table III) indicated that the strength <strong>of</strong> ethnic<br />
identification (b ¼ 0.10, p , 0.05) and higher income<br />
(b ¼ 0.12, p , 0.05) predicted a preference for high-priced<br />
<strong>prestige</strong> <strong>brands</strong>. Age (b ¼ 20.27, p , 0.05) negatively related<br />
<strong>to</strong> the preference for high-priced <strong>prestige</strong> <strong>brands</strong>. Therefore,<br />
H1 (a degree <strong>of</strong> ethnic identification), H4 (income level), and<br />
H5 (age) were supported. These independent variables were<br />
significantly related <strong>to</strong> a preference for high-priced <strong>prestige</strong><br />
<strong>brands</strong>. Length <strong>of</strong> residency in the USA (b ¼ 0.09, p . 0.05)<br />
and education (b ¼ 20.05, p . 0.05) were not related <strong>to</strong><br />
preference for high-priced <strong>prestige</strong> <strong>brands</strong>. Therefore, H2 (the<br />
length <strong>of</strong> residency in the USA will have no relation <strong>to</strong> a<br />
Table II Question items and fac<strong>to</strong>r loadings for price-brand <strong>prestige</strong><br />
Items<br />
Journal <strong>of</strong> Consumer Marketing<br />
Volume 27 · Number 4 · 2010 · 371–380<br />
Fac<strong>to</strong>r Cronbach’s<br />
loading a<br />
People notice when you buy the most expensive<br />
brand <strong>of</strong> a product 0.57 0.79<br />
Buying the most expensive brand <strong>of</strong> a product<br />
makes me feel classy 0.68<br />
I enjoy the <strong>prestige</strong> <strong>of</strong> buying a high-priced<br />
brand 0.70<br />
It says something <strong>to</strong> people when you buy the<br />
high- priced version <strong>of</strong> a product 0.74<br />
I have purchased the most expensive brand <strong>of</strong> a<br />
product just beca<strong>use</strong> I knew other people<br />
would notice 0.79<br />
Even for a relatively inexpensive product, I<br />
think that buying a costly brand is impressive 0.70<br />
Eigenvalues 2.97<br />
Percentage <strong>of</strong> variance 49.54<br />
Table III Regression analysis <strong>of</strong> the demographic characteristics on the<br />
preference for high-priced <strong>prestige</strong> <strong>brands</strong><br />
Standardized coefficients<br />
Demographic characteristics b t p<br />
Strength <strong>of</strong> ethnic identification 0.10 1.97 0.04<br />
Length <strong>of</strong> residency 0.09 1.73 0.08<br />
Education 20.06 20.05 0.34<br />
Income 0.12 2.05 0.04<br />
Age 20.27 24.50 0.00<br />
(constant) 2.8 11.35<br />
R 2 0.08<br />
F 4,313 ¼ 6.87,<br />
p # 0.05<br />
Adjusted R 2 .06<br />
374