MHC class II transactivator CIITA is a recurrent ... - Ohio University
MHC class II transactivator CIITA is a recurrent ... - Ohio University
MHC class II transactivator CIITA is a recurrent ... - Ohio University

You also want an ePaper? Increase the reach of your titles
YUMPU automatically turns print PDFs into web optimized ePapers that Google loves.
RESEARCH<br />
LETTER<br />
fell within a 1.6-kilobase (kb)-spanning breakpoint cluster region in<br />
intron 1, indicating a ‘hot spot’ area for chromosomal breaks (Supplementary<br />
Fig. 8). In the case of CD274 (PDL1), CD273 (PDL2) and<br />
RUNDC2A, the fusion transcripts merged exon 1 of C<strong>II</strong>TA with exon 2<br />
of the respective fusion partners, resulting in open reading frames<br />
(Supplementary Information). Of note, in both cases with C<strong>II</strong>TA–<br />
CD273 fusions, mutations to the C<strong>II</strong>TA start codon were detected<br />
resulting in translational reading frames beginning at the original<br />
CD273 start site (Supplementary Information). Overexpression of<br />
CD274 and CD273 closely linked to copy number gain has been<br />
previously described in PMBCL and Hodgkin lymphoma 19–21 , and<br />
a<br />
b<br />
c<br />
d<br />
CD2-PE<br />
CD69 MFI<br />
f<br />
1 2 3 10 4<br />
U2940 (PMBCL) U2932 (ABC) SUDHL4 (GCB) U2940 (PMBCL) U2932 (ABC) SUDHL4 (GCB)<br />
100<br />
100<br />
80<br />
80<br />
60<br />
60<br />
40<br />
40<br />
20<br />
20<br />
0 10<br />
0<br />
10 0 10 1 10 2 10 3 10 4 10 0 10 1 10 2 10 3 10 4 0<br />
10 0 10 1 10 2 10 3 10 4 10 0 10 1 10 2 10 3 10 4 10 0 10 1 10 2 10 3 10 4<br />
10 0 10 10 10<br />
CD274<br />
CD273<br />
Anti-CD3/CD28<br />
No Ab<br />
no PMBCL 1:1 1:2 1:4 (T/PMBCL) no PMBCL 1:1 (T/PMBCL)<br />
10 4<br />
30.1<br />
13.4 36.6 11<br />
11<br />
98.8<br />
42.5<br />
10 3<br />
10 2<br />
10 1<br />
10 0 10 1 10 2 10 3 10 4 10 0 10 1 10 2 10 3 10 4 10 0 10 1 10 2 10 3 10 4 10 0 10 1 10 2 10 3 10 4 10 0 10 1 10 2 10 3 10 4 10 0 10 1 10 2 10 3 10 4<br />
CD69-FITC<br />
Counts<br />
Counts<br />
Counts<br />
100<br />
80<br />
60<br />
40<br />
20<br />
0<br />
no PMBCL 1:1 1:2 1:4<br />
T cells : PMBCL<br />
100<br />
80<br />
60<br />
40<br />
20<br />
0<br />
IL-2 (pg ml –1 )<br />
100<br />
80<br />
60<br />
40<br />
20<br />
0<br />
Relative CD274 mRNA<br />
expression (log 2 )<br />
Relative CD274<br />
mRNA expression<br />
10 0 10 1 10 2 10 3 10 4<br />
CD274<br />
0<br />
Anti-CD3/CD28<br />
PMBCL cells<br />
Inhibitor<br />
10 0 10 1 10 2 10 3 10 4<br />
CD273<br />
10 0 10 1 10 2 10 3 10 4 10 0 10 1 10 2 10 3 10 4<br />
500<br />
400<br />
300<br />
200<br />
100<br />
0<br />
PMBCL<br />
5<br />
4<br />
3<br />
2<br />
1<br />
0<br />
–1<br />
–2<br />
600<br />
500<br />
400<br />
300<br />
200<br />
100<br />
0<br />
CB1<br />
CB2<br />
CD69<br />
* *<br />
ABC<br />
DLBCL<br />
PM1<br />
PM2<br />
PM3<br />
** **<br />
GCB<br />
DLBCL<br />
4 h 24 h 24 h<br />
0<br />
* ** **<br />
PM4<br />
PM5<br />
PM6<br />
CD77 + PMBCL samples<br />
centroblasts<br />
PM7<br />
U2940<br />
e<br />
CD69 MFI<br />
100<br />
80<br />
60<br />
40<br />
20<br />
Counts<br />
Relative CD273 mRNA<br />
expression (log 2 )<br />
Relative CD273<br />
mRNA expression<br />
6<br />
5<br />
4<br />
3<br />
2<br />
1<br />
0<br />
–1<br />
–2<br />
5,000<br />
4,000<br />
3,000<br />
2,000<br />
1,000<br />
PMBCL<br />
**<br />
* * *<br />
– + + + – + +<br />
– – + + – + +<br />
– – Ctrl CTLA4 PD-1 CD274<br />
Ig -Fc -Fc -Fc<br />
+<br />
+<br />
CD273<br />
-Fc<br />
U2932 cells expressing C<strong>II</strong>TA-CD274 (left)<br />
or CD273 fusion (right)<br />
U2932 cells expressing empty vector<br />
T cells stimulated with CD3/CD28 antibodies<br />
Plus 6x U2932 cells expressing C<strong>II</strong>TA–CD274<br />
(left, MFI: 20.6) or CD273 fusion (right, MFI: 20.4)<br />
Plus 6x U2932 cells expressing empty vector<br />
(MFI: 35.4)<br />
Unstimulated T cells<br />
T cells stimulated with CD3/CD28 antibodies<br />
Plus 6x U2932 cells expressing empty vector<br />
Plus 6x U2932 cells expressing C<strong>II</strong>TA–CD274 fusion<br />
Plus 6x U2932 cells expressing C<strong>II</strong>TA–CD273 fusion<br />
Unstimulated T cells<br />
ABC<br />
DLBCL<br />
CB1<br />
CB2<br />
PM1<br />
PM2<br />
PM3<br />
GCB<br />
DLBCL<br />
PM4<br />
PM5<br />
PM6PM7<br />
CD77 + PMBCL samples<br />
centroblasts<br />
Un<strong>class</strong>.<br />
Un<strong>class</strong>.<br />
U2940<br />
expression of CD274 has been shown to correlate with poor prognos<strong>is</strong><br />
in other cancers 22 . Furthermore, re-analys<strong>is</strong> of gene expression profiling<br />
data confirmed overexpression of both genes in over 50% of cases of<br />
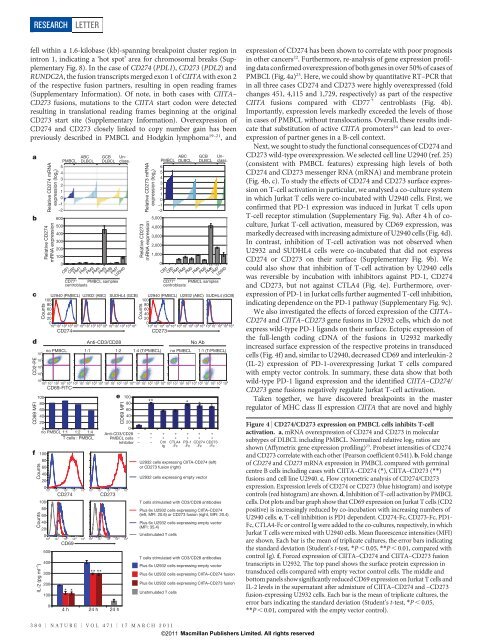
PMBCL (Fig. 4a) 23 . Here, we could show by quantitative RT–PCR that<br />
in all three cases CD274 and CD273 were highly overexpressed (fold<br />
changes 451, 4,115 and 1,729, respectively) as part of the respective<br />
C<strong>II</strong>TA fusions compared with CD77 1 centroblasts (Fig. 4b).<br />
Importantly, expression levels markedly exceeded the levels of those<br />
in cases of PMBCL without translocations. Overall, these results indicate<br />
that substitution of active C<strong>II</strong>TA promoters 24 can lead to overexpression<br />
of partner genes in a B-cell context.<br />
Next, we sought to study the functional consequences of CD274 and<br />
CD273 wild-type overexpression. We selected cell line U2940 (ref. 25)<br />
(cons<strong>is</strong>tent with PMBCL features) expressing high levels of both<br />
CD274 and CD273 messenger RNA (mRNA) and membrane protein<br />
(Fig. 4b, c). To study the effects of CD274 and CD273 surface expression<br />
on T-cell activation in particular, we analysed a co-culture system<br />
in which Jurkat T cells were co-incubated with U2940 cells. First, we<br />
confirmed that PD-1 expression was induced in Jurkat T cells upon<br />
T-cell receptor stimulation (Supplementary Fig. 9a). After 4 h of coculture,<br />
Jurkat T-cell activation, measured by CD69 expression, was<br />
markedly decreased with increasing admixture of U2940 cells (Fig. 4d).<br />
In contrast, inhibition of T-cell activation was not observed when<br />
U2932 and SUDHL4 cells were co-incubated that did not express<br />
CD274 or CD273 on their surface (Supplementary Fig. 9b). We<br />
could also show that inhibition of T-cell activation by U2940 cells<br />
was reversible by incubation with inhibitors against PD-1, CD274<br />
and CD273, but not against CTLA4 (Fig. 4e). Furthermore, overexpression<br />
of PD-1 in Jurkat cells further augmented T-cell inhibition,<br />
indicating dependence on the PD-1 pathway (Supplementary Fig. 9c).<br />
We also investigated the effects of forced expression of the C<strong>II</strong>TA–<br />
CD274 and C<strong>II</strong>TA–CD273 gene fusions in U2932 cells, which do not<br />
express wild-type PD-1 ligands on their surface. Ectopic expression of<br />
the full-length coding cDNA of the fusions in U2932 markedly<br />
increased surface expression of the respective proteins in transduced<br />
cells (Fig. 4f) and, similar to U2940, decreased CD69 and interleukin-2<br />
(IL-2) expression of PD-1-overexpressing Jurkat T cells compared<br />
with empty vector controls. In summary, these data show that both<br />
wild-type PD-1 ligand expression and the identified C<strong>II</strong>TA–CD274/<br />
CD273 gene fusions negatively regulate Jurkat T-cell activation.<br />
Taken together, we have d<strong>is</strong>covered breakpoints in the master<br />
regulatorof<strong>MHC</strong><strong>class</strong><strong>II</strong>expressionC<strong>II</strong>TA that are novel and highly<br />
Figure 4 | CD274/CD273 expression on PMBCL cells inhibits T-cell<br />
activation. a, mRNA overexpression of CD274 and CD273 in molecular<br />
subtypes of DLBCL including PMBCL. Normalized relative log 2 ratios are<br />
shown (Affymetrix gene expression profiling) 23 . Probeset intensities of CD274<br />
and CD273 correlate with each other (Pearson coefficient 0.541). b,Foldchange<br />
of CD274 and CD273 mRNA expression in PMBCL compared with germinal<br />
centre B cells including cases with C<strong>II</strong>TA–CD274 (*), C<strong>II</strong>TA–CD273 (**)<br />
fusions and cell line U2940. c, Flow cytometric analys<strong>is</strong> of CD274/CD273<br />
expression. Expression levels of CD274 or CD273 (blue h<strong>is</strong>togram) and <strong>is</strong>otype<br />
controls (red h<strong>is</strong>togram) are shown. d, Inhibition of T-cell activation by PMBCL<br />
cells. Dot plots and bar graph show that CD69 expression on Jurkat T cells (CD2<br />
positive) <strong>is</strong> increasingly reduced by co-incubation with increasing numbers of<br />
U2940 cells. e, T-cell inhibition <strong>is</strong> PD1 dependent. CD274-Fc, CD273-Fc, PD1-<br />
Fc, CTLA4-Fc or control Ig were added to the co-cultures, respectively, in which<br />
Jurkat T cells were mixed with U2940 cells. Mean fluorescence intensities (MFI)<br />
are shown. Each bar <strong>is</strong> the mean of triplicate cultures, the error bars indicating<br />
the standard deviation (Student’s t-test, *P , 0.05, **P , 0.01, compared with<br />
control Ig). f, Forced expression of C<strong>II</strong>TA–CD274 and C<strong>II</strong>TA–CD273 fusion<br />
transcripts in U2932. The top panel shows the surface protein expression in<br />
transduced cells compared with empty vector control cells. The middle and<br />
bottom panels show significantly reduced CD69 expression on Jurkat T cells and<br />
IL-2 levels in the supernatant after admixture of C<strong>II</strong>TA–CD274 and –CD273<br />
fusion-expressing U2932 cells. Each bar <strong>is</strong> the mean of triplicate cultures, the<br />
error bars indicating the standard deviation (Student’s t-test, *P , 0.05,<br />
**P , 0.01, compared with the empty vector control).<br />
380 | NATURE | VOL 471 | 17 MARCH 2011<br />
©2011 Macmillan Publ<strong>is</strong>hers Limited. All rights reserved