Supplemental Disclosure Material - Ono
Supplemental Disclosure Material - Ono
Supplemental Disclosure Material - Ono

You also want an ePaper? Increase the reach of your titles
YUMPU automatically turns print PDFs into web optimized ePapers that Google loves.
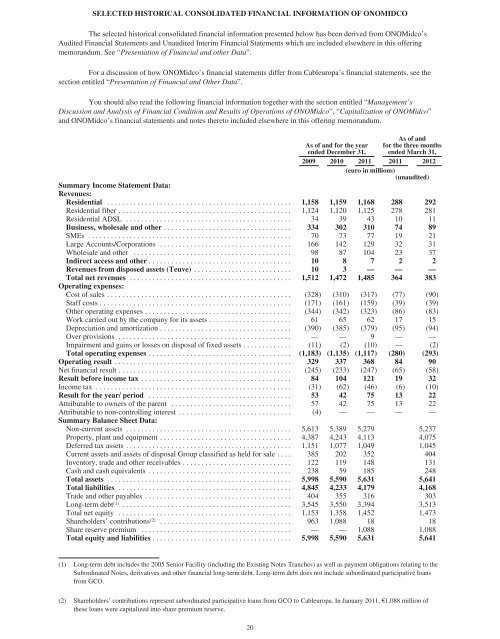
SELECTED HISTORICAL CONSOLIDATED FINANCIAL INFORMATION OF ONOMIDCO<br />
The selected historical consolidated financial information presented below has been derived from ONOMidco’s<br />
Audited Financial Statements and Unaudited Interim Financial Statements which are included elsewhere in this offering<br />
memorandum. See “Presentation of Financial and other Data”.<br />
For a discussion of how ONOMidco’s financial statements differ from Cableuropa’s financial statements, see the<br />
section entitled “Presentation of Financial and Other Data”.<br />
You should also read the following financial information together with the section entitled “Management’s<br />
Discussion and Analysis of Financial Condition and Results of Operations of ONOMidco”, “Capitalization of ONOMidco”<br />
and ONOMidco’s financial statements and notes thereto included elsewhere in this offering memorandum.<br />
As of and<br />
for the three months<br />
ended March 31,<br />
As of and for the year<br />
ended December 31,<br />
2009 2010 2011 2011 2012<br />
(euro in millions)<br />
(unaudited)<br />
Summary Income Statement Data:<br />
Revenues:<br />
Residential ................................................. 1,158 1,159 1,168 288 292<br />
Residential fiber .............................................. 1,124 1,120 1,125 278 281<br />
Residential ADSL ............................................ 34 39 43 10 11<br />
Business, wholesale and other .................................. 334 302 310 74 89<br />
SMEs ...................................................... 70 73 77 19 21<br />
Large Accounts/Corporations ................................... 166 142 129 32 31<br />
Wholesale and other .......................................... 98 87 104 23 37<br />
Indirect access and other ...................................... 10 8 7 2 2<br />
Revenues from disposed assets (Teuve) .......................... 10 3 — — —<br />
Total net revenues ........................................... 1,512 1,472 1,485 364 383<br />
Operating expenses:<br />
Cost of sales ................................................. (328) (310) (317) (77) (90)<br />
Staff costs ................................................... (171) (161) (159) (39) (39)<br />
Other operating expenses ....................................... (344) (342) (323) (86) (83)<br />
Work carried out by the company for its assets ...................... 61 65 62 17 15<br />
Depreciation and amortization ................................... (390) (385) (379) (95) (94)<br />
Over provisions .............................................. — — 9 — —<br />
Impairment and gains or losses on disposal of fixed assets ............. (11) (2) (10) — (2)<br />
Total operating expenses ...................................... (1,183) (1,135) (1,117) (280) (293)<br />
Operating result ............................................... 329 337 368 84 90<br />
Net financial result .............................................. (245) (233) (247) (65) (58)<br />
Result before income tax ........................................ 84 104 121 19 32<br />
Income tax .................................................... (31) (62) (46) (6) (10)<br />
Result for the year/ period ...................................... 53 42 75 13 22<br />
Attributable to owners of the parent ................................ 57 42 75 13 22<br />
Attributable to non-controlling interest .............................. (4) — — — —<br />
Summary Balance Sheet Data:<br />
Non-current assets ............................................ 5,613 5,389 5,279 5,237<br />
Property, plant and equipment ................................... 4,387 4,243 4,113 4,075<br />
Deferred tax assets ............................................ 1,151 1,077 1,049 1,045<br />
Current assets and assets of disposal Group classified as held for sale .... 385 202 352 404<br />
Inventory, trade and other receivables ............................. 122 119 148 131<br />
Cash and cash equivalents ...................................... 238 59 185 248<br />
Total assets ................................................. 5,998 5,590 5,631 5,641<br />
Total liabilities .............................................. 4,845 4,233 4,179 4,168<br />
Trade and other payables ....................................... 404 355 316 303<br />
Long-term debt (1) ............................................. 3,545 3,550 3,394 3,513<br />
Total net equity .............................................. 1,153 1,358 1,452 1,473<br />
Shareholders’ contributions (2) ................................... 963 1,088 18 18<br />
Share reserve premium ........................................ — — 1,088 1,088<br />
Total equity and liabilities ..................................... 5,998 5,590 5,631 5,641<br />
(1) Long-term debt includes the 2005 Senior Facility (including the Existing Notes Tranches) as well as payment obligations relating to the<br />
Subordinated Notes, derivatives and other financial long-term debt. Long-term debt does not include subordinated participative loans<br />
from GCO.<br />
(2) Shareholders’ contributions represent subordinated participative loans from GCO to Cableuropa. In January 2011, €1,088 million of<br />
these loans were capitalized into share premium reserve.<br />
20