Thomson Reuters Mid - BMR Advisors
Thomson Reuters Mid - BMR Advisors
Thomson Reuters Mid - BMR Advisors

You also want an ePaper? Increase the reach of your titles
YUMPU automatically turns print PDFs into web optimized ePapers that Google loves.
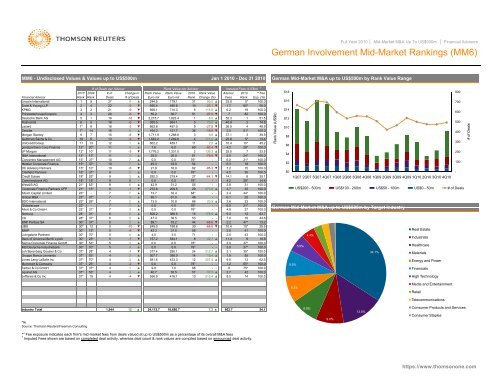
Full Year 2010 │ <strong>Mid</strong>-Market M&A Up To US$500m │ Financial <strong>Advisors</strong><br />
German Involvement <strong>Mid</strong>-Market Rankings (MM6)<br />
MM6 - Undisclosed Values & Values up to US$500m<br />
Jan 1 2010 - Dec 31 2010<br />
German <strong>Mid</strong>-Market M&A up to US$500m by Rank Value Range<br />
# of Deals per Advisor<br />
Rank Value per Advisor<br />
Imputed Fees (US$m) †<br />
2010 2009 # of Change in Rank Value Rank Value 2010 Rank Value Advisor 2010 ** Fee<br />
Financial Advisor<br />
Rank Rank Deals # of Deals Euro mil Euro mil Rank Change (%) Fees Rank Exp. (%)<br />
Lincoln International 1 9<br />
27<br />
9 ▲ 244.5 179.1 31 95.0 ▲ 25.8 5* 100.0<br />
Ernst & Young LLP 2 4 22<br />
-3 ▼ 650.4 485.6 10 -23.1 ▼ 1.7 60* 50.0<br />
KPMG 3 2<br />
21<br />
-9 ▼ 929.1 710.3<br />
6 115.8 ▲ 6.2 19 100.0<br />
PricewaterhouseCoopers 4 3 20<br />
-6 ▼ 50.2 36.7 51 -97.0 ▼ .7 82 100.0<br />
Deutsche Bank AG 5 1 19<br />
-16 ▼ 2,215.7 1,623.4 1 8.5 ▲ 52.3 1 51.5<br />
Rothschild 6 5 18 -6 ▼ 935.5 694.1<br />
5 70.0 ▲ 40.9 2 74.8<br />
Lazard 7* 8 16 -3 ▼ 662.6 497.0<br />
9 -27.8 ▼ 36.9 4 48.9<br />
Deloitte 7* 14 16 6 ▲ 164.2 121.7 36 -18.8 ▼ 2.0 51* 100.0<br />
Morgan Stanley 9 7 15 -6 ▼ 1,711.9 1,288.6 3 9.6 ▲ 37.1 3 39.9<br />
Goldman Sachs & Co 10 6 13 -9 ▼ 1,642.2 1,249.6 4 111.5 ▲ 25.8 5* 13.4<br />
UniCredit Group 11 13 12<br />
1 ▲ 602.2 459.1 11 2.2 ▲ 10.4 10* 45.2<br />
goetzpartners Corp Finance 12* 20* 11 4 ▲ 7.6 6.0<br />
69 -92.4 ▼ 4.2 28* 100.0<br />
JP Morgan<br />
12* 10* 11<br />
-5 ▼ 1,776.2 1,331.0 2 136.3 ▲ 25.5 7 33.5<br />
M&A International 12* 15* 11<br />
2 ▲ 25.5 20.0 61 -79.5 ▼ 5.0 24* 100.0<br />
Concentro Management AG 15* 37* 10 7 ▲ 0.0 0.0 76* - - 6.0 21* 100.0<br />
Metzler Corporate Finance 15* 37* 10<br />
7 ▲ 45.3 33.0 54 - - 6.3 18 100.0<br />
DC Advisory Partners 15* 10* 10<br />
-6 ▼ 21.9 16.0 62 -85.3 ▼ 7.2 15 100.0<br />
Clairfield Partners 18* 31* 9<br />
5 ▲ 0.0 0.0 76*<br />
- - 4.0 30 100.0<br />
Credit Suisse 18* 25* 9<br />
3 ▲ 292.3 219.4 27 -64.1 ▼ 14.1 8 35.1<br />
Commerzbank AG 18* 15* 9<br />
0 - 00 0.0 00 0.0<br />
76* - - 42 4.2<br />
28*<br />
24.6<br />
WestLB AG 21* 53* 8<br />
6 ▲ 42.9 31.2 55<br />
- - 3.8 31 100.0<br />
Corporate Finance Partners CFP 21* 15* 8<br />
-1 ▼ 272.6 209.5 29 273.9 ▲ 3.7 32 100.0<br />
Altium Capital Limited<br />
23* - 7<br />
7 ▲ 13.7 10.4 64* - - 2.4 44* 100.0<br />
Global M&A 23* 37* 7<br />
4 ▲ 85.1 61.0 46<br />
- - 6.1 20 100.0<br />
BDO International 23* 28* 7<br />
2 ▲ 13.5 10.8 66 20.5 ▲ 3.6 33 100.0<br />
Globalscope<br />
23* - 7<br />
7 ▲ 0.0<br />
0.0 76* - - 6.0 21* 100.0<br />
Allert & Co GmbH 23* 31* 7<br />
3 ▲ 0.0<br />
0.0 76*<br />
- - 4.8 27 100.0<br />
Nomura 28* 31* 6 2 ▲ 506.2 386.5 15 178.9 ▲ 9.3 12 63.7<br />
Citi<br />
28* 37* 6 3 ▲ 47.4 36.5 53<br />
- - 7.0 16 44.6<br />
BNP Paribas SA 30* 37* 5 2 ▲ 89.1 70.2 44 -68.6 ▼ 2.2 47* 13.2<br />
UBS 30* 12 5 -10 ▼ 245.0 188.6 30 -68.8 ▼ 10.4 10* 28.5<br />
IMAP 30* 15* 5 -4 ▼ 42.3 31.5 56<br />
- - 2.8 41 100.0<br />
Livingstone Partners 30* 70* 5<br />
4 ▲ 4.0<br />
3.0<br />
71<br />
- - 2.5 43 100.0<br />
Bank of America Merrill Lynch 30* 25* 5 -1 ▼ 757.2 534.1<br />
8 42.7 ▲ 11.4 9 18.8<br />
Sigma Corporate Finance GmbH 30* 53* 5 3 ▲ 0.0<br />
0.0 76* - - 3.0 37* 100.0<br />
IKB Deutsche Industriebank 30* 70* 5 4 ▲ 0.0 0.0 76*<br />
- - 3.0 37* 100.0<br />
Joh Berenberg Gossler & Co<br />
37* 28* 4 -1 ▼ 377.4 290.1 24 212.7 ▲ 3.1 35* 100.0<br />
Gruppo Banca Leonardo 37* 53* 4 2 ▲ 507.7 390.0 14 19.4 ▲ 1.9 55 100.0<br />
Jones Lang LaSalle Inc 37* 70* 4 3 ▲ 581.6 433.3 12 207.4 ▲ 9.0 13 62.5<br />
Mummert & Company 37* 25* 4 -2 ▼ 0.0<br />
0.0 76* - - 1.2 65* 100.0<br />
Ferber & Co GmbH 37* 37* 4 1 ▲ 9.8 7.0 68 - - .8 75* 100.0<br />
equinet AG 37* 53* 4 2 ▲ 40.7 30.5 57 37.5 ▲ 2.7 42 100.0<br />
Jefferies & Co Inc 37* 19 4 -4 ▼ 556.9 416.1 13 515.4 ▲ 8.5 14 100.0<br />
Rank Value (US$b)<br />
$18<br />
$16<br />
$14<br />
$12<br />
$10<br />
$8<br />
$6<br />
$4<br />
$2<br />
$0<br />
800<br />
700<br />
600<br />
500<br />
400<br />
300<br />
200<br />
100<br />
-<br />
1Q07 2Q07 3Q07 4Q07 1Q08 2Q08 3Q08 4Q08 1Q09 2Q09 3Q09 4Q09 1Q10 2Q10 3Q10 4Q10<br />
US$200 - 500m US$100 - 200m US$50 - 100m US$0 - 50m # of Deals<br />
German <strong>Mid</strong>-Market M&A up to US$500m by Target Industry<br />
2.7%<br />
Real Estate<br />
4.4%<br />
Industrials<br />
5.9%<br />
Healthcare<br />
34.1%<br />
Materials<br />
Energy and Power<br />
8.5%<br />
Financials<br />
High Technology<br />
# of Deals<br />
8.5%<br />
Media and Entertainment<br />
Retail<br />
Telecommunications<br />
Industry Total<br />
*tie<br />
Source: <strong>Thomson</strong> <strong>Reuters</strong>/Freeman Consulting<br />
1,944 12 ▲<br />
24,112.7 18,680.7<br />
7.3 ▲<br />
802.7<br />
54.1<br />
8.9%<br />
9.0%<br />
13.5%<br />
Consumer Products and Services<br />
Consumer Staples<br />
** Fee exposure indicates each firm's mid-market fees from deals valued at up to US$500m as a percentage of its overall M&A fees<br />
† Imputed Fees shown are based on completed deal activity, whereas deal count & rank values are compiled based on announced deal activity.<br />
https://www.thomsonone.com