
Create successful ePaper yourself
Turn your PDF publications into a flip-book with our unique Google optimized e-Paper software.
<strong>ALGEBRA</strong> I<br />
Assignments<br />
© 2008 Carnegie Learning, Inc.
Pittsburgh, PA<br />
Phone 888.851.7094<br />
Fax 412.690.2444<br />
www.carnegielearning.com<br />
Acknowledgements<br />
We would like to thank those listed below who helped<br />
to prepare the Cognitive Tutor ® Algebra I Assignments.<br />
Michael and Emily Amick<br />
Claudine Thiem<br />
Michele Covatto<br />
The Carnegie Learning Development Team<br />
Copyright © 2008 by Carnegie Learning, Inc. All rights reserved. Carnegie Learning,<br />
Cognitive Tutor, <strong>School</strong>Care, and Learning by Doing are all registered marks <strong>of</strong> Carnegie<br />
Learning, Inc. All other company and product names mentioned are used for identification<br />
purposes only and may be trademarks <strong>of</strong> their respective owners. This product or portions<br />
there<strong>of</strong> is manufactured under license form Carnegie Mellon University. Permission is granted<br />
for photocopying rights within licensed sites only. Any other usage or reproduction in any<br />
form is prohibited without the express consent <strong>of</strong> the publisher.<br />
ISBN-13 978-1-932409-61-1<br />
ISBN-10 1-932409-61-0<br />
Assignments<br />
Printed in the United States <strong>of</strong> America<br />
1-2006-VH<br />
2-2006-VH<br />
3-2006-VH<br />
4-2006-VH<br />
5-2006-VH<br />
6-2007-VH<br />
7-2007-VH<br />
8-4/2008-HPS<br />
© 2008 Carnegie Learning, Inc.
Assignment<br />
Assignment for Lesson 1.1<br />
Name ___________________________________________________<br />
Designing a Patio<br />
Patterns and Sequences<br />
Define each term in your own words.<br />
1. sequence<br />
Date _____________________<br />
1<br />
2. term<br />
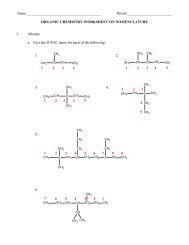
You are creating a tile design for your bathroom floor.<br />
3. What are the next two terms<br />
<strong>of</strong> the sequence in your tile<br />
design? Draw a separate picture<br />
for each term.<br />
Step 1 Step 2 Step 3<br />
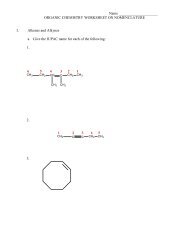
4. Identify the term from your tile<br />
design shown at the right.<br />
Find the next three terms in the sequence. Use complete sentences to explain<br />
how you found your answers.<br />
5. 1, 3, 5, ______ , ______ ,______ , . . .<br />
© 2008 Carnegie Learning, Inc.<br />
6. 1, 0.1, 0.01, _________ , _________ , _________ , . . .<br />
7. 28, 24, 20, ______ , ______ , ______ , . . .<br />
8. 2, 4, 8, ______ , ______ , ______ , . . .<br />
9. Create your own sequence <strong>of</strong> numbers or pictures to challenge your classmates. Write or<br />
draw the first three terms. Then write a sentence describing the pattern.<br />
Chapter 1 ■ Assignments 1
1<br />
© 2008 Carnegie Learning, Inc.<br />
2 Chapter 1 ■ Assignments
Assignment<br />
Assignment for Lesson 1.2<br />
Name ___________________________________________________<br />
Lemonade, Anyone?<br />
Finding the 10th Term <strong>of</strong> a Sequence<br />
The balance in your savings account is $50. You save $5 each week from<br />
your allowance.<br />
Date _____________________<br />
1<br />
1. Complete each statement below to find your savings account balance.<br />
Balance after 1 week: 50 5( ___ ) ______ Balance after 3 weeks: 50 5( ___ ) ______<br />
Balance after 2 weeks: 50 5( ___ ) ______<br />
Balance after 10 weeks: 50 5( ___ ) ______<br />
2. Write the sequence <strong>of</strong> numbers formed by your savings account balance after 1 week,<br />
2 weeks, 3 weeks, and so on.<br />
3. Use a complete sentence to explain what the 10th term <strong>of</strong> the sequence represents.<br />
While watching the news, you learn that a major cold front is moving into your region <strong>of</strong> the<br />
country. The temperature is currently 40ºF, and dropping at a rate <strong>of</strong> 2ºF per hour.<br />
4. Write the sequence <strong>of</strong> numbers that represents the temperature in 1 hour, 2 hours,<br />
3 hours, and so on.<br />
5. What is the 10th term <strong>of</strong> the sequence? Use a complete sentence to explain what the<br />
10th term <strong>of</strong> the sequence represents.<br />
© 2008 Carnegie Learning, Inc.<br />
6. Did you multiply or subtract first when determining the terms <strong>of</strong> the sequence? How<br />
would your sequence change if you reversed the order?<br />
Perform the indicated operations. Show your work.<br />
7. 3 + 4(2) 8. 11 – 2(3) 9. 42 + 3(2)<br />
10. (15 – 3)4 + 2(9) 11. 15 – 3(4) + 2(9) 12. 33 – 5(4 + 1)<br />
Chapter 1 ■ Assignments 3
1<br />
© 2008 Carnegie Learning, Inc.<br />
4 Chapter 1 ■ Assignments
Assignment<br />
Assignment for Lesson 1.3<br />
Name ___________________________________________________<br />
Dinner with the Stars<br />
Finding the nth Term <strong>of</strong> a Sequence<br />
Date _____________________<br />
While your school is planning the charity dinner, you talk to a friend who recently threw a<br />
catered party. She suggests that you hire the caterer she used. Her caterer will serve dinner<br />
for only $18 per person, but there is a one-time fee <strong>of</strong> $25 for renting tablecloths and napkins.<br />
You can represent the total catering cost for different numbers <strong>of</strong> people with the sequence<br />
43, 61, 79, ….<br />
1<br />
1. Find the total catering costs for 4, 5, and 6 people.<br />
Number <strong>of</strong> people 1 2 3 4 5 6<br />
Total catering cost (dollars) 43 61 79<br />
2. What is the total catering cost if 10 people attend the event? Use a complete sentence to<br />
explain your answer.<br />
3. What is the total catering cost if 15 people attend the event? Use a complete sentence to<br />
explain your answer.<br />
4. What algebraic expression can you write to represent the total catering cost in dollars if n<br />
people attend?<br />
© 2008 Carnegie Learning, Inc.<br />
Evaluate each expression for the given value <strong>of</strong> the variable.<br />
5. Evaluate b 7 when b is 13. 6.<br />
p<br />
Evaluate when p is 60.<br />
5<br />
7. Evaluate 2m 4 when m is 3. 8. Evaluate 8 4d when d is 0.<br />
Use the nth term to list the first five terms <strong>of</strong> each sequence. Show your work.<br />
9. a n 2.5n<br />
10. a n 6n 5<br />
Chapter 1 ■ Assignments 5
1<br />
© 2008 Carnegie Learning, Inc.<br />
6 Chapter 1 ■ Assignments
Assignment<br />
Assignment for Lesson 1.4<br />
Name ___________________________________________________<br />
Working for the CIA<br />
Using a Sequence to Represent a Problem Situation<br />
Date _____________________<br />
A group <strong>of</strong> engineers is working on a design for a new car. Each member has a separate task<br />
that relates to the overall design, but it is important for all group members to understand all<br />
parts <strong>of</strong> the project. The final design is due soon, and it is crucial that all the engineers meet<br />
with each other individually to review details before the design is submitted.<br />
1<br />
1. Find the number <strong>of</strong> meetings required for 3 engineers to meet with each other individually.<br />
What is the number <strong>of</strong> meetings required for 4 engineers to meet with each other<br />
individually? What is the number <strong>of</strong> meetings required for 6 engineers to meet<br />
with each other individually?<br />
2. Find the number <strong>of</strong> engineers involved in the project if a total <strong>of</strong> 66 meetings were<br />
required. Use complete sentences to explain how found your answer.<br />
3. Describe another problem scenario that can be represented by the sequence in<br />
Questions 1 and 2.<br />
You are learning about cell division in science class. Suppose a cell divides one time<br />
each minute.<br />
© 2008 Carnegie Learning, Inc.<br />
4. The sequence <strong>of</strong> pictures below represents the cell division over time. Draw the 3rd and<br />
4th terms <strong>of</strong> the sequence.<br />
1 minute 2 minutes<br />
Chapter 1 ■ Assignments 7
1<br />
5. Complete the table below to show the number <strong>of</strong> cells over time.<br />
Time (minutes) 1 2 3 4 5 6 7<br />
Number <strong>of</strong> cells 2 4<br />
6. Write a numerical expression for the number <strong>of</strong> cells in terms <strong>of</strong> the time.<br />
Number <strong>of</strong> cells after 1 minute:<br />
Number <strong>of</strong> cells after 2 minutes:<br />
Number <strong>of</strong> cells after 3 minutes:<br />
2 ______<br />
4 ______<br />
8 ______<br />
7. Write an algebraic expression for the number <strong>of</strong> cells in terms <strong>of</strong> the time t.<br />
Number <strong>of</strong> cells after t minutes: ______<br />
© 2008 Carnegie Learning, Inc.<br />
8 Chapter 1 ■ Assignments
Assignment<br />
Assignment for Lesson 1.5<br />
Name ___________________________________________________<br />
Gauss’s Formula<br />
Finding the Sum <strong>of</strong> a Finite Sequence<br />
Date _____________________<br />
1. Test to see if Gauss’s Formula holds true for the sum <strong>of</strong> an odd number <strong>of</strong> numbers.<br />
1<br />
A gardener expands a small 4-foot by 6-foot garden that currently exists in his backyard.<br />
Each day he increases the length and the width <strong>of</strong> the garden by 2 feet each. He then<br />
wants to buy fence to surround his garden to protect it from rabbits.<br />
Day 0 1 2 3 4 n<br />
Width<br />
Length<br />
Area<br />
Perimeter<br />
2. Fill in the width and length <strong>of</strong> the garden in the chart above to show how the dimensions<br />
change for the first 4 days.<br />
3. Write expressions in the chart for the width and the length <strong>of</strong> the garden in terms <strong>of</strong> the<br />
number <strong>of</strong> days n.<br />
4. Fill in the chart for the area <strong>of</strong> the garden over the first 4 days.<br />
5. Write an expression in the chart for the area <strong>of</strong> the garden in terms <strong>of</strong> the number <strong>of</strong> days n.<br />
© 2008 Carnegie Learning, Inc.<br />
6. Fill in the chart for the perimeter <strong>of</strong> the garden over the first 4 days. (Hint: The formula for<br />
the perimeter <strong>of</strong> a rectangle is P 2l 2w.)<br />
7. Explain why the order <strong>of</strong> operations is important when using the formula for perimeter.<br />
8. Write an expression in the chart for the perimeter <strong>of</strong> the garden in terms <strong>of</strong> the number <strong>of</strong><br />
days n.<br />
9. The gardener has $125 to buy the fence, which costs $1.25 per foot. Use your expression<br />
for the perimeter to find the maximum dimensions <strong>of</strong> the expanded garden.<br />
10. Find the number <strong>of</strong> days it takes the gardener to expand the garden to its maximum size.<br />
Chapter 1 ■ Assignments 9
1<br />
© 2008 Carnegie Learning, Inc.<br />
10 Chapter 1 ■ Assignments
Assignment<br />
Assignment for Lesson 1.6<br />
Name ___________________________________________________<br />
$8 an Hour Problem<br />
Using Multiple Representations, Part 1<br />
Date _____________________<br />
After working at Pat-E-Oh Furniture for 6 months, you receive a raise. Your new pay rate is<br />
$9.50 per hour.<br />
1<br />
1. The table below shows the number <strong>of</strong> hours that you have worked for the first 4 weeks<br />
following your raise. Complete the table.<br />
Quantity Name<br />
Week Time worked Earnings<br />
Unit<br />
hours<br />
Week 1 40<br />
Week 2 4<br />
Week 3 8<br />
Week 4 20<br />
dollars<br />
2. Use the bounds and intervals to label the grid on the next page. Then create a graph <strong>of</strong><br />
the data in the second and third columns <strong>of</strong> the table in Question 1.<br />
Variable quantity Lower bound Upper bound Interval<br />
Time worked 0 60 4<br />
© 2008 Carnegie Learning, Inc.<br />
Earnings 0 450 30<br />
Chapter 1 ■ Assignments 11
1<br />
(label) (units)<br />
(label)<br />
(units)<br />
3. Next week you can work 12 hours. Use the graph to approximate the amount <strong>of</strong> money<br />
that you will earn. Use a complete sentence to explain how you found your answer.<br />
4. Write an expression that you can use to find the earnings for any number <strong>of</strong> hours<br />
worked. Let h represent the number <strong>of</strong> hours worked. Use a complete sentence in<br />
your answer.<br />
5. Use the expression to find the exact amount you would earn in 12 hours. Use a complete<br />
sentence in your answer.<br />
6. Use a complete sentence to explain the difference between an algebraic expression and<br />
an algebraic equation. Show an example <strong>of</strong> each one.<br />
© 2008 Carnegie Learning, Inc.<br />
7. Is m 4 the solution to the equation m 10 14? Why or why not?<br />
12 Chapter 1 ■ Assignments
Assignment<br />
Assignment for Lesson 1.7<br />
Name ___________________________________________________<br />
The Consultant Problem<br />
Using Multiple Representations, Part 2<br />
Complete the conversion.<br />
Date _____________________<br />
1<br />
1. 30 min = _______ hr 2. 150 min = _______ hr 3. 2.75 hr = _______ min<br />
4. 2.3 mi = _______ yd 5. 42 in. = _______ ft 6. 4.2 ft = _______ in.<br />
Write an algebraic equation for each situation. Then identify the dependent and<br />
independent variables.<br />
7. A plumber earns $62 for each hour that she works. Let E represent her earnings in dollars<br />
for h hours <strong>of</strong> work.<br />
8. A marathon runner averages 10 miles per hour. Let m represent the distance in miles run<br />
in h hours.<br />
9. A seamstress can hem 3 skirts each hour. Let s represent the number <strong>of</strong> skirts she hems<br />
in h hours.<br />
10. You earn $12 for each yard you mow. Let E represent your earnings in dollars for mowing<br />
y yards.<br />
© 2008 Carnegie Learning, Inc.<br />
Your aunt was recently hired to work for a large law firm. Over the course <strong>of</strong> her first year,<br />
she will work on several projects. She receives a stipend <strong>of</strong> $3250 for each completed project.<br />
11. What are the two variable quantities in this problem situation?<br />
12. Which variable quantity is the independent variable? Write a sentence explaining<br />
your answer.<br />
13. How much money will your aunt make if she completes 5 projects?<br />
14. How many projects did your aunt complete if she earned $32,500?<br />
Chapter 1 ■ Assignments 13
1<br />
© 2008 Carnegie Learning, Inc.<br />
14 Chapter 1 ■ Assignments
Assignment<br />
Name ___________________________________________________<br />
U.S. Shirts<br />
Using Tables, Graphs, and Equations, Part 1<br />
Define each term in your own words.<br />
1. variable quantity<br />
Assignment for Lesson 1.8<br />
Date _____________________<br />
1<br />
2. constant quantity<br />
Evaluate each algebraic expression for the value given. Show your work.<br />
1<br />
3. 8s 15 when s 20<br />
4. 10 2m when m 4<br />
5. when r 10<br />
2 r 30<br />
You want to save money for college. You have already saved $500, and you are able to save<br />
$75 each week.<br />
6. If you continue to save money at this rate, what will your total savings be in 3 weeks?<br />
What will your total savings be in 10 weeks? What will your total savings be in 6 months?<br />
(Hint: There are four weeks in one month.)<br />
© 2008 Carnegie Learning, Inc.<br />
7. Use a complete sentence to explain how you found the total savings in Question 6.<br />
8. If you continue to save money at this rate, how long will it take you to save $2000?<br />
How long will it take you to save $8000? How long will it take you to save $11,750?<br />
9. Use a complete sentence to explain how you found the answers to the number <strong>of</strong> weeks<br />
in Question 8.<br />
Chapter 1 ■ Assignments 15
1<br />
10. Complete the table using the data from Questions 6 and 8. Be sure to fill in your labels<br />
and units.<br />
Quantity Name<br />
Unit<br />
11. Use the grid below to create a line graph <strong>of</strong> the data from the table in Question 10. First,<br />
choose your bounds and intervals. Be sure to label your graph clearly.<br />
Variable quantity Lower bound Upper bound Interval<br />
Time<br />
Total savings<br />
(label) (units)<br />
© 2008 Carnegie Learning, Inc.<br />
(label)<br />
(units)<br />
16 Chapter 1 ■ Assignments
Name ___________________________________________________<br />
Date _____________________<br />
12. Write an algebraic equation for the problem situation. Use a complete sentence in<br />
your answer.<br />
1<br />
© 2008 Carnegie Learning, Inc.<br />
Chapter 1 ■ Assignments 17
1<br />
© 2008 Carnegie Learning, Inc.<br />
18 Chapter 1 ■ Assignments
Assignment<br />
Assignment for Lesson 1.9<br />
Name ___________________________________________________<br />
Hot Shirts<br />
Using Tables, Graphs, and Equations, Part 2<br />
Estimate the value <strong>of</strong> each expression.<br />
Date _____________________<br />
1<br />
1. 118 22<br />
2. 511 293<br />
3.<br />
299 0.99<br />
4. 5.26 24.74<br />
5. 958.16 239.85<br />
6.<br />
39.78 14.92<br />
7. Give an example from daily life when estimating skills are important.<br />
8. Your cousin thinks <strong>of</strong> a number. He multiplies this starting number by 4 and then adds<br />
12 to get 32. What is the starting number? Use a complete sentence to explain how you<br />
found your answer.<br />
Great Freights, a local shipping company, bases its charges on the weight <strong>of</strong> the items being<br />
shipped. In addition to charging $.40 per pound, they also charge a one-time fee <strong>of</strong> $10 to set<br />
up a customer’s account.<br />
© 2008 Carnegie Learning, Inc.<br />
9. How much does Great Freights charge to ship a package that weighs 20 pounds?<br />
50 pounds?<br />
10. Estimate the weight <strong>of</strong> a package if Great Freights charges the customer $45.<br />
11. Write an algebraic equation for the problem situation. Use a complete sentence in<br />
your answer.<br />
12. Explain why an equation may be the most useful way to represent the problem situation.<br />
Chapter 1 ■ Assignments 19
1<br />
© 2008 Carnegie Learning, Inc.<br />
20 Chapter 1 ■ Assignments
Assignment<br />
Assignment for Lesson 1.10<br />
Name ___________________________________________________<br />
Date _____________________<br />
Comparing U.S. Shirts and Hot Shirts<br />
Comparing Problem Situations Algebraically and Graphically<br />
Two twin brothers, Mike and Mark, are looking for after school jobs. They are both <strong>of</strong>fered jobs<br />
at grocery stores. Mike is <strong>of</strong>fered a job at Fresh Foods making $10 per hour. Mark is <strong>of</strong>fered a<br />
job at Groovy Groceries making $8 an hour, plus a one-time hiring bonus <strong>of</strong> $100. Each twin<br />
believes that he has been <strong>of</strong>fered the better job.<br />
1<br />
1. How much does Mike earn at Fresh Foods if he works 20 hours? 40 hours? 60 hours?<br />
2. Use a complete sentence to explain how you found Mike’s earnings.<br />
3. How much does Mark earn at Groovy Groceries if he works 20 hours? 40 hours?<br />
60 hours?<br />
4. Use a complete sentence to explain how you found Mark’s earnings.<br />
5. Complete the table using the data from the problem and from Questions 1 and 3.<br />
Be sure to fill in your units.<br />
© 2008 Carnegie Learning, Inc.<br />
Quantity Name<br />
Unit<br />
Time worked<br />
Mike’s earnings at<br />
Fresh Foods<br />
Mark’s earnings at<br />
Groovy Groceries<br />
6. Use the grid below to create a graph <strong>of</strong> the data in the table in Question 5. First, choose<br />
your bounds and intervals. Be sure to label your graph clearly.<br />
Variable quantity Lower bound Upper bound Interval<br />
Time worked<br />
Earnings<br />
Chapter 1 ■ Assignments 21
1<br />
(label) (units)<br />
(label)<br />
(units)<br />
7. After how many hours will the twins earn the same amount <strong>of</strong> money? Use complete<br />
sentences to explain how you found your answer.<br />
8. Whose job is better, Mike’s or Mark’s? Use complete sentences to explain your reasoning.<br />
© 2008 Carnegie Learning, Inc.<br />
22 Chapter 1 ■ Assignments
Assignment<br />
Assignment for Lesson 2.1<br />
Name ___________________________________________________<br />
Date _____________________<br />
Left-Handed Learners<br />
Using Samples, Ratios, and Proportions to Make Predictions<br />
Define each term in your own words.<br />
1. ratio<br />
2. proportion<br />
3. sample<br />
2<br />
4. Explain the difference between a ratio and a proportion. Use a complete sentence in<br />
your answer.<br />
Read the scenario below. Use the scenario to answer Questions 5 through 13.<br />
A class <strong>of</strong> 30 Algebra students recently took a test on ratios and proportions. Five students<br />
received As, 10 students received Bs, 6 students received Cs, 4 students received Ds,<br />
4 students failed, and 1 student was absent.<br />
Write each ratio by using division and by using a colon. Be sure to include units in<br />
your ratios.<br />
5. Number <strong>of</strong> students who received As to the total number <strong>of</strong> students<br />
6. Number <strong>of</strong> students who received As to the number <strong>of</strong> students who failed<br />
© 2008 Carnegie Learning, Inc.<br />
7. Number <strong>of</strong> students who passed the test to the number <strong>of</strong> students who failed<br />
8. Number <strong>of</strong> students who were absent to the number <strong>of</strong> students who took the test<br />
Chapter 2 ■ Assignments 23
9. A total <strong>of</strong> 150 students in a school take Algebra. Use a proportion and the results <strong>of</strong> the<br />
sample class to predict the number <strong>of</strong> Algebra students in the school who received As.<br />
Use a complete sentence in your answer.<br />
2<br />
10. A total <strong>of</strong> 20 Algebra students received As. Use a proportion and the results <strong>of</strong> the sample<br />
class to predict the total number <strong>of</strong> students taking Algebra. Use a complete sentence in<br />
your answer.<br />
11. A total <strong>of</strong> 20 Algebra students received Ds. Use a proportion and the results <strong>of</strong><br />
the sample class to predict the total number <strong>of</strong> Algebra students who received Cs.<br />
Use a complete sentence in your answer.<br />
12. What sampling method was used to obtain the sample?<br />
13. Describe a sampling method that you could use to obtain a sample <strong>of</strong> the Algebra<br />
students in your school. Is your method biased? Why or why not? Use complete<br />
sentences in your answer.<br />
© 2008 Carnegie Learning, Inc.<br />
24 Chapter 2 ■ Assignments
Assignment<br />
Assignment for Lesson 2.2<br />
Name ___________________________________________________<br />
Date _____________________<br />
Making Punch<br />
Ratios, Rates, and Mixture Problems<br />
Three local grocery stores compete for the same customers. They all <strong>of</strong>fer savings cards that<br />
claim to save their customers money. The signs below describe each store’s <strong>of</strong>fer.<br />
Stop-N-Shop<br />
Save! Save!<br />
Save!<br />
Buy $80 worth<br />
<strong>of</strong> groceries<br />
and receive $8 <strong>of</strong>f<br />
your next bill!<br />
Food<br />
for Thought<br />
Buy organic<br />
and save!<br />
For every $50 that<br />
you spend, you save<br />
$10 <strong>of</strong>f your next<br />
shopping trip!<br />
Produce<br />
Palace<br />
Stay lean while your<br />
wallet stays fat!<br />
Save $15 <strong>of</strong>f your<br />
next purchase when<br />
you spend $100!<br />
2<br />
1. For each savings card, write a ratio <strong>of</strong> the money saved to the money spent on groceries.<br />
2. For the Stop-N-Shop, how many dollars do you have to spend for every dollar saved?<br />
Show your work and use a complete sentence in your answer.<br />
© 2008 Carnegie Learning, Inc.<br />
3. If you shop at Food for Thought, how many dollars do you have to spend for every dollar<br />
saved? Show your work and use a complete sentence in your answer.<br />
4. If you go to the Produce Palace, how many dollars do you have to spend for every dollar<br />
saved? Show your work and use a complete sentence in your answer.<br />
Chapter 2 ■ Assignments 25
5. How much would you have to spend at Stop-N-Shop to save $40? Show all your work<br />
and use a complete sentence in your answer.<br />
2<br />
6. How much would you save if you spent $300 on groceries at Food for Thought?<br />
Show all your work and use a complete sentence in your answer.<br />
7. How much would you have to spend at Produce Palace to save $120? Show all your work<br />
and use a complete sentence in your answer.<br />
8. Which grocery store <strong>of</strong>fers the best deal? Show all <strong>of</strong> your work and write your answer in<br />
a complete sentence<br />
© 2008 Carnegie Learning, Inc.<br />
26 Chapter 2 ■ Assignments
Assignment<br />
Assignment for Lesson 2.3<br />
Name ___________________________________________________<br />
Date _____________________<br />
Shadows and Proportions<br />
Proportions and Indirect Measurement<br />
The physics and algebra classes at your school are taking part in an annual paper airplane<br />
design competition. Airplanes will be flown from the ro<strong>of</strong> <strong>of</strong> the school, and a prize will be<br />
awarded to the student whose airplane travels furthest from the base <strong>of</strong> the school building.<br />
Before the actual competition, students perform test flights from their classroom windows.<br />
Your teacher uses a yardstick, shadows, and a proportion to estimate that the school building<br />
is 60 feet tall.<br />
2<br />
1. Describe how the teacher could have used shadows and proportions to estimate the<br />
height <strong>of</strong> the school building.<br />
2. During a test flight, Jessica throws her airplane from her classroom’s first-floor window<br />
(10 feet <strong>of</strong>f the ground), and it travels 25 feet. Use a proportion to estimate how far the<br />
airplane will travel when she throws it from the ro<strong>of</strong> <strong>of</strong> the school.<br />
© 2008 Carnegie Learning, Inc.<br />
3. During a test flight, Erica throws her airplane from her classroom’s second-floor window<br />
(20 feet <strong>of</strong>f the ground), and it travels 20 yards. Use a unit rate and a proportion to convert<br />
all units to feet. Then use a proportion to estimate how far the airplane will<br />
travel when she throws it from the ro<strong>of</strong> <strong>of</strong> the school.<br />
Chapter 2 ■ Assignments 27
4. During the actual competition, Andre’s airplane flew 120 feet. Estimate the distance<br />
that his airplane would have flown during a test flight from his classroom’s second-floor<br />
window.<br />
2<br />
5. If Jessica, Erica, and Andre are the finalists in the competition, who should win? Write<br />
an equation that models the distance the winning airplane travels in terms <strong>of</strong> the height<br />
from which it is thrown. Let d represent the distance the airplane travels in feet and let h<br />
represent the height from which it is thrown.<br />
6. Jessica ends up winning the competition. Does this agree with your answer from Question 5?<br />
If not, what factors might account for an incorrect prediction? Use complete sentences in<br />
your answer.<br />
© 2008 Carnegie Learning, Inc.<br />
28 Chapter 2 ■ Assignments
Assignment<br />
Assignment for Lesson 2.4<br />
Name ___________________________________________________<br />
Date _____________________<br />
TV News Ratings<br />
Ratios and Part-to-Whole Relationships<br />
The new superintendent <strong>of</strong> a local school district states that her main objective is to increase<br />
the students’ math scores. One initiative to help achieve this goal is to increase the number <strong>of</strong><br />
students that attend an after-school tutoring program. By the end <strong>of</strong> the semester, she would<br />
like to have three out <strong>of</strong> every five students attending the program.<br />
1. In order to meet the goal, how many students must attend the tutoring program if the<br />
school enrollment is 200? How many students must attend the tutoring program if the<br />
school enrollment is 400? How many students must attend the tutoring program if the<br />
school enrollment is 800?<br />
2<br />
2. Describe how you found your answers to Question 1.<br />
3. One <strong>of</strong> the elementary schools met their goal when 30 students attended the tutoring<br />
program. What is the school’s enrollment?<br />
4. One <strong>of</strong> the middle schools has 400 students enrolled. If 230 students attended the tutoring<br />
program at the end <strong>of</strong> the semester, did they meet their goal? Explain your reasoning.<br />
© 2008 Carnegie Learning, Inc.<br />
5. Let s represent the number <strong>of</strong> students enrolled and let t represent the number <strong>of</strong> students<br />
who attend the tutoring program. Write an equation for t in terms <strong>of</strong> s.<br />
6. One <strong>of</strong> the high schools has 500 students enrolled and 275 students attending the tutoring<br />
program. A second high school has 740 students enrolled and 333 students attending<br />
the tutoring program. Has either high school met the goal? If not, which school is closer<br />
to meeting the goal? Use complete sentences to explain your reasoning.<br />
Chapter 2 ■ Assignments 29
2<br />
© 2008 Carnegie Learning, Inc.<br />
30 Chapter 2 ■ Assignments
Assignment<br />
Assignment for Lesson 2.5<br />
Name ___________________________________________________<br />
Date _____________________<br />
Women at a University<br />
Ratios, Part-to-Part Relationships, and Direct Variation<br />
1. Define direct variation in your own words. Use an example in your definition.<br />
Solve each proportion using the means and extremes. Round to the nearest hundrendth,<br />
if necessary.<br />
2<br />
5<br />
x<br />
2. 3. 4.<br />
7 5 9 x<br />
22<br />
11<br />
0.32<br />
x<br />
1 3<br />
In a college calculus class <strong>of</strong> 30 students, 6 are pre-med majors, 8 are engineering majors,<br />
5 are mathematics majors, 4 are business majors, and the rest are undecided.<br />
Write each part-to-part ratio.<br />
5. Pre-med majors to mathematics majors<br />
6. Mathematics majors to undecided students<br />
7. Engineering majors to non-engineering majors<br />
According to a recent survey, 9 out <strong>of</strong> 10 parents agree with a plan to remove vending<br />
machines that sell soda and sugary snacks from the local schools.<br />
© 2008 Carnegie Learning, Inc.<br />
8. What is the ratio <strong>of</strong> the number <strong>of</strong> parents<br />
who agree to the number <strong>of</strong> parents who<br />
disagree?<br />
9. Let a represent the number <strong>of</strong> parents<br />
who agree and let d represent the number<br />
<strong>of</strong> parents who disagree. Write an<br />
equation for a in terms <strong>of</strong> d.<br />
Quantity Name<br />
Unit<br />
Expression<br />
Number who<br />
disagree<br />
parents<br />
d<br />
50<br />
Number who<br />
agree<br />
parents<br />
9<br />
810<br />
400<br />
10. Complete the table <strong>of</strong> values at the right that<br />
represents the problem situation.<br />
Chapter 2 ■ Assignments 31
11. Use the grid below to create a graph <strong>of</strong> the data from the table in Question 10.<br />
First, choose your bounds and intervals. Be sure to label your graph clearly.<br />
Variable quantity Lower bound Upper bound Interval<br />
Number <strong>of</strong> parents<br />
who disagree<br />
Number <strong>of</strong> parents<br />
who agree<br />
2<br />
(label) (units)<br />
(label)<br />
(units)<br />
12. Explain why the equation in Question 9 is a direct variation.<br />
© 2008 Carnegie Learning, Inc.<br />
32 Chapter 2 ■ Assignments
Assignment<br />
Assignment for Lesson 2.6<br />
Name ___________________________________________________<br />
Date _____________________<br />
Tipping in a Restaurant<br />
Using Percents<br />
Approximately 76% <strong>of</strong> ninth graders in the Pittsburgh Public <strong>School</strong>s will graduate from<br />
high school in four years.<br />
1. How many students will graduate if the number <strong>of</strong> students starting in the ninth grade<br />
is 8000? How many students will graduate if the number <strong>of</strong> students starting in the ninth<br />
grade is 10,000? How many students will graduate if the number <strong>of</strong> students starting in<br />
the ninth grade is 12,000?<br />
2<br />
2. Describe how proportions were used to solve Question 1. Use complete sentences in<br />
your answer.<br />
3. How many students started in ninth grade if the number <strong>of</strong> graduates is 25,000?<br />
How many students started in ninth grade if the number <strong>of</strong> graduates is 27,500?<br />
How many students started in ninth grade if the number <strong>of</strong> graduates is 30,000?<br />
© 2008 Carnegie Learning, Inc.<br />
4. Describe how proportions were used to solve Question 3. Use complete sentences in<br />
your answer.<br />
5. Write an equation that can be used to calculate the number <strong>of</strong> students who will graduate.<br />
Let x be the number <strong>of</strong> ninth graders and y be the number <strong>of</strong> graduates.<br />
Chapter 2 ■ Assignments 33
6. Complete the table <strong>of</strong> values that represents the problem situation.<br />
Quantity Name<br />
Unit<br />
Expression<br />
Number <strong>of</strong> ninth graders<br />
students<br />
x<br />
8,000<br />
10,000<br />
Number <strong>of</strong> graduates<br />
students<br />
2<br />
12,000<br />
7. Use the grid below to create a graph <strong>of</strong> the data in the table in Question 6. First, choose<br />
your bounds and intervals. Be sure to label your graph clearly.<br />
Variable quantity Lower bound Upper bound Interval<br />
Number <strong>of</strong> ninth graders<br />
Number <strong>of</strong> graduates<br />
(label) (units)<br />
© 2008 Carnegie Learning, Inc.<br />
(label)<br />
(units)<br />
8. Use your graph in Question 7 to estimate the number <strong>of</strong> graduates if the number <strong>of</strong><br />
students starting in ninth grade is 7500.<br />
34 Chapter 2 ■ Assignments
Assignment<br />
Assignment for Lesson 2.7<br />
Name ___________________________________________________<br />
Date _____________________<br />
Taxes Deducted From Your Paycheck<br />
Percents and Taxes<br />
When purchasing an item at a store, a sales tax is generally added to the price <strong>of</strong> the item.<br />
This sales tax varies from state to state, but generally the price is increased by 4 to 7 percent.<br />
For this problem situation, assume that the sales tax rate is 6%.<br />
1. How much sales tax will be added to an item that costs $50? How much sales tax will<br />
be added to an item that costs $75? How much sales tax will be added to an item that<br />
costs $100?<br />
2<br />
2. Explain how you can use a proportion to solve Question 1. Use complete sentences in<br />
your answer.<br />
3. What is the price <strong>of</strong> an item if the sales tax is $.60? What is the price <strong>of</strong> an item if the<br />
sales tax is $1.20? What is the price <strong>of</strong> an item if the sales tax is $4.80?<br />
4. Explain how you can use a proportion to solve Question 3. Use complete sentences in<br />
your answer.<br />
© 2008 Carnegie Learning, Inc.<br />
5. Write an equation that can be used to calculate the sales tax that will be added to the<br />
price <strong>of</strong> an item. Let x be the cost <strong>of</strong> the item and y be the amount <strong>of</strong> sales tax paid.<br />
Chapter 2 ■ Assignments 35
6. Complete the table <strong>of</strong> values that describes the relationship between the cost <strong>of</strong> an item<br />
and the amount paid in sales tax.<br />
Quantity Name<br />
Unit<br />
Expression<br />
Cost <strong>of</strong> item<br />
dollars<br />
x<br />
Amount <strong>of</strong> sales tax<br />
dollars<br />
2<br />
1.50<br />
25<br />
2.70<br />
3.30<br />
7. What is the total cost after sales tax if the cost <strong>of</strong> an item is $120? What is the total cost<br />
after sales tax if the cost <strong>of</strong> an item is $200? What is the total cost after sales tax if the<br />
cost <strong>of</strong> an item is $300?<br />
8. Describe how you found your answers in Question 7. Use a complete sentence in<br />
your answer.<br />
9. Write an equation that can be used to calculate the total cost after sales tax. Let x be the<br />
cost <strong>of</strong> an item and y be the total cost after sales tax.<br />
© 2008 Carnegie Learning, Inc.<br />
36 Chapter 2 ■ Assignments
Assignment<br />
Assignment for Lesson 3.1<br />
Name ___________________________________________________<br />
Date _____________________<br />
Collecting Road Tolls<br />
Solving One-Step Equations<br />
Solve each one-step equation algebraically. Use mental math to check<br />
your answer.<br />
x<br />
1. 2x 46<br />
2. 3.<br />
4 10<br />
3x 21<br />
4. x 5 32<br />
5. x 7 13<br />
6.<br />
4 x 11<br />
3<br />
You start working part-time after school at a local grocery store. You earn $7.50 per hour.<br />
7. How much money will you earn if you work 1 hour? How much money will you earn if you<br />
work 2 hours? How much money will you earn if you work 4 hours? How much money will<br />
you earn if you work 5.5 hours?<br />
8. Use complete sentences to explain how you found your answers in Question 7.<br />
© 2008 Carnegie Learning, Inc.<br />
9. Let h represent the number <strong>of</strong> hours worked. Write an algebraic expression that<br />
represents the amount <strong>of</strong> money earned.<br />
10. Write and solve an equation that can be used to find the number <strong>of</strong> hours you must work<br />
to earn $105. Use a complete sentence in your answer.<br />
11. For this problem situation, what are the independent and dependent variables?<br />
Chapter 3 ■ Assignments 37
3<br />
© 2008 Carnegie Learning, Inc.<br />
38 Chapter 3 ■ Assignments
Assignment<br />
Assignment for Lesson 3.2<br />
Name ___________________________________________________<br />
Date _____________________<br />
Decorating the Math Lab<br />
Solving Two-Step Equations<br />
Solve each equation algebraically.<br />
x<br />
1. 3x 1 14<br />
2. 4x 2 22<br />
3.<br />
3 4 5<br />
x<br />
4. 1 2x 5 5. 10 2x 4<br />
6.<br />
2 3 5<br />
Your school district is considering a plan to rent rather than buy a new server for its computer<br />
network. A server rents for $2.50 per day with a $25 fee for insurance.<br />
3<br />
7. What is the total cost <strong>of</strong> renting a server for 30 days? What is the total cost <strong>of</strong> renting a<br />
server for 180 days? What is the total cost <strong>of</strong> renting a server for 360 days?<br />
8. Use complete sentences to explain how you found your answers in Question 7.<br />
© 2008 Carnegie Learning, Inc.<br />
9. Let d represent the time rented in days. Write an algebraic expression that represents the<br />
total cost <strong>of</strong> renting a server.<br />
10. Write and solve an equation to find the number <strong>of</strong> days for which the school district can<br />
rent a server for $250? Use a complete sentence in your answer.<br />
11. What inverse operations did you use to solve your equation in Question 10?<br />
Chapter 3 ■ Assignments 39
12. Write and solve an equation to find the number <strong>of</strong> days for which the school district can<br />
rent a server for $587.50. Use a complete sentence in your answer.<br />
13. During a school board meeting, the technology coordinator for the district states that it<br />
would cost $102.50 to rent a server for the month <strong>of</strong> February. Algebraically, determine if<br />
the technology coordinator’s statement is true. Use a complete sentence in your answer.<br />
3<br />
14. Complete the table <strong>of</strong> values that shows the relationship between the time rented in days<br />
and the total cost.<br />
Quantity Name<br />
Unit<br />
Time<br />
days<br />
Total cost<br />
dollars<br />
Expression<br />
d 2.5d 25<br />
30<br />
180<br />
360<br />
250<br />
587.5<br />
© 2008 Carnegie Learning, Inc.<br />
40 Chapter 3 ■ Assignments
Name ___________________________________________________<br />
Date _____________________<br />
15. Create a graph <strong>of</strong> the data from the table to show the relationship between time and<br />
total cost. First, choose your bounds and intervals. Be sure to label your graph clearly.<br />
Variable quantity Lower bound Upper bound Interval<br />
Time<br />
Total cost<br />
(label) (units)<br />
3<br />
(label)<br />
(units)<br />
© 2008 Carnegie Learning, Inc.<br />
16. It costs about $1850 to buy a new server. If the school district must get a new server<br />
every 2 years, how does the cost <strong>of</strong> buying a new server compare to the cost <strong>of</strong> renting<br />
one? Use the graph to determine the cost <strong>of</strong> renting a server for 2 years.<br />
17. Do you think the school district should buy or rent the new server? Use complete<br />
sentences to explain your reasoning.<br />
Chapter 3 ■ Assignments 41
3<br />
© 2008 Carnegie Learning, Inc.<br />
42 Chapter 3 ■ Assignments
Assignment<br />
Assignment for Lesson 3.3<br />
Name ___________________________________________________<br />
Date _____________________<br />
Earning Sales Commission<br />
Using the Percent Equation<br />
Write and solve a percent equation to answer each question. Use a complete<br />
sentence in your answer.<br />
1. What is 45% <strong>of</strong> 400? 2. 7 is 7% <strong>of</strong> what number?<br />
3. Define commission in your own words.<br />
3<br />
A television salesperson is paid $150 per week, plus a commission <strong>of</strong> 5% on his total sales<br />
for the week.<br />
4. How much money will the salesperson earn if his total sales for the week are $500?<br />
How much money will the salesperson earn if his total sales for the week are $800?<br />
How much money will the salesperson earn if his total sales for the week are $1000?<br />
5. Describe how you found your answers in Question 4. Use complete sentences in<br />
your answer.<br />
© 2008 Carnegie Learning, Inc.<br />
6. Let s represent the salesperson’s total sales for a week and let E represent his earnings.<br />
Write an equation for E in terms <strong>of</strong> s.<br />
7. Use your equation to find the salesperson’s total sales for the week if his earnings are<br />
$300. Show all your work and use a complete sentence in your answer.<br />
Chapter 3 ■ Assignments 43
8. Complete the table <strong>of</strong> values that represents the relationship between the salesperson’s<br />
earnings and his total sales for a week.<br />
Quantity Name<br />
Unit<br />
Expression<br />
Total sales<br />
dollars<br />
s<br />
500<br />
800<br />
1000<br />
Earnings<br />
dollars<br />
300<br />
9. Create a graph <strong>of</strong> the data from the table to show the relationship between total sales and<br />
earnings. First, choose your bounds and intervals. Be sure to label your graph clearly.<br />
3<br />
Variable quantity Lower bound Upper bound Interval<br />
Total sales<br />
Earnings<br />
(label) (units)<br />
© 2008 Carnegie Learning, Inc.<br />
(label)<br />
(units)<br />
44 Chapter 3 ■ Assignments
Assignment<br />
Assignment for Lesson 3.4<br />
Name ___________________________________________________<br />
Date _____________________<br />
Cellular Phone Plans from Easy Cell,<br />
Emerge-a-Cell, and Safety Cell<br />
Using Two-Step Equations, Part 1<br />
You would like to have a cellular phone to use in just case <strong>of</strong> an emergency, so you compare<br />
three pay-as-you-go cellular phone plans. Easy Cell charges a monthly access fee <strong>of</strong> $5.99<br />
and $.49 per minute for airtime. Emerge-A-Cell charges a monthly access fee <strong>of</strong> $9.99 and<br />
$.29 per minute for airtime. Safety Cell charges $7.99 for monthly access and $.45 per minute<br />
for airtime.<br />
1. Determine the cost for the first month for each plan if you use 20 minutes <strong>of</strong> airtime.<br />
Show your work and use complete sentences in your answer.<br />
2. Use complete sentences to explain how you determined the cost for each plan in<br />
Question 1.<br />
3<br />
3. Let t represent the total cost <strong>of</strong> your first month’s cellular phone use in dollars and let m<br />
represent the number <strong>of</strong> airtime minutes used. Write an equation that gives the total cost<br />
in terms <strong>of</strong> the number <strong>of</strong> airtime minutes used for each <strong>of</strong> the three cellular phone plans.<br />
© 2008 Carnegie Learning, Inc.<br />
4. Complete the table <strong>of</strong> values that shows the relationship between the total cost and the<br />
number <strong>of</strong> airtime minutes used.<br />
Quantity Name<br />
Unit<br />
Expression<br />
Easy Cell Emerge-A-Cell Safety Cell<br />
Airtime used Total cost Total cost Total cost<br />
minutes dollars dollars dollars<br />
m<br />
0<br />
10<br />
20<br />
45<br />
50<br />
Chapter 3 ■ Assignments 45
5. Create graphs <strong>of</strong> all three situations to show the relationship between the airtime used and<br />
the total cost. First, choose your bounds and intervals. Be sure to label your graphs clearly.<br />
Variable quantity Lower bound Upper bound Interval<br />
Airtime used 0 60 4<br />
Total cost 0 45 3<br />
3<br />
(label) (units)<br />
(label)<br />
(units)<br />
6. Compare the three cellular phone plans. Identify which plan will cost the least and for<br />
which number <strong>of</strong> airtime minutes. Will the cost ever be the same for all three companies?<br />
If so, for which number <strong>of</strong> airtime minutes? Use complete sentences in your answer.<br />
© 2008 Carnegie Learning, Inc.<br />
46 Chapter 3 ■ Assignments
Assignment<br />
Assignment for Lesson 3.5<br />
Name ___________________________________________________<br />
Date _____________________<br />
Plastic Containers<br />
Using Two-Step Equations, Part 2<br />
At the start <strong>of</strong> a new season, three football players decide to compete to see who will reach<br />
10,000 career rushing yards first. The first player currently has 3500 yards and averages 120<br />
yards per game. The second player currently has 4075 yards and averages 95 yards per game.<br />
The third player currently has 5575 yards and averages 80 yards per game. Assume that there<br />
are 16 games in one season.<br />
1. If each player gains yards at his current average, how many yards will each have at the<br />
end <strong>of</strong> the season? Show your work and use complete sentences in your answer.<br />
2. Use complete sentences to explain how you determined the yards for each player in<br />
Question 1.<br />
3<br />
3. Let t represent the total rushing yards and let g represent the number <strong>of</strong> games played.<br />
Write an equation that gives the total rushing yards in terms <strong>of</strong> the number <strong>of</strong> games<br />
played for each <strong>of</strong> the three players.<br />
4. Complete the table <strong>of</strong> values that shows the relationship between the total rushing yards<br />
and the number <strong>of</strong> games played.<br />
© 2008 Carnegie Learning, Inc.<br />
Quantity Name<br />
Unit<br />
Expression<br />
First player Second player Third player<br />
Games played Total yards Total yards Total yards<br />
games yards yards yards<br />
g<br />
0<br />
16<br />
23<br />
40<br />
60<br />
Chapter 3 ■ Assignments 47
5. Create graphs for all three players to show the relationship between games played and total cost.<br />
First, choose your bounds and intervals. Be sure to label your graphs clearly.<br />
Variable quantity Lower bound Upper bound Interval<br />
Games played 0 75 5<br />
Total yards 0 15,000 1000<br />
3<br />
(label) (units)<br />
(label)<br />
(units)<br />
6. Use the graph to estimate after how many games each player will reach 10,000 total yards.<br />
7. Check your estimate for each player in Question 6 using algebraic equations to find after how<br />
many games each player will reach 10,000 yards. Use complete sentences in your answer.<br />
© 2008 Carnegie Learning, Inc.<br />
8. Do you think using each player’s current average yards per game is a good predictor for<br />
determining who will reach the 10,000-yard goal first? Why or why not?<br />
48 Chapter 3 ■ Assignments
Assignment<br />
Assignment for Lesson 3.6<br />
Name ___________________________________________________<br />
Date _____________________<br />
Brrr! It’s Cold Out There!<br />
Integers and Integer Operations<br />
Perform each indicated operation.<br />
1. –2 + 5 2. –3 + (–2) 3. 6 + (–8)<br />
4. 8 – 10 5. –3 – (–5) 6. –8 – 2<br />
7. 7(–2) 8. (–3)(–7) 9. (–5) 2<br />
10. –24 ÷ (–3) 11. 64 ÷ (–2) 12. –22 ÷ 11<br />
The equation given in the text that relates a temperature C in degrees Celsius to a temperature<br />
3<br />
F in degrees Fahrenheit is F 9 . By solving for C, another equation that relates these<br />
5 C 32<br />
two variable quantities is C 5 .<br />
9 F 160<br />
9<br />
13. Use the second equation above to find the temperature in degrees Celsius that<br />
corresponds to a temperature <strong>of</strong> –4ºF. Show all your work and use a complete sentence<br />
in your answer.<br />
© 2008 Carnegie Learning, Inc.<br />
14. Use the second equation above to find the temperature in degrees Fahrenheit that<br />
corresponds to a temperature <strong>of</strong> –15ºC. Show all your work and use a complete sentence<br />
in your answer.<br />
15. Write the second temperature equation above so that the fractions are decimals.<br />
16. Which temperature equation is easier to use? Use complete sentences to explain<br />
your answer.<br />
Chapter 3 ■ Assignments 49
3<br />
© 2008 Carnegie Learning, Inc.<br />
50 Chapter 3 ■ Assignments
Assignment<br />
Assignment for Lesson 3.7<br />
Name ___________________________________________________<br />
Date _____________________<br />
Shipwreck at the Bottom <strong>of</strong> the Sea<br />
The Coordinate Plane<br />
Define each term in your own words.<br />
1. origin<br />
2. x-axis<br />
3. y-axis<br />
4. ordered pair<br />
5. x-coordinate<br />
6. y-coordinate<br />
7. Plot and label each point in the coordinate plane.<br />
3<br />
A(2, –6)<br />
B(0, –4)<br />
C(–4, 0)<br />
D(2, 0)<br />
E(2, 6)<br />
F(–4, 6)<br />
G(–4, –6)<br />
y<br />
8<br />
7<br />
6<br />
5<br />
4<br />
3<br />
2<br />
© 2008 Carnegie Learning, Inc.<br />
1<br />
−8 −7 −6 −5 −4 −3 −2 −1 O 1 2 3 4 5 6 7 8<br />
−1<br />
−2<br />
−3<br />
−4<br />
−5<br />
−6<br />
x<br />
−7<br />
−8<br />
8. What letter is formed when you connect the points you plotted in Question 7 in<br />
alphabetical order?<br />
Chapter 3 ■ Assignments 51
3<br />
© 2008 Carnegie Learning, Inc.<br />
52 Chapter 3 ■ Assignments
Assignment<br />
Assignment for Lesson 3.8<br />
Name ___________________________________________________<br />
Date _____________________<br />
Engineering a Highway<br />
Using a Graph <strong>of</strong> a Two-Step Equation<br />
You are knitting a scarf for your best friend and want to have it finished by 6:00 P.M. You want<br />
the scarf to be 60 inches long when it is complete. At 1:00 P.M. you have already knit 15 inches<br />
1<br />
<strong>of</strong> the scarf, and you estimate that from this point on you can knit at the rate <strong>of</strong> 4 inch per<br />
minute.<br />
1. Write an equation that represents the length <strong>of</strong> the scarf, in inches, in terms <strong>of</strong> the number<br />
<strong>of</strong> minutes.<br />
2. Find the length <strong>of</strong> the scarf at 2:30 P.M. and at 3:20 P.M. Show all your work and use a<br />
complete sentence in your answer.<br />
3<br />
3. What time will it be when you complete the scarf? Show all your work and use a complete<br />
sentence in your answer.<br />
© 2008 Carnegie Learning, Inc.<br />
4. Assuming you knit at a constant rate, at what time did you begin knitting the scarf?<br />
Show all your work and use a complete sentence in your answer.<br />
Chapter 3 ■ Assignments 53
5. Complete the table <strong>of</strong> values that shows the relationship between the number <strong>of</strong> minutes<br />
and the length <strong>of</strong> the scarf in inches.<br />
Quantity Name<br />
Unit<br />
Expression<br />
Time since 1:00 P.M.<br />
minutes<br />
m<br />
Scarf length<br />
inches<br />
0<br />
90<br />
140<br />
180<br />
3<br />
6. Create a graph <strong>of</strong> the data from the table to show the relationship between minutes since<br />
1:00 P.M. and the length <strong>of</strong> the scarf. First, choose your bounds and intervals. Be sure to<br />
label your graph clearly.<br />
Variable quantity Lower bound Upper bound Interval<br />
Time since 1:00 P.M.<br />
Scarf length<br />
(label) (units)<br />
© 2008 Carnegie Learning, Inc.<br />
(label)<br />
(units)<br />
54 Chapter 3 ■ Assignments
Name ___________________________________________________<br />
Date _____________________<br />
7. Use the graph in Question 6 to estimate the length <strong>of</strong> the scarf at 3:30 P.M.<br />
Use a complete sentence in your answer.<br />
8. Use the graph in Question 6 to estimate what time it will be when the scarf is<br />
25 inches long. Use a complete sentence in your answer.<br />
Solve each equation.<br />
2<br />
3<br />
9. x 100 1100<br />
10. 11. 12 2 5 4 x 2 10<br />
3 x 2<br />
3<br />
© 2008 Carnegie Learning, Inc.<br />
Chapter 3 ■ Assignments 55
3<br />
© 2008 Carnegie Learning, Inc.<br />
56 Chapter 3 ■ Assignments
Assignment<br />
Assignment for Lesson 4.1<br />
Name ___________________________________________________<br />
Date _____________________<br />
Up, Up, and Away!<br />
Solving and Graphing Inequalities in One Variable<br />
A big Algebra test is coming up, and you are worried about how it will affect your grade.<br />
It will have 40 multiple-choice questions and you would like to know how many questions<br />
you will need to answer correctly in order to receive each grade. (For a review <strong>of</strong> percents,<br />
see Chapter 2.).<br />
1. What is the number <strong>of</strong> questions will you need to answer correctly in order to receive<br />
a 90%? What is the number <strong>of</strong> questions will you need to answer correctly in order to<br />
receive an 80%? What is the number <strong>of</strong> questions will you need to answer correctly in<br />
order to receive a 70%? What is the number <strong>of</strong> questions will you need to answer<br />
correctly in order to receive a 60%?<br />
2. Let x represent the number <strong>of</strong> questions answered correctly. Write inequalities for<br />
the number <strong>of</strong> questions that you need to answer correctly in order to receive an<br />
A (90%–100%), a B (80%–89%), a C (70%–79%), a D (60%–69%), or an F (0%–59%).<br />
3. Which letter grades are represented by a compound inequality?<br />
4<br />
© 2008 Carnegie Learning, Inc.<br />
4. Students in one particular class did poorly on the test, so the teacher allowed<br />
the students to take the tests home and correct them in order to earn more points.<br />
If a student answered 20 questions correctly the first time, what number <strong>of</strong> additional<br />
questions will she need to answer correctly in order to raise her grade to at least a C?<br />
Let q represent the number <strong>of</strong> corrected problems. Show all your work and use a<br />
complete sentence in your answer.<br />
Chapter 4 ■ Assignments 57
Solve each inequality and graph the solution.<br />
5. x 3 7<br />
6. 2x ≤10<br />
7 8 9 10 11 12 13 −8 −7 −6 −5 −4 −3 −2<br />
7. 3x 2 ≥ 11 8.<br />
1<br />
x 10 24<br />
5<br />
−6 −5 −4 −3 −2 −1 0 40 50 60 70 80 90 100<br />
4<br />
© 2008 Carnegie Learning, Inc.<br />
58 Chapter 4 ■ Assignments
Assignment<br />
Assignment for Lesson 4.2<br />
Name ___________________________________________________<br />
Date _____________________<br />
Moving a Sand Pile<br />
Relations and Functions<br />
Define each term in your own words.<br />
1. domain<br />
2. range<br />
3. function<br />
Decide whether each relation is a function. If the relation is a function,<br />
identify the domain and range. If the relation is not a function, explain<br />
why not. Use complete sentences in your answer.<br />
4. Relation: {(2, 5), (3, 7), (–1, –1), (5, 11)}<br />
5. Relation: {(1, 1), (2, 1), (3, 2), (3, 3)}<br />
Identify the input and output for each scenario and decide whether or not it<br />
represents a function. Use complete sentences to explain your answer.<br />
6. Each student in your class identifies his or her birthday.<br />
4<br />
© 2008 Carnegie Learning, Inc.<br />
7. Each student in your class identifies his or her phone number.<br />
8. At a family reunion, each person writes down his or her home address to create a<br />
family directory.<br />
Chapter 4 ■ Assignments 59
4<br />
© 2008 Carnegie Learning, Inc.<br />
60 Chapter 4 ■ Assignments
Assignment<br />
Assignment for Lesson 4.3<br />
Name ___________________________________________________<br />
Date _____________________<br />
Let’s Bowl!<br />
Evaluating Functions, Function Notation, Domain, and Range<br />
1. What is the difference between a relation and a function?<br />
2. How do you evaluate a function?<br />
Evaluate each function at the specified value. Show your work.<br />
3. f(x) 3 x at x 5<br />
4. f(x) 2x 15 at x 7 5.<br />
f(x) 4 3x at x 1<br />
You and your friends from Algebra class have volunteered to tutor fifth grade students at<br />
the neighborhood elementary school after school. You would like to provide a snack for the<br />
fifth graders during tutoring time. You know that you will have to spend $6.50 on napkins<br />
and plates. You will be able to buy pretzels and juice at a rate <strong>of</strong> $.40 per student.<br />
6. Find the total cost <strong>of</strong> providing snacks if 10 fifth graders come to tutoring.<br />
Show your work and use a complete sentence in your answer.<br />
4<br />
© 2008 Carnegie Learning, Inc.<br />
7. Find the total cost <strong>of</strong> providing snacks if 15 fifth graders come to tutoring.<br />
Show your work and use a complete sentence in your answer.<br />
8. Use function notation to write an equation representing the total cost <strong>of</strong> providing snacks<br />
for any number <strong>of</strong> students.<br />
Chapter 4 ■ Assignments 61
9. Use complete sentences to explain how to evaluate the function for any number<br />
<strong>of</strong> students.<br />
10. What is the domain <strong>of</strong> the function in Question 8 if you do not consider the problem<br />
situation? Use a complete sentence in your answer.<br />
11. Suppose there are 65 fifth-grade students at the neighborhood elementary school. What is<br />
the domain <strong>of</strong> the function in Question 8 now? Use a complete sentence in your answer.<br />
12. Suppose there are only enough tutors for 12 fifth graders to attend tutoring. What is<br />
the domain and range <strong>of</strong> the function in Question 8 now? Use complete sentences<br />
in your answer.<br />
4<br />
© 2008 Carnegie Learning, Inc.<br />
62 Chapter 4 ■ Assignments
Assignment<br />
Assignment for Lesson 4.4<br />
Name ___________________________________________________<br />
Date _____________________<br />
Math Magic<br />
The Distributive Property<br />
Use the distributive property to simplify each algebraic expression.<br />
1. 4(x 3)<br />
2. 8(3x 4)<br />
3.<br />
10x 15x<br />
36 24x<br />
4. 5(9 2x)<br />
5. 6.<br />
6<br />
56 7x<br />
7<br />
Use the distributive property in reverse to rewrite each algebraic expression.<br />
7. 5x 80<br />
8. 7x 28<br />
9.<br />
4x 18<br />
10. 28x 49<br />
11. 5 15x<br />
12.<br />
4x 7<br />
4<br />
© 2008 Carnegie Learning, Inc.<br />
You and two <strong>of</strong> your friends have decided to start your own company assembling and selling<br />
computers. Suppose that you have already sold the first 20 computers that you assembled<br />
for $1800 each. You will then sell each additional computer that you assemble for $1800.<br />
13. What will your company’s total sales be if you sell 10 additional computers? What will<br />
your company’s total sales be if you sell 50 additional computers? What will your<br />
company’s total sales be if you sell 100 additional computers? What will your company’s<br />
total sales be if you sell 200 additional computers?<br />
Chapter 4 ■ Assignments 63
14. Write an expression that can be used to calculate your company’s total sales. Write your<br />
expression in factored form and in simplified form using the distributive property.<br />
15. Write two expressions for the total area <strong>of</strong> the two rectangular<br />
sections <strong>of</strong> garden. Then find the total area. Show all your work.<br />
9 ft<br />
12 ft 3 ft<br />
4<br />
© 2008 Carnegie Learning, Inc.<br />
64 Chapter 4 ■ Assignments
Assignment<br />
Assignment for Lesson 4.5<br />
Name ___________________________________________________<br />
Date _____________________<br />
Numbers in Your Everyday Life<br />
Real Numbers and Their Properties<br />
Define each term in your own words.<br />
1. closure<br />
2. rational number<br />
3. irrational number<br />
Determine whether each decimal value is rational or irrational number. If it is a<br />
rational number, write it as a fraction.<br />
4. 0.5 5. 0.5555... 6. 0.151155111555...<br />
7. 0.1 8. 0.152542384... 9. 0.151515...<br />
Identify the property illustrated by each statement.<br />
4<br />
© 2008 Carnegie Learning, Inc.<br />
10. 2 2<br />
11. 3(7) 7(3)<br />
1<br />
12. (4 7) (2) 4 (7 (2)) 1<br />
13. If and 0.2 20% , then .<br />
5 0.2<br />
5 20%<br />
14. Identify the property or reason that is used in each step.<br />
3(5 1) 4 5(2 8) 44 _______________________________________________________<br />
15 3 4 5(2 8) 44 _______________________________________________________<br />
15 3 4 10 40 44 _______________________________________________________<br />
(15 3) 4 (10 40) 44 _______________________________________________________<br />
18 4 30 44 _______________________________________________________<br />
14 14<br />
_______________________________________________________<br />
Chapter 4 ■ Assignments 65
4<br />
© 2008 Carnegie Learning, Inc.<br />
66 Chapter 4 ■ Assignments
Assignment<br />
Assignment for Lesson 4.6<br />
Name ___________________________________________________<br />
Date _____________________<br />
Technology Reporter<br />
Solving More Complicated Equations<br />
Solve each equation. Show all your work. Be sure to check your answer in the<br />
original equation.<br />
1. 3x 2x 5<br />
2. 3x 2 2x 4<br />
3.<br />
2x 1 3(x 2)<br />
4. 5x 1 7(x 1)<br />
5. x 4 3x 8<br />
6.<br />
2(10 3x) 4(x 4)<br />
As a member <strong>of</strong> the local teen community group, you and your friends take on the responsibility<br />
to analyze the most economical option for flooring for the new center. After all the bids are<br />
collected, the two most promising bids are for vinyl flooring and carpeting. The vinyl flooring<br />
costs $31,000 to install, along with a monthly cleaning and maintenance fee <strong>of</strong> $175. The<br />
carpeting costs $22,500 to install along with a monthly cleaning and maintenance fee <strong>of</strong> $325.<br />
4<br />
© 2008 Carnegie Learning, Inc.<br />
7. What is the cost <strong>of</strong> vinyl flooring for 1 month? What is the cost <strong>of</strong> vinyl flooring for<br />
10 months? What is the cost <strong>of</strong> vinyl flooring for 50 months? What is the cost <strong>of</strong> vinyl<br />
flooring for 60 months?<br />
8. Write an expression for the cost <strong>of</strong> vinyl flooring.<br />
9. What is the cost <strong>of</strong> carpeting for 1 month? What is the cost <strong>of</strong> carpeting for 10 months?<br />
What is the cost <strong>of</strong> carpeting for 50 months? What is the cost <strong>of</strong> carpeting for 60 months?<br />
10. Write an expression for the cost <strong>of</strong> carpeting.<br />
Chapter 4 ■ Assignments 67
11. Complete the table below.<br />
Quantity Name<br />
Unit<br />
Expression<br />
Time Cost <strong>of</strong> vinyl flooring Cost <strong>of</strong> carpeting<br />
months dollars dollars<br />
m<br />
1<br />
10<br />
50<br />
60<br />
12. Based on the table, estimate when the cost <strong>of</strong> the vinyl flooring will equal the cost <strong>of</strong> the<br />
carpeting. Use complete sentences to explain your answer.<br />
13. Write and solve an equation to find when the two flooring options will cost the same.<br />
Show all your work and use a complete sentence in your answer.<br />
4<br />
14. Why is it helpful to isolate the variable m on the right side <strong>of</strong> the equation in Question 13,<br />
instead <strong>of</strong> the left side? Use a complete sentence in your answer.<br />
15. Your group must determine the best option over time. Consider the fact that both<br />
products carry a 10-year warranty. Justify your recommendation using your<br />
calculations above.<br />
© 2008 Carnegie Learning, Inc.<br />
68 Chapter 4 ■ Assignments
Assignment<br />
Assignment for Lesson 4.7<br />
Name ___________________________________________________<br />
Date _____________________<br />
Rules <strong>of</strong> Sports<br />
Solving Absolute Value Equations and Inequalities<br />
Evaluate each expression. Show all your work.<br />
1. |13 5|<br />
2. |6 10| (2)<br />
3.<br />
|(5)(2)|<br />
4. |2| |3|<br />
5. |2 3|<br />
6.<br />
24<br />
4 <br />
7. Complete the table below for the functions y x 2 and y |x 2| .<br />
x x + 2 |x + 2|<br />
–4<br />
–3<br />
–2<br />
–1<br />
4<br />
0<br />
© 2008 Carnegie Learning, Inc.<br />
1<br />
2<br />
8. Graph both functions from Question 7 on the grid at<br />
the right.<br />
9. How does the absolute value change the graph <strong>of</strong><br />
the function?<br />
Chapter 4 ■ Assignments 69
4<br />
© 2008 Carnegie Learning, Inc.<br />
70 Chapter 4 ■ Assignments
Assignment<br />
Assignment for Lesson 5.1<br />
Name ___________________________________________________<br />
Date _____________________<br />
Widgets, Dumbbells, and Dumpsters<br />
Multiple Representatives <strong>of</strong> Linear Functions<br />
Widgets cost $7 each, with a shipping charge <strong>of</strong> $11 per order.<br />
1. Write an equation for the problem situation. Use w to represent the number <strong>of</strong> widgets<br />
ordered and use c to represent the total cost <strong>of</strong> an order in dollars.<br />
2. What is the total cost <strong>of</strong> an order for 12 widgets? What is the total cost <strong>of</strong> an order for<br />
257 widgets? Show all your work and use a complete sentence in your answer.<br />
3. How many widgets can you order for $88? Show all your work and use a complete<br />
sentence in your answer.<br />
4. How many widgets can you order for $1488? Show all your work and use a complete<br />
sentence in your answer.<br />
© 2008 Carnegie Learning, Inc.<br />
5. How many widgets can you order for $6472? Show all your work and use a complete<br />
sentence in your answer.<br />
5<br />
Chapter 5 ■ Assignments 71
5<br />
© 2008 Carnegie Learning, Inc.<br />
72 Chapter 5 ■ Assignments
Assignment<br />
Assignment for Lesson 5.2<br />
Name ___________________________________________________<br />
Date _____________________<br />
Selling Balloons<br />
Finding Intercepts <strong>of</strong> a Graph<br />
Overnight, a huge blizzard dumped 10 inches <strong>of</strong> snow on the ground. When the sun comes out,<br />
it melts the snow at a rate <strong>of</strong> about 1 inch per hour.<br />
1. Write an equation for the problem situation. Use h to represent time in hours and use s to<br />
represent the amount <strong>of</strong> snow on the ground in inches.<br />
2. Complete the table <strong>of</strong> values that shows the relationship between the amount <strong>of</strong> snow in<br />
inches on the ground and the time in hours.<br />
Quantity Name<br />
Unit<br />
Expression<br />
Time since sun came out<br />
hours<br />
h<br />
–2<br />
5<br />
11<br />
Snow on the ground<br />
inches<br />
9<br />
0<br />
© 2008 Carnegie Learning, Inc.<br />
3. Does an h-value <strong>of</strong> –2 make sense in the problem situation? Use complete sentences<br />
to explain.<br />
4. Create a graph <strong>of</strong> the data from the table to show the relationship between time and<br />
the amount <strong>of</strong> snow on the ground. Use the bounds and intervals given below. Be sure<br />
to label your graph clearly.<br />
5<br />
Variable quantity Lower bound Upper bound Interval<br />
Time –3 12 1<br />
Snow on the ground –3 12 1<br />
Chapter 5 ■ Assignments 73
© 2008 Carnegie Learning, Inc.<br />
(label) (units)<br />
(label)<br />
(units)<br />
5. Use the graph in Question 4 to find the h- and s-intercepts. What do these points tell you<br />
about the relationship between the amount <strong>of</strong> snow on the ground and the time in hours.<br />
Use complete sentences in your answer.<br />
5<br />
6. Algebraically, verify the h- and s-intercepts you found in Question 5.<br />
7. Does the graph in Question 4 increase or decrease from left to right? Why? Use complete<br />
sentences in your answer.<br />
74 Chapter 5 ■ Assignments
Assignment<br />
Assignment for Lesson 5.3<br />
Name ___________________________________________________<br />
Date _____________________<br />
Recycling and Saving<br />
Finding the Slope <strong>of</strong> a Line<br />
The student council is selling heart-shaped lollipops to help raise money for the Valentine’s Day<br />
dance. They earn $.25 for each lollipop sold.<br />
1. Write an equation that relates the number <strong>of</strong> lollipops sold to the amount <strong>of</strong> money<br />
earned. Use x to represent the number <strong>of</strong> lollipops sold and y to represent the amount<br />
<strong>of</strong> money earned.<br />
2. Create a graph <strong>of</strong> the equation in Question 1 to show the relationship between the<br />
number <strong>of</strong> lollipops sold and money earned. Use the bounds and intervals given below.<br />
Be sure to label your graph clearly.<br />
Variable quantity Lower bound Upper bound Interval<br />
Number <strong>of</strong> lollipops sold 0 75 5<br />
Money earned 0 30 2<br />
© 2008 Carnegie Learning, Inc.<br />
(label) (units)<br />
5<br />
(label)<br />
(units)<br />
Chapter 5 ■ Assignments 75
3. Use your graph to find the increase in earnings when the number <strong>of</strong> lollipops sold<br />
increases by one. Use a complete sentence in your answer.<br />
4. Use your graph to find the increase in earnings when the number <strong>of</strong> lollipops sold<br />
increases by 20. Use a complete sentence in your answer.<br />
5. Use your graph to find the increase in earnings when the number <strong>of</strong> lollipops sold<br />
increases by 45. Use a complete sentence in your answer.<br />
6. Write a unit rate that compares the increase in earnings to the increase in the number <strong>of</strong><br />
lollipops sold.<br />
7. Determine whether the slope <strong>of</strong> the line in Question 2 is positive, negative, zero,<br />
or undefined. Complete each sentence to explain.<br />
The rise <strong>of</strong> the line is a ____________________ number and the run <strong>of</strong> the line is<br />
____________________ number. So, the slope is ____________________.<br />
8. Use the slope formula and two points on the line in Question 2 to verify the slope in<br />
Question 6.<br />
5<br />
Find the slope <strong>of</strong> the line that passes through the given points. Show all your work.<br />
9. (5, 7) and (6, 5) 10. (20, 50) and (60, 90)<br />
© 2008 Carnegie Learning, Inc.<br />
76 Chapter 5 ■ Assignments
Assignment<br />
Assignment for Lesson 5.4<br />
Name ___________________________________________________<br />
Date _____________________<br />
Running a Marathon<br />
Slope-Intercept Form<br />
Write each equation in slope-intercept form, if necessary. Then identify the slope<br />
and y-intercept.<br />
1. y 2x 3.5<br />
2. y 3(x 5)<br />
3.<br />
y 1 4 x 10<br />
Two families are competing on a reality TV show. The goal <strong>of</strong> the show is to race across the<br />
country from Los Angeles, California to New York, New York. The families are taking indirect<br />
routes and have different tasks to complete along the way. The family that accomplishes all<br />
<strong>of</strong> their tasks and finishes the race in the least amount <strong>of</strong> time wins.<br />
4. The race has begun and the first family has traveled 450 miles. They are averaging<br />
300 miles per day. Write an equation that gives the total distance the first family has<br />
traveled in terms <strong>of</strong> the number <strong>of</strong> days that have passed after the first 450 miles were<br />
completed. Use x to represent the number <strong>of</strong> days and y to represent the total distance<br />
traveled in miles.<br />
5. If the first family continues traveling at this rate, how far will they have traveled 4 days<br />
after the first 450 miles are completed? Show all your work and use a complete sentence<br />
in your answer.<br />
© 2008 Carnegie Learning, Inc.<br />
6. If the first family continues traveling at this rate, how many additional days will it take<br />
them to travel 1950 total miles after the first 450 miles are completed? Show all your work<br />
and use a complete sentence in your answer.<br />
5<br />
7. The race has begun and the second family has traveled 1100 miles. They are currently<br />
traveling at an average rate <strong>of</strong> 150 miles per day. Write an equation that gives the total<br />
distance the second family has traveled in terms <strong>of</strong> the number <strong>of</strong> days that have passed<br />
after the first 1100 miles were completed. Use x to represent the number <strong>of</strong> days and<br />
y to represent the total distance traveled in miles.<br />
Chapter 5 ■ Assignments 77
8. If the second family continues traveling at this rate, how far will they have traveled 5 days<br />
after the first 1100 miles are completed? Show all your work and use a complete sentence<br />
in your answer.<br />
9. If the second family continues traveling at this rate, how many additional days will it take<br />
them to travel 1700 total miles after the first 1100 miles are completed? Show all your<br />
work and use a complete sentence in your answer.<br />
10. Identify the slope and y-intercept for each equation in Questions 4 and 7.<br />
11. Create graphs <strong>of</strong> the equations in Questions 4 and 7 to show the relationship between<br />
time and total distance. Use the slopes and y-intercepts from Question 10.<br />
5<br />
(label) (units)<br />
© 2008 Carnegie Learning, Inc.<br />
(label)<br />
(units)<br />
78 Chapter 5 ■ Assignments
Assignment<br />
Assignment for Lesson 5.5<br />
Name ___________________________________________________<br />
Date _____________________<br />
Saving Money<br />
Writing Equations <strong>of</strong> Lines<br />
A marathon runner checks his watch at the halfway point (13 miles) <strong>of</strong> the Boston Marathon<br />
and sees that he has been running for about 100 minutes. He realizes that in order to match<br />
his personal best he will have to run faster. His personal best time for 26 miles is 191 minutes.<br />
1. In this scenario, what are the two variable quantities? Let the time in minutes be<br />
the dependent variable and let the distance in miles be the independent variable.<br />
Use a complete sentence in your answer.<br />
2. Identify the two points given in the problem statement.<br />
3. What is the runner’s rate (slope) during the second half <strong>of</strong> the race in minutes per mile?<br />
Show all your work and use a complete sentence in your answer.<br />
4. Write an equation in slope-intercept form that gives the time in terms <strong>of</strong> the distance.<br />
Use x to represent the distance in miles and y to represent the time in minutes. Show all<br />
your work.<br />
© 2008 Carnegie Learning, Inc.<br />
Find an equation <strong>of</strong> the line that passes through each given set <strong>of</strong> points. Write<br />
your equation in slope-intercept form. Show all your work.<br />
5. (1, 2) and (2, 0) 6. (4, 100) and (6, 200)<br />
5<br />
Chapter 5 ■ Assignments 79
5<br />
© 2008 Carnegie Learning, Inc.<br />
80 Chapter 5 ■ Assignments
Assignment<br />
Assignment for Lesson 5.6<br />
Name ___________________________________________________<br />
Date _____________________<br />
Spending Money<br />
Linear and Piecewise Functions<br />
1. Explain the difference between a linear function and a piecewise function. Use complete<br />
sentences in your answer.<br />
The college library pays its student workers every 2 weeks. On payday, one <strong>of</strong> the workers<br />
receives a $270 check for the hours that he spends shelving books. The first week (7 days) after<br />
payday the student generally does the majority <strong>of</strong> his shopping and spends an average <strong>of</strong> about<br />
$25 per day. The next 5 days he spends an average <strong>of</strong> $15 per day, and the last 2 days before<br />
the next payday he spends only $10 per day.<br />
2. Complete the table below that shows the amount <strong>of</strong> money left after different numbers<br />
<strong>of</strong> days.<br />
Time since payday<br />
days<br />
Money left<br />
dollars<br />
0<br />
1<br />
2<br />
3<br />
© 2008 Carnegie Learning, Inc.<br />
4<br />
5<br />
6<br />
7<br />
8<br />
9<br />
5<br />
10<br />
11<br />
12<br />
13<br />
14<br />
Chapter 5 ■ Assignments 81
3. Create a graph from the table to show the relationship between the time since payday<br />
and the amount <strong>of</strong> money left. First, choose your bounds and intervals. Be sure to label<br />
your graph clearly.<br />
Variable quantity Lower bound Upper bound Interval<br />
Time since payday<br />
Money left<br />
(label) (units)<br />
5<br />
(label)<br />
4. Write a piecewise function f for the graph in Question 3. Use x to represent a number from<br />
the domain <strong>of</strong> your function f.<br />
(units)<br />
© 2008 Carnegie Learning, Inc.<br />
5. Does the domain <strong>of</strong> the function f accurately represent the domain when you consider the<br />
problem situation? Use complete sentences in your answer.<br />
82 Chapter 5 ■ Assignments
Assignment<br />
Assignment for Lesson 5.7<br />
Name ___________________________________________________<br />
Date _____________________<br />
The <strong>School</strong> Play<br />
Standard Form <strong>of</strong> a Linear Equation<br />
The athletic department will raise money by charging admission to an upcoming football game.<br />
The price will be different for students and adults. Student tickets cost $3 each and adult<br />
tickets cost $5 each.<br />
1. Write an expression that represents the total amount <strong>of</strong> money the athletic department will<br />
raise from the sale <strong>of</strong> x student tickets and y adult tickets.<br />
2. The goal is to raise $5000 from the sale <strong>of</strong> tickets to the game. Write an equation that can<br />
be used to find the number <strong>of</strong> student and adult tickets sold if the goal is reached.<br />
3. Using the equation from Question 2, write the intercepts <strong>of</strong> the equation’s graph.<br />
Show all your work.<br />
4. What do the intercepts mean in terms <strong>of</strong> the problem situation? Use complete sentences<br />
in your answer.<br />
© 2008 Carnegie Learning, Inc.<br />
5. Create a graph <strong>of</strong> the equation in Question 2 to show the relationship between student<br />
tickets and adult tickets. First, choose your bounds and intervals. Be sure to label your<br />
graph clearly.<br />
Variable quantity Lower bound Upper bound Interval<br />
5<br />
Student tickets<br />
Adult tickets<br />
Chapter 5 ■ Assignments 83
© 2008 Carnegie Learning, Inc.<br />
(label) (units)<br />
(label)<br />
(units)<br />
6. Assuming the athletic department met its goal <strong>of</strong> $5000, find the number <strong>of</strong> student<br />
tickets sold if 600 adult tickets sold. Use complete sentences to explain your reasoning.<br />
5<br />
7. Assuming the athletic department met its goal <strong>of</strong> $5000, find the number <strong>of</strong> adult tickets<br />
sold if 400 student tickets sold. Use complete sentences to explain your reasoning.<br />
8. Write the equation in Question 2 in slope-intercept form. Show all your work.<br />
84 Chapter 5 ■ Assignments
Assignment<br />
Assignment for Lesson 5.8<br />
Name ___________________________________________________<br />
Date _____________________<br />
Earning Interest<br />
Solving Literal Equations<br />
1. A formula for the area <strong>of</strong> a rectangle is A bh, where b is the length <strong>of</strong> the base <strong>of</strong> the<br />
rectangle and h is the height <strong>of</strong> the rectangle. Solve the equation for h. Show all your<br />
work. Then use a complete sentence to explain how you can find the height when you<br />
know the area and length <strong>of</strong> the base.<br />
2. The formula for the area <strong>of</strong> a triangle is A 1 , where b is the length <strong>of</strong> the base <strong>of</strong> the<br />
2 bh<br />
triangle and h is the height <strong>of</strong> the triangle. Solve the equation for b. Show all your work.<br />
Then use a complete sentence to explain how you can find the length <strong>of</strong> the base when<br />
you know the area and the height.<br />
3. The formula for the diameter <strong>of</strong> a circle is d 2r, where r is the radius <strong>of</strong> the circle.<br />
Solve the equation for r. Show all your work. Then use a complete sentence to explain<br />
how you can find the radius when you know the diameter.<br />
© 2008 Carnegie Learning, Inc.<br />
4. The formula for the perimeter <strong>of</strong> a rectangle is P 2l 2w, where l is the length<br />
<strong>of</strong> the rectangle and w is the width <strong>of</strong> the rectangle. Solve the equation for w.<br />
Show all your work.<br />
5<br />
Chapter 5 ■ Assignments 85
5<br />
© 2008 Carnegie Learning, Inc.<br />
86 Chapter 5 ■ Assignments
Assignment<br />
Assignment for Lesson 6.1<br />
Name ___________________________________________________<br />
Date _____________________<br />
Mia’s Growing Like a Weed<br />
Drawing the Line <strong>of</strong> Best Fit<br />
The typical gestational period (time from conception to birth) for a human baby is about<br />
40 weeks. Recent developments in ultrasound scanning allow doctors to make measurements<br />
<strong>of</strong> parts <strong>of</strong> a baby’s body while it is still in the womb. The table below contains data about the<br />
length <strong>of</strong> a baby’s femur (thigh bone) during gestation.<br />
Gestation time<br />
weeks<br />
Femur length<br />
centimeters<br />
14 1.5<br />
14.5 1.6<br />
15 2.0<br />
16 2.1<br />
20 3.3<br />
25 4.8<br />
30 6.2<br />
40 8.0<br />
1. Write unit rates that compare the baby’s change in femur length to the change in gestation<br />
time from 14 weeks to 14.5 weeks, from 16 weeks to 20 weeks, and from 30 weeks to<br />
40 weeks. Show all your work.<br />
© 2008 Carnegie Learning, Inc.<br />
2. Do all the data points lie on the same line? What does this tell you about the baby’s femur<br />
length change over time? Use complete sentences to explain your reasoning.<br />
6<br />
Chapter 6 ■ Assignments 87
3. Write ordered pairs from the table that show the baby’s femur length as a function <strong>of</strong><br />
gestation time.<br />
4. Create a scatter plot <strong>of</strong> the ordered pairs in Question 3 to show the relationship between<br />
gestation time and femur length. First, choose your bounds and intervals. Be sure to label<br />
your graph clearly.<br />
Variable quantity Lower bound Upper bound Interval<br />
Gestation time<br />
Femur length<br />
(label) (units)<br />
(label)<br />
(units)<br />
© 2008 Carnegie Learning, Inc.<br />
5. Use a ruler to draw the line that best fits your data in your graph in Question 4. Then write<br />
the equation <strong>of</strong> your line. Be sure to define your variables and include the units.<br />
6<br />
88 Chapter 6 ■ Assignments
Name ___________________________________________________<br />
Date _____________________<br />
6. According to your line, approximately how many centimeters did the femur grow<br />
each week from 14 weeks to 40 weeks? How did you find your answer? Use complete<br />
sentences in your answer.<br />
7. According to your line, approximately how long would the baby’s femur have been when<br />
the gestation time is 7 weeks? Show all your work and use a complete sentence in your<br />
answer.<br />
8. According to your line, approximately how long would the baby’s femur have been<br />
when the gestation time is 8 weeks? Show all your work and use a complete sentence<br />
in your answer.<br />
9. Do your answers to Questions 7 and 8 make sense? Use complete sentences in<br />
your answer.<br />
© 2008 Carnegie Learning, Inc.<br />
10. What can you conclude about the accuracy <strong>of</strong> your model? Use a complete sentence in<br />
your answer.<br />
6<br />
Chapter 6 ■ Assignments 89
© 2008 Carnegie Learning, Inc.<br />
6<br />
90 Chapter 6 ■ Assignments
Assignment<br />
Assignment for Lesson 6.2<br />
Name ___________________________________________________<br />
Date _____________________<br />
Where Do You Buy Your Music?<br />
Using Lines <strong>of</strong> Best Fit<br />
The table below shows the percent <strong>of</strong> voter participation in U.S. presidential elections for the<br />
years 1956 to 2000.<br />
Election year<br />
year<br />
Voter participation<br />
percent<br />
1956 59.3<br />
1960 62.8<br />
1964 61.9<br />
1968 60.9<br />
1972 55.2<br />
1976 53.5<br />
1980 54.0<br />
1984 53.1<br />
1988 50.2<br />
1992 55.9<br />
1996 49.0<br />
2000 50.7<br />
© 2008 Carnegie Learning, Inc.<br />
1. Because the x-coordinates represent time, we can define time as the number <strong>of</strong><br />
years since 1956. So, 1956 would become 0. What number would you use for 1960?<br />
What number would you use for 1964? What number would you use for 1968?<br />
Use complete sentences to explain your reasoning.<br />
2. Write the ordered pairs that show the percent <strong>of</strong> voter participation as a function <strong>of</strong> the<br />
number <strong>of</strong> years since 1956.<br />
3. Looking at the data, do you think your line <strong>of</strong> best fit will have a positive slope or a<br />
negative slope? Use a complete sentence to explain your reasoning.<br />
6<br />
Chapter 6 ■ Assignments 91
4. Create a scatter plot <strong>of</strong> the ordered pairs in Question 2 to show the relationship between<br />
time and voter participation. First, choose your bounds and intervals. Be sure to label<br />
your graph clearly.<br />
Variable quantity Lower bound Upper bound Interval<br />
Time<br />
Voter participation<br />
(label) (units)<br />
(label)<br />
5. Use a ruler to ruler to draw the line that best fits the data in the graph. Then write the<br />
equation <strong>of</strong> the line. Be sure to define your variables and include the units.<br />
(units)<br />
© 2008 Carnegie Learning, Inc.<br />
6<br />
6. Use your equation to predict the percent <strong>of</strong> voter participation in 2008. Show all your work<br />
and use a complete sentence in your answer.<br />
92 Chapter 6 ■ Assignments
Name ___________________________________________________<br />
Date _____________________<br />
7. Considering the problem situation, what is the domain <strong>of</strong> your function? Use a complete<br />
sentence to explain your reasoning.<br />
8. Use your equation to predict the year in which the voter participation will be 45%.<br />
Show all your work and use a complete sentence in your answer.<br />
9. Use your equation to determine what the voter participation was in 1980. Show all your<br />
work and use a complete sentence in your answer.<br />
10. How close is your answer to Question 9 to the actual data? Use a complete sentence in<br />
your answer.<br />
© 2008 Carnegie Learning, Inc.<br />
11. Consider a line <strong>of</strong> best fit for the percent <strong>of</strong> non-voters over time. Would this line increase<br />
or decrease from left to right? How would the line’s steepness compare to the steepness<br />
<strong>of</strong> the line in Question 4? Use complete sentences in your answer.<br />
6<br />
Chapter 6 ■ Assignments 93
© 2008 Carnegie Learning, Inc.<br />
6<br />
94 Chapter 6 ■ Assignments
Assignment<br />
Assignment for Lesson 6.3<br />
Name ___________________________________________________<br />
Date _____________________<br />
Stroop Test<br />
Performing an Experiment<br />
The goal <strong>of</strong> a word recall experiment is to see how many words from a list that is read aloud<br />
that a person can memorize and repeat back. Five word lists are given below.<br />
5-Word List: chair, shoe, horse, suitcase, lamp<br />
7-Word List: animal, sweater, cheetah, avocado, back, desk, plant<br />
10-Word List: stereo, basketball, violin, teacher, pear, baby, table, zoo, curtains, ox<br />
15-Word List: cup, barn, paper, book, fire, comb, glass, vacuum, cloud, road, suit, stereo,<br />
computer, trunk, television<br />
20-Word List: football, hair, pizza, scarf, sandwich, T-shirt, microphone, screen, clock, fingers,<br />
coat, watch, tires, candles, cushions, earrings, heater, picture, keyboard, soda<br />
1. If you were to perform a word recall experiment, what results would you expect to see as<br />
the number <strong>of</strong> words increases? Do you expect people to remember more words or fewer<br />
words? Do you think people will remember the same percent <strong>of</strong> words as the length <strong>of</strong> the<br />
list increases? Use complete sentences in your answer.<br />
2. What are the two variable quantities in a word recall experiment? Which variable quantity<br />
depends on the other? Use complete sentences in your answer.<br />
© 2008 Carnegie Learning, Inc.<br />
3. Perform the experiment for each word list. Read each list <strong>of</strong> words slowly and clearly to<br />
someone, but do not repeat any <strong>of</strong> the words. After you have finished reading each list,<br />
the person should repeat any words he or she remembers back to you. Do not allow the<br />
person to write anything down. Keep track <strong>of</strong> how many words the person correctly<br />
repeats back to you by filling in the table on the next page. Repeat this experiment<br />
two more times and average the results.<br />
6<br />
Chapter 6 ■ Assignments 95
List length<br />
(words)<br />
Trial 1<br />
(words recalled)<br />
Trial 2<br />
(words recalled)<br />
Trial 3<br />
(words recalled)<br />
Average<br />
(words recalled)<br />
5-word list<br />
7-word list<br />
10-word list<br />
15-word list<br />
20-word list<br />
4. Write the ordered pairs from the from the table that show the average number <strong>of</strong> words<br />
recalled as a function <strong>of</strong> the number <strong>of</strong> words in the list.<br />
5. Create a scatter plot <strong>of</strong> the ordered pairs in Question 4 to show the relationship between<br />
list length and words recalled. First, choose your bounds and intervals. Be sure to label<br />
your graph clearly.<br />
Variable quantity Lower bound Upper bound Interval<br />
List length<br />
Words recalled<br />
(label) (units)<br />
© 2008 Carnegie Learning, Inc.<br />
6<br />
(label)<br />
(units)<br />
96 Chapter 6 ■ Assignments
Name ___________________________________________________<br />
Date _____________________<br />
6. Use a ruler to draw a line <strong>of</strong> best fit. Then write the equation <strong>of</strong> your line.<br />
7. Find the y-intercept <strong>of</strong> your line. What does the y-intercept represent in this situation?<br />
Use complete sentences in your answer.<br />
8. Find the slope <strong>of</strong> your line. What does the slope represent in this situation? Use complete<br />
sentences in your answer.<br />
9. What is the average number <strong>of</strong> words that should be recalled from a list <strong>of</strong> 25 words?<br />
What is the average number <strong>of</strong> words that should be recalled from a list <strong>of</strong> 35 words?<br />
What is the average number <strong>of</strong> words that should be recalled from a list <strong>of</strong> 50 words?<br />
Show all your work and use complete sentences in your answer.<br />
10. What length should the word list be if a person recalls 20 words? Show your work and use<br />
a complete sentence in your answer.<br />
© 2008 Carnegie Learning, Inc.<br />
6<br />
Chapter 6 ■ Assignments 97
© 2008 Carnegie Learning, Inc.<br />
6<br />
98 Chapter 6 ■ Assignments
Assignment<br />
Assignment for Lesson 6.4<br />
Name ___________________________________________________<br />
Date _____________________<br />
Jumping<br />
Correlation<br />
Define each term in your own words.<br />
1. correlation<br />
2. positive correlation<br />
3. negative correlation<br />
Decide whether each set <strong>of</strong> data most likely has a positive correlation, a negative<br />
correlation, or no correlation. Use a complete sentence in your answer.<br />
4. The number <strong>of</strong> hours you study compared to your test score<br />
5. Your running speed compared to the time that it takes you to run the 100-meter dash<br />
© 2008 Carnegie Learning, Inc.<br />
6. The number <strong>of</strong> calories that you eat compared to your weight<br />
7. The number <strong>of</strong> computers sold compared to the amount <strong>of</strong> rainfall in inches<br />
8. Give examples <strong>of</strong> two variable quantities that are positively correlated, two variable<br />
quantities that are negatively correlated, and two variable quantities that are not correlated.<br />
6<br />
Chapter 6 ■ Assignments 99
© 2008 Carnegie Learning, Inc.<br />
6<br />
100 Chapter 6 ■ Assignments
Assignment<br />
Assignment for Lesson 6.5<br />
Name ___________________________________________________<br />
Date _____________________<br />
Human Chain: Wrist Experiment<br />
Using Technology to Find a Linear Regression Equation, Part 1<br />
The table below shows the number <strong>of</strong> students per computer in U.S. public schools.<br />
<strong>School</strong> year<br />
year<br />
Students per computer<br />
students<br />
1984 125<br />
1985 75<br />
1986 50<br />
1987 37<br />
1988 32<br />
1989 25<br />
1990 22<br />
1991 20<br />
1992 18<br />
1993 16<br />
1994 14<br />
1995 10.5<br />
1996 10<br />
1997 7.8<br />
© 2008 Carnegie Learning, Inc.<br />
1998 6.1<br />
1999 5.7<br />
2000 5.4<br />
1. Because the x-coordinates represent time, we can define time as the number <strong>of</strong><br />
years since 1984. So, 1984 would become 0. What number would you use for 1990?<br />
What number would you use for 1996? What number would you use for 2000?<br />
Use complete sentences to explain your reasoning.<br />
6<br />
Chapter 6 ■ Assignments 101
2. Write the ordered pairs that show the number <strong>of</strong> students per computer as a function <strong>of</strong><br />
the number <strong>of</strong> years since 1984.<br />
3. Use a graphing calculator to find the linear regression equation. Round the values <strong>of</strong> the<br />
slope and the y-intercept to the nearest hundredth.<br />
4. What is the value <strong>of</strong> r for your linear regression equation? Does this indicate a positive or<br />
negative correlation? Use a complete sentence in your answer.<br />
5. What is the slope <strong>of</strong> your linear regression equation? What does the slope mean in this<br />
problem situation? Use a complete sentence in your answer.<br />
6. What is the y-intercept <strong>of</strong> your linear regression equation? What does the y-intercept<br />
mean in this problem situation? Use a complete sentence in your answer.<br />
7. How does the y-intercept <strong>of</strong> your linear regression equation compare to the actual data?<br />
Use complete sentences in your answer.<br />
© 2008 Carnegie Learning, Inc.<br />
6<br />
8. Is your linear regression equation a good model <strong>of</strong> the data? Show all your work and use<br />
complete sentences in your answer.<br />
102 Chapter 6 ■ Assignments
Assignment<br />
Assignment for Lesson 6.6<br />
Name ___________________________________________________<br />
Date _____________________<br />
Human Chain: Shoulder Experiment<br />
Using Technology to Find a Linear Regression Equation, Part 2<br />
The table below shows the yearly cost <strong>of</strong> tuition at a private four-year college.<br />
<strong>School</strong> year<br />
year<br />
Cost <strong>of</strong> tuition<br />
dollars<br />
1993 10,294<br />
1994 10,952<br />
1995 11,481<br />
1996 12,243<br />
1997 12,881<br />
1998 13,344<br />
1999 13,973<br />
2000 14,588<br />
2001 15,531<br />
1. Because the x-coordinates represent time, we can define time as the number <strong>of</strong><br />
years since 1993. So, 1993 would become 0. What number would you use for 2000?<br />
Use a complete sentence in your answer.<br />
© 2008 Carnegie Learning, Inc.<br />
2. Write the ordered pairs that show the yearly tuition cost as a function <strong>of</strong> the number <strong>of</strong><br />
years since 1993.<br />
6<br />
Chapter 6 ■ Assignments 103
3. Use a graphing calculator to find the linear regression equation. Round the values <strong>of</strong> the<br />
slope and y-intercept to the nearest dollar.<br />
4. Why is it more appropriate to round the slope and y-intercept <strong>of</strong> the linear regression<br />
equation in Question 3 to nearest dollar instead <strong>of</strong> to the nearest cent? Use complete<br />
sentences in your answer.<br />
5. What is the value <strong>of</strong> r for your linear regression equation? Does this indicate a positive or<br />
negative correlation? Use a complete sentence in your answer.<br />
6. What is the slope <strong>of</strong> your linear regression equation? What does the slope mean in this<br />
problem situation? Use a complete sentence in your answer.<br />
7. Use your linear regression equation to predict the cost <strong>of</strong> tuition in 2005. Show all your<br />
work and use a complete sentence in your answer.<br />
8. Use your linear regression equation to determine in which year the cost <strong>of</strong> tuition will<br />
be $25,000. Show all your work and use a complete sentence in your answer.<br />
© 2008 Carnegie Learning, Inc.<br />
6<br />
104 Chapter 6 ■ Assignments
Assignment<br />
Assignment for Lesson 6.7<br />
Name ___________________________________________________<br />
Date _____________________<br />
Making a Quilt<br />
Scatter Plots and Non-Linear Data<br />
An automatic sprinkler system includes ground-level sprinkler heads that rotate to water a<br />
circular area. The radius <strong>of</strong> the circular area can be adjusted at installation to accommodate<br />
the shape <strong>of</strong> any yard.<br />
1. Complete the table below that shows the watering area for different sprinkling radii.<br />
Recall that the area <strong>of</strong> a circle is A r 2 , where 3.14.<br />
Radius<br />
feet<br />
Area<br />
square feet<br />
0<br />
1<br />
2<br />
3<br />
4<br />
5<br />
6<br />
7<br />
2. Write the ordered pairs that show the area as a function <strong>of</strong> the watering radius.<br />
© 2008 Carnegie Learning, Inc.<br />
3. Create a scatter plot <strong>of</strong> the ordered pairs on the grid to show the relationship between radius<br />
and area. First, choose your bounds and intervals. Be sure to label your graph clearly.<br />
Variable quantity Lower bound Upper bound Interval<br />
Radius<br />
Area<br />
6<br />
Chapter 6 ■ Assignments 105
© 2008 Carnegie Learning, Inc.<br />
(label) (units)<br />
(label)<br />
(units)<br />
4. Use a graphing calculator to find the linear regression equation.<br />
5. Find the watering area when the sprinkler radius is 10 feet as you did when you filled in<br />
the chart in Question 1. Then use the equation in Question 4 to find the area. What can<br />
you conclude about your linear model? Use complete sentences in your answer.<br />
6<br />
106 Chapter 6 ■ Assignments
Assignment<br />
Name ___________________________________________________<br />
Making and Selling Markers and T-Shirts<br />
Using a Graph to Solve a Linear System<br />
1. Define break-even point in your own words.<br />
Assignment for Lesson 7.1<br />
Date _____________________<br />
7<br />
2. How can a graph be used to determine the break-even point? Use a complete sentence in<br />
your answer.<br />
A company makes and sells flags with various seasonal themes. It costs $12 to manufacture<br />
each flag, and there is a set-up cost <strong>of</strong> $200 for a new design. The company sells the flags to<br />
home improvement stores for $20 per flag.<br />
3. Write an equation for the production cost in dollars in terms <strong>of</strong> the number <strong>of</strong> flags<br />
produced. Be sure to describe what your variables represent. Use a complete sentence<br />
in your answer.<br />
4. Write an equation for the income in dollars in terms <strong>of</strong> the number <strong>of</strong> flags sold. Be sure to<br />
describe what your variables represent. Use a complete sentence in your answer.<br />
© 2008 Carnegie Learning, Inc.<br />
5. Complete the table <strong>of</strong> values that shows the production cost and income for different<br />
numbers <strong>of</strong> flags with the same design.<br />
Quantity Name<br />
Unit<br />
Expression<br />
Number <strong>of</strong> flags Production cost Income<br />
flags dollars dollars<br />
x<br />
0<br />
20<br />
30<br />
50<br />
120<br />
Chapter 7 ■ Assignments 107
7<br />
6. Create a graph <strong>of</strong> both the production cost and income equations on the grid below. Use<br />
the bounds and intervals below. Be sure to label your graph clearly.<br />
Variable quantity Lower bound Upper bound Interval<br />
Flags 0 150 10<br />
Money 0 3000 200<br />
(label) (units)<br />
(label)<br />
(units)<br />
7. What is the break-even point for making and selling flags? Use a complete sentence in<br />
your answer.<br />
8. What is the company's pr<strong>of</strong>it at the break-even point? Show all your work and use a<br />
complete sentence in your answer.<br />
© 2008 Carnegie Learning, Inc.<br />
108 Chapter 7 ■ Assignments
Assignment<br />
Assignment for Lesson 7.2<br />
Name ___________________________________________________<br />
Time Study<br />
Graphs and Solutions <strong>of</strong> Linear Systems<br />
Date _____________________<br />
1. Describe the graph <strong>of</strong> a linear system with one solution, a linear system with no<br />
solutions, and a linear system with infinitely many solutions. Use complete sentences<br />
in your answer.<br />
7<br />
Two window washers are cleaning the windows <strong>of</strong> a skyscraper. By 11:00 A.M., the first window<br />
washer, Wally, has already cleaned 12 windows and cleans at a rate <strong>of</strong> 4 windows per hour.<br />
Wally’s partner, Wanda, started work late today. She has only washed 8 windows by 11:00 A.M.,<br />
but she cleans at a rate <strong>of</strong> 5 windows per hour.<br />
2. For each worker, write an equation that gives the total number <strong>of</strong> windows washed y in<br />
terms <strong>of</strong> the time worked x in hours since 11:00 A.M.<br />
3. Complete the table <strong>of</strong> values that shows the number <strong>of</strong> windows washed by Wally and<br />
Wanda for different numbers <strong>of</strong> hours worked.<br />
Quantity Name<br />
Time worked since<br />
11:00 A.M.<br />
Windows washed<br />
by Wally<br />
Windows washed<br />
by Wanda<br />
Unit<br />
hours windows windows<br />
© 2008 Carnegie Learning, Inc.<br />
Expression<br />
x<br />
0<br />
2<br />
5<br />
8<br />
10<br />
4. Write a linear system that shows the total number <strong>of</strong> windows washed in terms <strong>of</strong> the time<br />
worked since 11:00 A.M. for both washers.<br />
Chapter 7 ■ Assignments 109
7<br />
5. Does the linear system in Question 4 have one solution, no solution, or infinitely many<br />
solutions? Use complete sentences to justify your answer.<br />
6. Based on the values in the table in Question 3, estimate when Wally and Wanda will have<br />
washed the same number <strong>of</strong> windows. Use complete sentences to justify your estimate.<br />
7. Create a graph <strong>of</strong> the linear system on the grid below. First, choose your bounds and<br />
intervals. Be sure to label your graph clearly.<br />
Variable quantity Lower bound Upper bound Interval<br />
Time worked since 11:00 A.M.<br />
Windows<br />
(label) (units)<br />
© 2008 Carnegie Learning, Inc.<br />
(label)<br />
(units)<br />
110 Chapter 7 ■ Assignments
Name ___________________________________________________<br />
Date _____________________<br />
8. What is the solution <strong>of</strong> the linear system in this problem situation? Use a complete<br />
sentence in your answer.<br />
7<br />
9. Algebraically verify that the ordered pair in Question 8 is the solution to the system.<br />
10. What does the solution mean in context <strong>of</strong> this problem situation? Use a complete<br />
sentence in your answer.<br />
Determine whether the graphs <strong>of</strong> each pair <strong>of</strong> equations are parallel, perpendicular,<br />
or neither. Show all your work and use a complete sentence to explain your reasoning.<br />
11. y 2x 5 and y 2x 4<br />
12. y 3x 6 and y 3(1 x)<br />
© 2008 Carnegie Learning, Inc.<br />
13. y 0.2x 9 and y 5x 7<br />
Chapter 7 ■ Assignments 111
7<br />
© 2008 Carnegie Learning, Inc.<br />
112 Chapter 7 ■ Assignments
Assignment<br />
Assignment for Lesson 7.3<br />
Name ___________________________________________________<br />
Hiking Trip<br />
Using Substitution to Solve a Linear System<br />
Date _____________________<br />
The school dance team raised money by charging admission to the spring ballet. They charged<br />
$2 for each student ticket and $5 for each adult ticket, raising $510 from ticket sales.<br />
7<br />
1. Write an equation in standard form that relates the numbers <strong>of</strong> adult tickets and student<br />
tickets bought for $510. Let x represent the number <strong>of</strong> student tickets bought and let y<br />
represent the number <strong>of</strong> adult tickets bought.<br />
2. Adults bought 3 times the number <strong>of</strong> tickets that students bought. Write an equation in x<br />
and y as defined in Question 1 that represents this situation.<br />
3. Do 50 student tickets and 100 adult tickets satisfy the equations in Questions 1 and 2?<br />
Show all your work.<br />
4. Use the substitution method to solve the linear system. Show all your work.<br />
© 2008 Carnegie Learning, Inc.<br />
5. What does the solution in Question 4 mean in context <strong>of</strong> the problem situation? Use a<br />
complete sentence in your answer.<br />
Chapter 7 ■ Assignments 113
7<br />
Solve each linear system by using the substitution method. Show all your work and<br />
use a complete sentence in your answer. Then check your answer algebraically.<br />
6. y 2x<br />
7.<br />
5x 4y 110<br />
3x 2y 21<br />
y 1.5x<br />
8. 3x 2y 24<br />
9.<br />
x 2y<br />
5x 3y 23<br />
x y 3<br />
© 2008 Carnegie Learning, Inc.<br />
114 Chapter 7 ■ Assignments
Assignment<br />
Assignment for Lesson 7.4<br />
Name ___________________________________________________<br />
Basketball Tournament<br />
Using Linear Combinations to Solve a Linear System<br />
Date _____________________<br />
Cafeteria workers at a summer camp are preparing lunches for all the campers and counselors.<br />
The total number <strong>of</strong> campers and counselors is 300. The difference between the number <strong>of</strong><br />
campers and the number <strong>of</strong> counselors is 280.<br />
7<br />
1. Write an equation in standard form that represents the total number <strong>of</strong> people at<br />
the camp. Let x represent the number <strong>of</strong> campers and let y represent the number<br />
<strong>of</strong> counselors.<br />
2. Write an equation in standard form that represents the difference between the numbers <strong>of</strong><br />
campers and counselors.<br />
3. Write the linear system for this problem situation below.<br />
4. Solve the linear system in Question 3. Show all your work and write your answer in a<br />
complete sentence.<br />
© 2008 Carnegie Learning, Inc.<br />
5. Check your solution algebraically. Show all your work.<br />
Chapter 7 ■ Assignments 115
7<br />
6. Check your solution by creating a graph <strong>of</strong> your linear system on the grid below.<br />
First, choose your bounds and intervals. Be sure to label your graph clearly.<br />
Variable quantity Lower bound Upper bound Interval<br />
Campers<br />
Counselors<br />
(label) (units)<br />
(label)<br />
(units)<br />
7. For the linear system below, describe two different first steps you could take to solve the<br />
system by using the linear combination method. Identify the variable that will be solved<br />
for when you add equations for each case. Use complete sentences in your answer.<br />
4x 5y 20<br />
2x 10y 20<br />
© 2008 Carnegie Learning, Inc.<br />
116 Chapter 7 ■ Assignments
Assignment<br />
Assignment for Lesson 7.5<br />
Name ___________________________________________________<br />
Finding the Better Paying Job<br />
Using the Best Method to Solve a Linear System, Part 1<br />
Date _____________________<br />
You are <strong>of</strong>fered two different summer jobs and you need to decide which one will pay the<br />
most money. The first job, a camp counselor position, pays $200 up front plus $7 per hour.<br />
The second job, a cashier position at a sporting goods store, pays $10 per hour.<br />
7<br />
1. Write an equation that gives the total earnings from the counselor position in dollars<br />
in terms <strong>of</strong> the time worked in hours. Be sure to define your variables. Use a complete<br />
sentence in your answer.<br />
2. Write an equation that gives the total earnings from the cashier position in dollars in terms<br />
<strong>of</strong> the time worked in hours. Be sure to define your variables. Use a complete sentence in<br />
your answer.<br />
3. Use an algebraic method to determine whether the total earnings from the counselor<br />
position will ever be the same as the total earnings from the cashier position. Show all<br />
your work and use a complete sentence in your answer.<br />
© 2008 Carnegie Learning, Inc.<br />
4. If the total earnings will be the same, what will the total earnings be? Show all your work<br />
and use a complete sentence in your answer.<br />
5. Which method did you use to find the answer to Question 3? Use a complete sentence to<br />
explain your choice.<br />
Chapter 7 ■ Assignments 117
7<br />
6. Check your solution by creating a graph <strong>of</strong> your linear system on the grid below.<br />
First, choose your bounds and intervals. Be sure to label your graph clearly.<br />
Variable quantity Lower bound Upper bound Interval<br />
Time worked<br />
Total earnings<br />
(label) (units)<br />
(label)<br />
(units)<br />
7. Write a short paragraph explaining which job is the better choice. Use the information<br />
from the linear system and the graph to support your decision.<br />
© 2008 Carnegie Learning, Inc.<br />
118 Chapter 7 ■ Assignments
Assignment<br />
Assignment for Lesson 7.6<br />
Name ___________________________________________________<br />
World Oil: Supply and Demand<br />
Using the Best Method to Solve a Linear System, Part 2<br />
Date _____________________<br />
The weather report just announced that a huge winter storm is coming to the area. Local<br />
residents are concerned that they will be confined to their houses, so they begin stocking up<br />
on groceries and drinking water. The local grocery store currently has 500 gallons <strong>of</strong> drinking<br />
water, and they have placed orders so that 50 gallons <strong>of</strong> water are shipped to the store every<br />
hour. The grocery store manager has calculated that anxious residents are purchasing water<br />
at a rate <strong>of</strong> 71 gallons per hour.<br />
7<br />
1. Write an equation that gives the grocery store's supply <strong>of</strong> water in terms <strong>of</strong> the time in<br />
hours. Be sure to define your variables.<br />
2. Write an expression for the demand for water in gallons in terms <strong>of</strong> the time in hours.<br />
Be sure to define your variables.<br />
3. Complete the table <strong>of</strong> values below that shows the supply and demand.<br />
Quantity Name<br />
Unit<br />
Expression<br />
Time Supply Demand<br />
hours gallons gallons<br />
x<br />
0<br />
© 2008 Carnegie Learning, Inc.<br />
5<br />
10<br />
15<br />
20<br />
25<br />
30<br />
4. Based on the table in Question 3, estimate when the store will run out <strong>of</strong> drinking water.<br />
Use a complete sentence to explain your reasoning.<br />
Chapter 7 ■ Assignments 119
7<br />
5. Solve a system <strong>of</strong> equations to determine when the store will run out <strong>of</strong> drinking water.<br />
Show all your work and use a complete sentence in your answer.<br />
6. Check your answers to Questions 4 and 5 by creating a graph <strong>of</strong> your linear system on the<br />
grid below. First, choose your bounds and intervals. Be sure to label your graph clearly.<br />
Variable quantity Lower bound Upper bound Interval<br />
Time<br />
Water<br />
(label) (units)<br />
© 2008 Carnegie Learning, Inc.<br />
(label)<br />
(units)<br />
7. You have just used three different methods to determine the point <strong>of</strong> intersection <strong>of</strong> a<br />
linear system. What are the three methods?<br />
120 Chapter 7 ■ Assignments
Assignment<br />
Assignment for Lesson 7.7<br />
Name ___________________________________________________<br />
Picking the Better Option<br />
Solving Linear Systems<br />
Date _____________________<br />
Two proposals are being considered for the redevelopment <strong>of</strong> an old building. The first<br />
proposal is to turn the building into a few large, deluxe apartments. The cost <strong>of</strong> redevelopment<br />
is $500,000 and the maintenance is expected to cost $1000 per month. The second proposal is<br />
to convert the building into many small apartments. This redevelopment will be less expensive,<br />
at a cost <strong>of</strong> only $250,000, but maintenance is expected to cost $2500 per month.<br />
7<br />
1. For each plan, write an equation that gives the total expenses in dollars in terms <strong>of</strong> the<br />
time in months. Be sure to define your variables.<br />
2. For each plan, what do the slope and y-intercept <strong>of</strong> the graph <strong>of</strong> the equation represent in<br />
the problem situation? Use complete sentences in your answer.<br />
3. Will there be a number <strong>of</strong> months for which the total expenses are the same?<br />
How do you know? Use a complete sentence to explain your reasoning.<br />
© 2008 Carnegie Learning, Inc.<br />
4. Describe the different methods you can use to find the number <strong>of</strong> months for which the<br />
total expenses are the same. Use a complete sentence in your answer.<br />
Chapter 7 ■ Assignments 121
7<br />
5. Use an algebraic method to find the number <strong>of</strong> months for which the total expenses<br />
are the same. Then describe the numbers <strong>of</strong> months for which each plan is the<br />
least expensive.<br />
6. Now consider the income that the apartments are expected to generate. The developers<br />
expect to make $7500 each month from renting the apartments. Write an equation that<br />
gives the total earnings in dollars in terms <strong>of</strong> the number <strong>of</strong> months the apartments<br />
are rented.<br />
7. For each plan, determine the break-even point. Show all your work and use complete<br />
sentences in your answer.<br />
8. Use the results from Question 7 to describe the number <strong>of</strong> months for which each plan is<br />
better. Use complete sentences in your answer.<br />
© 2008 Carnegie Learning, Inc.<br />
122 Chapter 7 ■ Assignments
Assignment<br />
Assignment for Lesson 7.8<br />
Name ___________________________________________________<br />
Video Arcade<br />
Writing and Graphing an Inequality in Two Variables<br />
Date _____________________<br />
The senior class plans to raise money to help pay for a local playground. The class sets a goal<br />
to raise at least $2000 by washing cars and selling T-shirts. Every car washed earns $5 and<br />
every T-shirt sold earns $8.<br />
7<br />
1. If the class washes 100 cars and sells 150 T-shirts, will the goal be reached?<br />
Show your work.<br />
2. If the class washes 150 cars and sells 200 T-shirts, will the goal be reached?<br />
Show your work.<br />
3. Write an expression that represents the total money raised. Let x represent the<br />
number <strong>of</strong> cars washed and let y represent the number <strong>of</strong> T-shirts sold.<br />
4. Complete the table that shows the total money raised for different numbers <strong>of</strong> cars<br />
washed and T-shirts sold.<br />
Quantity Name<br />
Unit<br />
Cars washed T-shirts sold Money raised<br />
cars T-shirts dollars<br />
0 250<br />
25 175<br />
© 2008 Carnegie Learning, Inc.<br />
50 150<br />
200 200<br />
125 200<br />
200 125<br />
5. Which ordered pairs from the table in Question 4 satisfy the problem situation?<br />
6. Write an equation that represents the number <strong>of</strong> cars washed x and the number <strong>of</strong> T-shirts<br />
sold y that raises exactly $2000.<br />
Chapter 7 ■ Assignments 123
7<br />
7. Find the x- and y-intercepts <strong>of</strong> your equation in Question 6.<br />
8. Use the intercepts to graph the equation in Question 6 on the grid below. Use the bounds<br />
and intervals given below. Be sure to label your graph clearly.<br />
Variable quantity Lower bound Upper bound Interval<br />
Number <strong>of</strong> cars washed<br />
Number <strong>of</strong> shirts sold<br />
(label) (units)<br />
(label)<br />
9. Write a linear inequality that represents the number <strong>of</strong> cars washed x and the number <strong>of</strong><br />
T-shirts sold y that raises at least $2000.<br />
(units)<br />
© 2008 Carnegie Learning, Inc.<br />
10. Plot the ordered pairs from Question 5 on the grid above.<br />
11. Shade the region on the graph above that shows all the points that satisfy the inequality in<br />
Question 9.<br />
124 Chapter 7 ■ Assignments
Assignment<br />
Assignment for Lesson 7.9<br />
Name ___________________________________________________<br />
Making a Mosaic<br />
Solving Systems <strong>of</strong> Linear Inequalities<br />
Date _____________________<br />
7<br />
Solve each system <strong>of</strong> linear inequalities by filling in the missing information for<br />
each inequality and then graphing.<br />
1. 3x 3y ≥ 18<br />
x 2y 4<br />
3x 3y ≥ 18<br />
x-intercept:_____________________<br />
y-intercept: ____________________<br />
y<br />
8<br />
6<br />
4<br />
2<br />
Solid or dashed line? ____________<br />
Test (0, 0):______________________<br />
_______________________________<br />
−8 −6 −4 −2 O 2 4 6 8<br />
−2<br />
−4<br />
−6<br />
x<br />
x 2y 4<br />
x-intercept:_____________________<br />
y-intercept:_____________________<br />
Solid or dashed line? ____________<br />
Test (0, 0):______________________<br />
_______________________________<br />
−8<br />
2.<br />
4x 8y 32<br />
y<br />
y x 3<br />
8<br />
© 2008 Carnegie Learning, Inc.<br />
4x 8y 32<br />
x-intercept:_____________________<br />
y-intercept:_____________________<br />
Solid or dashed line? ____________<br />
Test (0, 0):______________________<br />
_______________________________<br />
6<br />
4<br />
2<br />
−8 −6 −4 −2 O 2 4 6 8<br />
−2<br />
−4<br />
−6<br />
x<br />
y x 3<br />
x-intercept:_____________________<br />
−8<br />
y-intercept:_____________________<br />
Solid or dashed line? ____________<br />
Test (0, 0):______________________<br />
_______________________________<br />
Chapter 7 ■ Assignments 125
7<br />
© 2008 Carnegie Learning, Inc.<br />
126 Chapter 7 ■ Assignments
Assignment<br />
Assignment for Lesson 8.1<br />
Name ___________________________________________________<br />
Date _____________________<br />
Website Design<br />
Introduction to Quadratic Functions<br />
Identify the values <strong>of</strong> a, b, and c in each quadratic function.<br />
1. y 2x 2 3x 1<br />
2. y 3x 2 5x<br />
3.<br />
y x 2 4x 2<br />
8<br />
Evaluate each quadratic function for the given value <strong>of</strong> x. Show all your work.<br />
4. f(x) 2x 2 3x 1; f(2) 5. f(x) 3x 2 5x; f(1)<br />
6.<br />
f(x) x 2 4x; f(0)<br />
As the set designer for your school play, you have to build an archway for one <strong>of</strong> the scenes.<br />
The archway needs to be 14 feet wide and 12 feet high. Before cutting the archway in a piece<br />
<strong>of</strong> plywood, you draw a plan on a coordinate grid. The table below shows some <strong>of</strong> the points<br />
<strong>of</strong> the archway with respect to the origin. The origin represents the lower left-hand corner <strong>of</strong> the<br />
plywood sheet where you will begin cutting.<br />
Quantity Name<br />
Unit<br />
Horizontal distance<br />
feet<br />
Vertical distance<br />
feet<br />
© 2008 Carnegie Learning, Inc.<br />
0 0<br />
5 11.02<br />
7 12<br />
9 11.02<br />
14 0<br />
7. Create a scatter plot <strong>of</strong> the points <strong>of</strong> the archway on the grid. First, choose your bounds<br />
and intervals. Be sure to label your graph clearly.<br />
Variable quantity Lower bound Upper bound Interval<br />
Chapter 8 ■ Assignments 127
8<br />
(label) (units)<br />
(label)<br />
(units)<br />
© 2008 Carnegie Learning, Inc.<br />
8. Connect the points with a smooth curve to create the drawing <strong>of</strong> the archway.<br />
128 Chapter 8 ■ Assignments
Assignment<br />
Assignment for Lesson 8.2<br />
Name ___________________________________________________<br />
Date _____________________<br />
Satellite Dish<br />
Parabolas<br />
Define each term in your own words.<br />
1. parabola<br />
2. vertex<br />
8<br />
3. axis <strong>of</strong> symmetry<br />
For each function, algebraically determine the vertex and the axis <strong>of</strong> symmetry<br />
<strong>of</strong> the graph. Then draw the graph for each function. Identify the domain and<br />
range for each function.<br />
4. y x 2 3<br />
© 2008 Carnegie Learning, Inc.<br />
Chapter 8 ■ Assignments 129
5. y x 2 3x 5<br />
8<br />
© 2008 Carnegie Learning, Inc.<br />
130 Chapter 8 ■ Assignments
Assignment<br />
Assignment for Lesson 8.3<br />
Name ___________________________________________________<br />
Date _____________________<br />
Dog Run<br />
Comparing Linear and Quadratic Functions<br />
1. What is the formula for the area <strong>of</strong> a square A with side length x?<br />
2. Based on Lesson 8.3, what effect do you think doubling the side length <strong>of</strong> a square has<br />
on its area? Use a complete sentence in your answer.<br />
8<br />
3. Complete the table below to show different side lengths and areas <strong>of</strong> a square.<br />
Side length<br />
cm<br />
Area<br />
sq cm<br />
1<br />
3<br />
9<br />
27<br />
81<br />
© 2008 Carnegie Learning, Inc.<br />
4. Create a graph that shows the area as a function <strong>of</strong> the side length on the grid.<br />
First, choose your bounds and intervals. Be sure to label your graph clearly.<br />
Variable quantity Lower bound Upper bound Interval<br />
Chapter 8 ■ Assignments 131
8<br />
(label) (units)<br />
(label)<br />
(units)<br />
5. Describe the rate <strong>of</strong> change <strong>of</strong> the side length in the table in Question 3.<br />
6. Based on Questions 3 and 4, what effect do you think tripling the side length <strong>of</strong> a square<br />
has on its area? Use a complete sentence in your answer.<br />
7. What effect do you think halving the side length <strong>of</strong> a square has on its area?<br />
Use a complete sentence in your answer.<br />
© 2008 Carnegie Learning, Inc.<br />
132 Chapter 8 ■ Assignments
Assignment<br />
Assignment for Lesson 8.4<br />
Name ___________________________________________________<br />
Date _____________________<br />
Guitar Strings and Other Things<br />
Square Roots and Radicals<br />
The principal <strong>of</strong> a local elementary school is hiring contractors to design and build a new<br />
playground. The playground will consist <strong>of</strong> several small play areas with grass in between.<br />
The small play areas will be built with a rubber base instead <strong>of</strong> concrete.<br />
1. The swings will be built on a square rubber base. Let s represent the side length in feet<br />
and A represent the area in square feet. What is the area <strong>of</strong> the rubber base if the side<br />
length is 10 feet? What is the area <strong>of</strong> the rubber base if the side length is 15 feet?<br />
What is the area <strong>of</strong> the rubber base if the side length is 20 feet? Show all your work<br />
and use complete sentences in your answer.<br />
8<br />
2. What is the side length <strong>of</strong> the square rubber base if its area is 144 square feet?<br />
What is the side length <strong>of</strong> the square rubber base if its area is 196 square feet?<br />
What is the side length <strong>of</strong> the square rubber base if its area is 625 square feet?<br />
Show all your work and use complete sentences in your answer.<br />
© 2008 Carnegie Learning, Inc.<br />
3. The slide will be built on a circular rubber base. Let r represent the radius in feet and<br />
A represent the area in square feet. What is the area <strong>of</strong> the circular rubber base if the<br />
radius is 4 feet? What is the area <strong>of</strong> the circular rubber base if the radius is 6 feet? What is<br />
the area <strong>of</strong> the circular rubber base if the radius is 10 feet? The formula for the area <strong>of</strong> a<br />
circle is A 3.14r 2 . Show all your work and use complete sentences in your answer.<br />
Chapter 8 ■ Assignments 133
4. What is the radius <strong>of</strong> the circular rubber base if its area is 100 square feet?<br />
What is the radius <strong>of</strong> the circular rubber base if its area is 200 square feet?<br />
What is the radius <strong>of</strong> the circular rubber base if its area is 300 square feet?<br />
What is the radius <strong>of</strong> the circular rubber base if its area is A square feet?<br />
Show all your work and use complete sentences in your answer.<br />
8<br />
5. Equations that have a variable to the second power generally have two solutions.<br />
Does this make sense in this problem situation? Why or why not? Use a complete<br />
sentence in your answer.<br />
Identify which point on the number line below matches each value.<br />
A B C D E F G H I J K<br />
0 1 2 3 4 5 6 7 8 9 10<br />
6. 10<br />
7. 83<br />
8.<br />
9. 23<br />
10. 67<br />
11. 3<br />
52<br />
© 2008 Carnegie Learning, Inc.<br />
134 Chapter 8 ■ Assignments
Assignment<br />
Assignment for Lesson 8.5<br />
Name ___________________________________________________<br />
Date _____________________<br />
Tent Designing Competition<br />
Solving by Factoring and Extracting Square Roots<br />
A manufacturing company just received a contract to make different-sized cones that will be<br />
used by the state Department <strong>of</strong> Transportation. The formula for volume <strong>of</strong> a cone will be used<br />
in their planning and manufacturing <strong>of</strong> the product. The formula is V 1 , where r is the<br />
3 r 2 h<br />
radius <strong>of</strong> the base <strong>of</strong> the cone and h is the height.<br />
1. What is the volume <strong>of</strong> the cone when the radius is 0.5 foot and the height is 2 feet?<br />
What is the volume <strong>of</strong> the cone when the radius is 0.75 feet and the height is 2.5 feet?<br />
Use 3.14 for . Show all your work and use complete sentences in your answer.<br />
8<br />
2. One cone has a volume <strong>of</strong> 1 cubic foot and a height <strong>of</strong> 2 feet. Write an equation that you<br />
can use to find the radius <strong>of</strong> the cone.<br />
3. Get the variable by itself on one side <strong>of</strong> the equation from Question 2 and simplify.<br />
Use 3.14 for and show all your work.<br />
© 2008 Carnegie Learning, Inc.<br />
4. Use a calculator to approximate the solutions <strong>of</strong> the equation in Question 3 to the<br />
nearest tenth.<br />
5. What is the radius <strong>of</strong> the cone? Use a complete sentence in your answer.<br />
Chapter 8 ■ Assignments 135
For each quadratic function below, find the x-intercepts, the y-intercept,<br />
and sketch its graph. Show all your work.<br />
6.<br />
y 1 (x 4)(x 4)<br />
4<br />
x-intercepts: _____________<br />
y-intercept: ______________<br />
8<br />
7.<br />
y 2(x 2)(x 2)<br />
x-intercepts: _____________<br />
y-intercept: ______________<br />
© 2008 Carnegie Learning, Inc.<br />
136 Chapter 8 ■ Assignments
Assignment<br />
Assignment for Lesson 8.6<br />
Name ___________________________________________________<br />
Date _____________________<br />
Kicking a Soccer Ball<br />
Using the Quadratic Formula to Solve Quadratic Equations<br />
Consider the quadratic function y = x 2 + 2x – 3 for Questions 1 through 5.<br />
1. Complete the table <strong>of</strong> values below and then sketch the graph.<br />
x<br />
y<br />
–2<br />
8<br />
–1<br />
0<br />
1<br />
2<br />
3<br />
© 2008 Carnegie Learning, Inc.<br />
2. Using the table and graph, identify the x-intercepts.<br />
3. Write an equation that you can use to algebraically find the x-intercepts.<br />
Chapter 8 ■ Assignments 137
4. For the equation in Question 3, find the values <strong>of</strong> a, b, and c. Then solve the equation<br />
using the quadratic formula. Show all your work.<br />
8<br />
Use the discriminant to write a quadratic equation for each given number <strong>of</strong><br />
solutions. Show all your work.<br />
5. no real solutions<br />
6. one rational solution<br />
7. two real solutions<br />
8. Which method for solving quadratic equations can be used to solve any quadratic<br />
equation? Use complete sentences in your answer.<br />
© 2008 Carnegie Learning, Inc.<br />
138 Chapter 8 ■ Assignments
Assignment<br />
Assignment for Lesson 8.7<br />
Name ___________________________________________________<br />
Date _____________________<br />
Pumpkin Catapult<br />
Using a Vertical Motion Model<br />
A baseball player hits a foul ball straight up in the air from a height <strong>of</strong> 4 feet <strong>of</strong>f the ground.<br />
The initial velocity as the ball comes <strong>of</strong>f the bat is 130 feet per second. The motion <strong>of</strong> ball<br />
can be modeled by y 16t 2 vt h,<br />
where t is the time in seconds, v is the initial velocity<br />
in feet per second, and h is the height <strong>of</strong>f the ground in feet.<br />
1. Write a quadratic function that models the height <strong>of</strong> the ball in terms <strong>of</strong> time.<br />
8<br />
2. What is the height <strong>of</strong> the ball after 1 second? What is the height <strong>of</strong> the ball after<br />
2 seconds? What is the height <strong>of</strong> the ball after 10 seconds? Show all your work<br />
and use complete sentences in your answer.<br />
3. Do all <strong>of</strong> the answers to Question 2 make sense? Use complete sentences<br />
in your answer.<br />
© 2008 Carnegie Learning, Inc.<br />
4. Write an equation that you can use to find when the ball is 250 feet <strong>of</strong>f the ground.<br />
Then solve the equation. Show all your work.<br />
Chapter 8 ■ Assignments 139
5. Do both solutions make sense? Use a complete sentence to in your answer.<br />
6. When is the ball 250 feet above the ground? Use a complete sentence in your answer.<br />
7. Write an equation that you can use to determine when the ball hits the ground. Then solve<br />
the equation. Show all your work.<br />
8<br />
8. Do both solutions have meaning in the problem situation? Use a complete sentence in<br />
your answer.<br />
9. When does the ball hit the ground? Use a complete sentence in your answer.<br />
10. When is the ball at its highest point? Show all your work and use a complete sentence in<br />
your answer.<br />
© 2008 Carnegie Learning, Inc.<br />
11. What is the greatest height <strong>of</strong> the ball? Show all your work and use a complete sentence<br />
in your answer.<br />
140 Chapter 8 ■ Assignments
Name ___________________________________________________<br />
Date _____________________<br />
12. Complete the table <strong>of</strong> values that shows the height <strong>of</strong> the ball in terms <strong>of</strong> time.<br />
Quantity Name<br />
Unit<br />
Expression<br />
Time<br />
seconds<br />
t<br />
0<br />
Height<br />
feet<br />
2<br />
4<br />
6<br />
8<br />
8<br />
10<br />
13. Create a graph <strong>of</strong> the model to see the path <strong>of</strong> the ball on the grid below and confirm<br />
your answers above. First, choose your bounds and intervals. Be sure to label your<br />
graph clearly.<br />
Variable quantity Lower bound Upper bound Interval<br />
© 2008 Carnegie Learning, Inc.<br />
(label) (units)<br />
(label)<br />
(units)<br />
Chapter 8 ■ Assignments 141
8<br />
© 2008 Carnegie Learning, Inc.<br />
142 Chapter 8 ■ Assignments
Assignment<br />
Assignment for Lesson 8.8<br />
Name ___________________________________________________<br />
Date _____________________<br />
Viewing the Night Sky<br />
Using Quadratic Functions<br />
Using the information from the scenario in Lesson 8.8, consider another telescope.<br />
This telescope has an aperture <strong>of</strong> 6 inches and a focal length <strong>of</strong> 28 inches.<br />
1. How does the telescope in this situation compare to the telescope in Problem 2 <strong>of</strong><br />
Lesson 8.8? Use a complete sentence in your answer.<br />
8<br />
2. The height <strong>of</strong> the lens in Problem 2 <strong>of</strong> Lesson 8.8 is about 0.040. Predict the height <strong>of</strong> the<br />
lens in this situation. Use complete sentences in your answer.<br />
3. Write the function that represents the lens shape.<br />
4. Complete the table <strong>of</strong> values that shows the shape <strong>of</strong> the lens. Use the domain as a guide<br />
for choosing your x-values. If necessary, round your answers to the nearest thousandth.<br />
© 2008 Carnegie Learning, Inc.<br />
Quantity Name<br />
Unit<br />
Expression<br />
Horizontal position<br />
inches<br />
Height<br />
inches<br />
Chapter 8 ■ Assignments 143
5. What is the range <strong>of</strong> the function? Show all your work and use a complete sentence in<br />
your answer.<br />
6. What is the maximum height <strong>of</strong> this lens? If necessary, round your answer to the nearest<br />
thousandth. Use a complete sentence to explain how you found your answer.<br />
8<br />
7. Create a graph <strong>of</strong> the quadratic function on the grid below. First, choose your bounds and<br />
intervals. Be sure to label to graph clearly.<br />
Variable quantity Lower bound Upper bound Interval<br />
(label) (units)<br />
© 2008 Carnegie Learning, Inc.<br />
(label)<br />
(units)<br />
8. Did the table and graph verify your prediction in Question 2? Use a complete sentence<br />
in your answer.<br />
144 Chapter 8 ■ Assignments
Assignment<br />
Assignment for Lesson 9.1<br />
Name ___________________________________________________<br />
Date _____________________<br />
The Museum <strong>of</strong> Natural History<br />
Powers and Prime Factorization<br />
For each pair <strong>of</strong> numbers, list the common factors.<br />
1. 18 and 56 2. 14 and 42 3. 19 and 81<br />
The Washington Family Reunion is planning its annual s<strong>of</strong>tball tournament. The games are<br />
played for fun, but the organizers still want to make sure the teams are fair. Each team should<br />
have the same number <strong>of</strong> players, and each team should have the same number <strong>of</strong> adults.<br />
This year 12 adults and 54 children want to participate.<br />
4. Can there be three teams competing in the s<strong>of</strong>tball tournament? Use complete sentences<br />
to explain your reasoning.<br />
9<br />
5. Can there be four teams competing in the s<strong>of</strong>tball tournament? Use complete sentences<br />
to explain your reasoning.<br />
6. Can there be five teams competing in the s<strong>of</strong>tball tournament? Use complete sentences<br />
to explain your reasoning.<br />
© 2008 Carnegie Learning, Inc.<br />
7. What are the different-sized teams that are possible for this number <strong>of</strong> adults and<br />
children? Describe the number <strong>of</strong> teams, and the number <strong>of</strong> adults and children on<br />
each team. Use complete sentences in your answer.<br />
8. Which option from Question 7 is the best set-up for the s<strong>of</strong>tball tournament?<br />
Use complete sentences in your answer.<br />
Chapter 9 ■ Assignments 145
9<br />
© 2008 Carnegie Learning, Inc.<br />
146 Chapter 9 ■ Assignments
Assignment<br />
Assignment for Lesson 9.2<br />
Name ___________________________________________________<br />
Date _____________________<br />
Bits and Bytes<br />
Multiplying and Dividing Powers<br />
1. Can you use the rules you developed in Lesson 9.2 to simplify the expressions 6 3 3 4 and<br />
7 6<br />
? Why or why not? Use a complete sentence in your answer.<br />
4 6<br />
Your class is taking a trip to a large city. Your teacher tells you that the population <strong>of</strong> this city is<br />
243 times greater than the population <strong>of</strong> your small town, which is 2187 people.<br />
2. Find the population <strong>of</strong> the large city. Show all your work and use a complete sentence in<br />
your answer.<br />
9<br />
3. Write each factor in the product from Question 2 as a power <strong>of</strong> 3. Then use the rule<br />
from Lesson 9.2 to find the product. Does the product verify your answer to Question 2?<br />
Use a complete sentence in your answer.<br />
4. The population <strong>of</strong> the largest city you have ever been to is 1,594,323 people. How many<br />
times greater is this city’s population than the population <strong>of</strong> your small town? Show all<br />
your work and use a complete sentence in your answer.<br />
© 2008 Carnegie Learning, Inc.<br />
5. Write the numerator and denominator from Question 4 as powers <strong>of</strong> 3. Then use the rule<br />
from Lesson 9.2 to find the quotient. Does the quotient verify your answer to Question 4?<br />
Use a complete sentence in your answer.<br />
Chapter 9 ■ Assignments 147
9<br />
© 2008 Carnegie Learning, Inc.<br />
148 Chapter 9 ■ Assignments
Assignment<br />
Assignment for Lesson 9.3<br />
Name ___________________________________________________<br />
Date _____________________<br />
As Time Goes By<br />
Zero and Negative Exponents<br />
The metric system is <strong>of</strong>ten the preferred system for measuring because <strong>of</strong> the ease with which<br />
conversions can be made. The unit for measuring length is the meter (m).<br />
1. Complete the table below that shows common metric units <strong>of</strong> length.<br />
Unit<br />
Number <strong>of</strong><br />
meters<br />
Number <strong>of</strong> meters<br />
as a power with<br />
a positive exponent<br />
Number <strong>of</strong> meters<br />
as a power with<br />
a negative exponent<br />
Millimeter<br />
Centimeter<br />
1<br />
1000<br />
1<br />
100<br />
Kilometer 1000<br />
9<br />
2. Determine the number <strong>of</strong> meters that are in 100 centimeters. Use a quotient <strong>of</strong> powers<br />
and show all your work.<br />
© 2008 Carnegie Learning, Inc.<br />
3. Determine the number <strong>of</strong> meters there are in 10 centimeters. Use a quotient <strong>of</strong> powers<br />
and show all your work.<br />
4. Determine the number <strong>of</strong> kilometers there are in 10 millimeters. Use a quotient <strong>of</strong> powers<br />
and show all your work.<br />
Chapter 9 ■ Assignments 149
9<br />
© 2008 Carnegie Learning, Inc.<br />
150 Chapter 9 ■ Assignments
Assignment<br />
Assignment for Lesson 9.4<br />
Name ___________________________________________________<br />
Date _____________________<br />
Large and Small Measurements<br />
Scientific Notation<br />
Each <strong>of</strong> the following scenarios include a very large or a very small number. Write<br />
each number in scientific notation.<br />
1. In 2002, the United States public debt was $6,228,000,000,000.<br />
2. There are currently about 7,607,000,000 one-dollar bills in circulation.<br />
3. A mole <strong>of</strong> hydrogen atoms contains 602,200,000,000,000,000,000,000 atoms.<br />
9<br />
4. The mass <strong>of</strong> a hydrogen atom is 0.00000000000000000000000167 kilograms.<br />
5. Pennsylvania’s revenue in the year 2000 was $54,517,000,000.<br />
© 2008 Carnegie Learning, Inc.<br />
6. A computer can perform an addition calculation in 0.00000031 seconds.<br />
7. Every year, about 13,000,000 Americans visit the doctor because <strong>of</strong> back pain.<br />
8. A pollen grain measures 0.0004 meters in diameter.<br />
Chapter 9 ■ Assignments 151
9<br />
© 2008 Carnegie Learning, Inc.<br />
152 Chapter 9 ■ Assignments
Assignment<br />
Assignment for Lesson 9.5<br />
Name ___________________________________________________<br />
Date _____________________<br />
The Beat Goes On<br />
Properties <strong>of</strong> Powers<br />
1. Identify the property that is used in each step to simplify the expression.<br />
(9xy 2 )(2xy) 3 9xy 2 (2 3 x 3 y 3 )<br />
9xy2<br />
2 3 x 3 y 3<br />
9xy2<br />
8x 3 y 3<br />
9<br />
8x 2 y<br />
2. Simplify the expression ( 2x<br />
) 2 . Identify the property that is used in each step.<br />
y ( 10y<br />
4 6x ) 3<br />
9<br />
© 2008 Carnegie Learning, Inc.<br />
Chapter 9 ■ Assignments 153
3. Find the volume <strong>of</strong> the teepee at the right using the formula<br />
for the volume <strong>of</strong> a cone: V 1 , where r is the radius,<br />
3 r 2 h<br />
h is the height, and V is the volume. Show all your work and<br />
use a complete sentence in your answer. Leave your answer in<br />
terms <strong>of</strong> .<br />
4x 2 2x 2<br />
9<br />
© 2008 Carnegie Learning, Inc.<br />
154 Chapter 9 ■ Assignments
Assignment<br />
Assignment for Lesson 9.6<br />
Name ___________________________________________________<br />
Date _____________________<br />
Sailing Away<br />
Radicals and Rational Exponents<br />
Use the following scenario to answer Questions 1 through 3.<br />
The period <strong>of</strong> a pendulum is the time the pendulum takes to complete one full swing.<br />
The period T in seconds can be modeled by T 2l, where l is the pendulum’s length<br />
in meters.<br />
1. What is the period <strong>of</strong> a pendulum that is 0.25 meters long? Show all your work and use a<br />
complete sentence in your answer.<br />
2. What is the period <strong>of</strong> a pendulum that is 2 meters long? Show all your work and use a<br />
complete sentence in your answer.<br />
9<br />
3. How long is a pendulum with a period <strong>of</strong> 2 seconds? Show all your work and use a<br />
complete sentence in your answer.<br />
© 2008 Carnegie Learning, Inc.<br />
4. Write two different expressions <strong>of</strong> the form a 1/n that equal 4, where a is a real number and<br />
n is an integer greater than 1.<br />
5. How do rational exponents help you to multiply or divide two radicals with different<br />
m a<br />
indices ( m a n a or , when m n)? Use complete sentences in your answer and<br />
n a<br />
include two examples to support your answer.<br />
Chapter 9 ■ Assignments 155
9<br />
© 2008 Carnegie Learning, Inc.<br />
156 Chapter 9 ■ Assignments
Assignment<br />
Assignment for Lesson 10.1<br />
Name ___________________________________________________<br />
Date _____________________<br />
Water Balloons<br />
Polynomials and Polynomial Functions<br />
Define each term in your own words.<br />
1. polynomial<br />
2. term <strong>of</strong> a polynomial<br />
3. degree <strong>of</strong> a polynomial<br />
4. Describe how the Vertical Line Test can be used to determine whether a polynomial is a<br />
function. Use complete sentences in your answer.<br />
You use a sling shot and a rock to try to hit an apple on the ground. The rock leaves the sling<br />
shot with an initial velocity <strong>of</strong> 60 feet per second from a height <strong>of</strong> 5 feet <strong>of</strong>f <strong>of</strong> the ground.<br />
5. Use the Vertical Motion Model to write an equation that represents the height <strong>of</strong> the rock<br />
in feet.<br />
10<br />
6. Is your model a polynomial? If so, classify it by its degree and number <strong>of</strong> terms.<br />
© 2008 Carnegie Learning, Inc.<br />
7. Identify each <strong>of</strong> the coefficients in your model.<br />
8. What is the height <strong>of</strong> the rock after 1 second? What is the height <strong>of</strong> the rock after<br />
2 seconds? What is the height <strong>of</strong> the rock after 4 seconds? Show all your work and<br />
use a complete sentence in your answer.<br />
Chapter 10 ■ Assignments 157
9. Complete the table <strong>of</strong> values that shows the height <strong>of</strong> the rock in terms <strong>of</strong> time.<br />
Quantity Name<br />
Unit<br />
Expression<br />
Time<br />
1.0<br />
2.0<br />
2.5<br />
3.0<br />
Height<br />
10. Create a graph <strong>of</strong> the model to see the path <strong>of</strong> the rock on the grid below.<br />
First, choose your bounds and intervals. Be sure to label your graph clearly.<br />
Variable quantity Lower bound Upper bound Interval<br />
10<br />
(label) (units)<br />
© 2008 Carnegie Learning, Inc.<br />
(label)<br />
(units)<br />
158 Chapter 10 ■ Assignments
Name ___________________________________________________<br />
Date _____________________<br />
11. Use the graph and table to estimate the maximum height <strong>of</strong> the rock. Use a complete<br />
sentence in your answer.<br />
12. Use the graph and table to estimate the time at which the rock will hit the ground.<br />
Use a complete sentence in your answer.<br />
13. Is the polynomial a function? Use a complete sentence in your answer.<br />
10<br />
© 2008 Carnegie Learning, Inc.<br />
Chapter 10 ■ Assignments 159
10<br />
© 2008 Carnegie Learning, Inc.<br />
160 Chapter 10 ■ Assignments
Assignment<br />
Assignment for Lesson 10.2<br />
Name ___________________________________________________<br />
Date _____________________<br />
Play Ball!<br />
Adding and Subtracting Polynomials<br />
The per person consumption <strong>of</strong> whole milk from 1980 through 2000 can be modeled<br />
by the function y 0.00023x 4 0.011x 3 0.146x 2 0.055x 17.<br />
The per person<br />
consumption <strong>of</strong> reduced fat and skim milk from 1980 through 2000 can be modeled by<br />
the function y 0.00038x 4 0.0166x 3 0.2045x 2 0.295x 10.5. For both functions,<br />
x is the number <strong>of</strong> years since 1980 and y is the per person consumption in gallons.<br />
1. Find the per person consumption <strong>of</strong> both kinds <strong>of</strong> milk in 1990. Show all your work and<br />
use a complete sentence in your answer.<br />
2. Find the total per person consumption <strong>of</strong> milk in gallons in 1990. Show all your work and<br />
use a complete sentence in your answer.<br />
3. Write a function that you could use to find the total per person consumption <strong>of</strong> milk in<br />
gallons in 1990.<br />
10<br />
© 2008 Carnegie Learning, Inc.<br />
4. Use your function in Question 3 to find the total per person consumption <strong>of</strong> milk in 1990.<br />
How does the answer compare to your answer in Question 2? Show all your work and use<br />
a complete sentence in your answer.<br />
5. Write a function that you could use to find how many more gallons <strong>of</strong> reduced fat and<br />
skim milk was consumed per person than whole milk. Show all your work.<br />
Chapter 10 ■ Assignments 161
6. Find how many more gallons <strong>of</strong> reduced fat and skim milk was consumed per person<br />
than whole milk in 1990 using your answers to Questions 1 and 5. How do your answers<br />
compare? Show all your work and use complete sentences in your answer.<br />
Find each sum or difference. Show all your work.<br />
7.<br />
(2x 2 5x 3) (x 2 2x 5)<br />
8.<br />
(3x 4) (2x 1)<br />
10<br />
9.<br />
(4x 3 2x 2 x 1) (x 3 2x 2 1)<br />
10. (7x 3 2x 2 5) (6x 2 4x 7)<br />
© 2008 Carnegie Learning, Inc.<br />
162 Chapter 10 ■ Assignments
Assignment<br />
Assignment for Lesson 10.3<br />
Name ___________________________________________________<br />
Date _____________________<br />
Se Habla Español<br />
Multiplying and Dividing Polynomials<br />
A developer buys a large plot <strong>of</strong> land. She has plans to divide the land<br />
into smaller lots and build houses on them. The houses will be built<br />
in various styles and sizes, but the developer wants to follow certain<br />
guidelines. The base <strong>of</strong> each house will be in the shape <strong>of</strong> a square.<br />
Two optional upgrades are also available. The length <strong>of</strong> the house<br />
can be extended by 8 additional feet for a rec room or the width <strong>of</strong><br />
the house can be extended by 12 feet for a sunroom or the length<br />
and the width <strong>of</strong> the house can be extended.<br />
12 ft<br />
x<br />
House<br />
x<br />
8 ft<br />
Sunroom<br />
Rec<br />
room<br />
1. Write an expression for the length <strong>of</strong> the house, including a rec room.<br />
2. Write an expression for the width <strong>of</strong> the house, including a sunroom.<br />
3. Write a function for the area <strong>of</strong> the base <strong>of</strong> the house, including a rec room and a<br />
sunroom. Show all <strong>of</strong> your work.<br />
© 2008 Carnegie Learning, Inc.<br />
4. Use the diagram above to calculate the area <strong>of</strong> the base <strong>of</strong> the house, including a rec<br />
room and a sunroom, when x is 24 feet. Show all your work and use a complete sentence<br />
in your answer.<br />
5. Use your answer to Question 3 to calculate the area <strong>of</strong> the base <strong>of</strong> the house, including<br />
a rec room and a sunroom, when x is 24 feet. Show all your work and use a complete<br />
sentence in your answer.<br />
10<br />
Chapter 10 ■ Assignments 163
6. How do your answers to Questions 4 and 5 compare? Why is it helpful to compare these<br />
answers? Use complete sentences in your answer.<br />
7. Write an expression for the area <strong>of</strong> the rec room.<br />
8. Write an expression for the area <strong>of</strong> the sunroom.<br />
9. Write a function to find the percent <strong>of</strong> the total area <strong>of</strong> the base <strong>of</strong> the house that is<br />
rec room and sunroom. Show all <strong>of</strong> your work.<br />
10<br />
© 2008 Carnegie Learning, Inc.<br />
164 Chapter 10 ■ Assignments
Assignment<br />
Assignment for Lesson 10.4<br />
Name ___________________________________________________<br />
Date _____________________<br />
Making Stained Glass<br />
Multiplying Binomials<br />
A manufacturer is designing and marketing swimming pools. The exact size <strong>of</strong> the pool varies<br />
depending on the buyer, but the pools are always made so that the ratio <strong>of</strong> the length to the<br />
width is 5:2. Each pool is also designed so that a 5-foot concrete walkway surrounds the pool.<br />
1. Sketch a diagram <strong>of</strong> the pool described in the scenario above.<br />
2. Write an expression for the total length <strong>of</strong> the pool, including the concrete walkway.<br />
3. Write an expression for the total width <strong>of</strong> the pool, including the concrete walkway.<br />
4. Write a function for the total area <strong>of</strong> the pool, including the concrete walkway.<br />
10<br />
© 2008 Carnegie Learning, Inc.<br />
5. Use the FOIL pattern to find the product in Question 4. Show all your work.<br />
Find each product. Show all your work.<br />
6. (2x 5) 2<br />
7. (3x 4)(9x 1)<br />
8. (5x 4)(5x 4)<br />
9. (3x 8) 2<br />
Chapter 10 ■ Assignments 165
10<br />
© 2008 Carnegie Learning, Inc.<br />
166 Chapter 10 ■ Assignments
Assignment<br />
Assignment for Lesson 10.5<br />
Name ___________________________________________________ Date _____________________<br />
Suspension Bridges<br />
Factoring Polynomials<br />
Your local zoo is building a tunnel for a new train ride. The tunnel can be modeled by the<br />
5<br />
function y , where x is the distance in feet from the leftmost point <strong>of</strong> the tunnel<br />
36 x2 5 2 x<br />
and y is the height in feet <strong>of</strong> the tunnel. The train designers want the train to have the maximum<br />
height and width possible but be no more than 10 feet tall.<br />
1. Write and simplify an equation that you can use to find the distance from the leftmost<br />
point <strong>of</strong> the tunnel when the height <strong>of</strong> the tunnel is 10 feet.<br />
2. Multiply the equation in Question 1 by 36 to rewrite the equation with integer coefficients.<br />
3. Use factoring to find the solutions <strong>of</strong> the equation in Question 2.<br />
10<br />
© 2008 Carnegie Learning, Inc.<br />
4. Based on the solutions from Question 3, what is the maximum width for the train?<br />
Use complete sentences in your answer.<br />
Chapter 10 ■ Assignments 167
10<br />
© 2008 Carnegie Learning, Inc.<br />
168 Chapter 10 ■ Assignments
Assignment<br />
Assignment for Lesson 10.6<br />
Name ___________________________________________________<br />
Date _____________________<br />
Swimming Pools<br />
Rational Expressions<br />
1. Write a rational expression in factored form with a first-degree polynomial in the<br />
numerator, a second-degree polynomial in the denominator, and a domain <strong>of</strong> all<br />
real numbers except 4 and 5.<br />
When packaging products, companies want to use the least amount <strong>of</strong><br />
packaging material possible. Finding the ratio <strong>of</strong> a package’s surface area to its<br />
volume is one way to determine the efficiency <strong>of</strong> the package. The smaller the<br />
ratio, the better the efficiency <strong>of</strong> the package. A company makes a small box to<br />
hold its trial-size trail mix that is shaped like a rectangular prism with a square<br />
base. The company also wants to make a taller version <strong>of</strong> the box for the<br />
family-size trail mix.<br />
x<br />
4<br />
x<br />
x<br />
x<br />
12<br />
2. Find the surface area and volume <strong>of</strong> each box. Show all your work.<br />
10<br />
© 2008 Carnegie Learning, Inc.<br />
3. Write and simplify the ratio <strong>of</strong> the surface area to the volume, or the efficiency ratio,<br />
for each box. Show all your work.<br />
Chapter 10 ■ Assignments 169
4. Divide the efficiency ratio for the trial-size box by the efficiency ratio for the family-size<br />
box. Do not leave the resulting rational expression in factored form. Show all your work.<br />
5. Compare the numerator and denominator <strong>of</strong> the rational expression in Question 4.<br />
From your comparison, is the value <strong>of</strong> rational expression less than or greater than 1?<br />
Use a complete sentence to explain your answer.<br />
6. Use your answer to Question 5 to determine which trail mix box is more efficient.<br />
Use a complete sentence to explain your answer.<br />
10<br />
Find each sum or difference. Show all your work and leave your answer in<br />
simplified form.<br />
9<br />
7. 8.<br />
5x 5 8x<br />
10<br />
2x 2 3 7x<br />
© 2008 Carnegie Learning, Inc.<br />
9. Find the least common multiple <strong>of</strong> 4x and 4(x 9) . Use a complete sentence in<br />
your answer.<br />
170 Chapter 10 ■ Assignments
Assignment<br />
Assignment for Lesson 11.1<br />
Name ___________________________________________________<br />
Date _____________________<br />
Your Best Guess<br />
Introduction to Probability<br />
1. In your own words, explain the difference between the probability <strong>of</strong> an event and the<br />
odds in favor <strong>of</strong> an event. Use complete sentences in your answer.<br />
2. What does it mean for an event to have a probability <strong>of</strong> 0? What does it mean for an event<br />
to have a probability <strong>of</strong> 1? Use complete sentences in your answer.<br />
3. List several real-life situations where it would be helpful for you to have an understanding<br />
<strong>of</strong> probability.<br />
A local weather forecaster has some bad news for the region. Based on historic data, she<br />
predicts that in April there will be 10 snowy days, 6 rainy days, 8 cloudy days, and 6 clear,<br />
sunny days.<br />
© 2008 Carnegie Learning, Inc.<br />
4. Your big s<strong>of</strong>tball game is planned for April. What is the probability that you will have a<br />
clear, sunny day for the game? What are the odds that you will have a clear, sunny day<br />
for the game? Show all your work and use complete sentences in your answer.<br />
11<br />
Chapter 11 ■ Assignments 171
5. Nothing makes your younger brother happier than splashing around in the mud puddles<br />
after a rainy day. What is the probability that any given day in April will be rainy? What are<br />
the odds that any given day in April will be rainy? Show all your work and use complete<br />
sentences in your answer.<br />
6. Snowy days are not always a bad thing, because you can go sledding. What is the<br />
probability that you have a snowy day to go sledding on a given day in April? What are<br />
the odds that you have a snowy day to go sledding on any given day in April? Show all<br />
your work and use complete sentences in your answer.<br />
11<br />
© 2008 Carnegie Learning, Inc.<br />
172 Chapter 11 ■ Assignments
Assignment<br />
Assignment for Lesson 11.2<br />
Name ___________________________________________________<br />
Date _____________________<br />
What’s in the Bag?<br />
Theoretical and Experimental Probabilities<br />
1. In your own words, explain the difference between experimental and theoretical probability.<br />
Use complete sentences in your answer.<br />
2. A bag contains 3 red marbles, 5 blue marbles, 8 yellow marbles, and 4 black marbles.<br />
What is the theoretical probability <strong>of</strong> randomly picking each color marble?<br />
3. Perform an experiment by flipping a coin 10, 20, 30, 40, and then 50 times. Record the<br />
theoretical results and your experimental results in the table below.<br />
Number <strong>of</strong> Coin Flips<br />
10<br />
20<br />
30<br />
Expected Number <strong>of</strong> Tails<br />
(Theoretical)<br />
Actual Number <strong>of</strong> Tails<br />
(Experimental)<br />
© 2008 Carnegie Learning, Inc.<br />
40<br />
50<br />
4. Are the theoretical results always the same as your experimental results in the experiment<br />
in Question 3? Use a complete sentence in your answer.<br />
11<br />
5. Compare the theoretical and experimental probabilities for your experiment in Question 3.<br />
What can you conclude? Use a complete sentence in your answer.<br />
Chapter 11 ■ Assignments 173
Extension: Design Your Own Experiment<br />
Design your own experiment to test how closely experimental probability compares to<br />
theoretical probability. The questions below will help guide you through the experiment.<br />
6. Describe your experiment. Use complete sentences.<br />
7. What materials will you need (for instance, marbles, number cubes, coins, scraps <strong>of</strong> paper)?<br />
8. Create a table that will help you organize your data.<br />
11<br />
9. Calculate the theoretical probability <strong>of</strong> your event. Show all your work.<br />
© 2008 Carnegie Learning, Inc.<br />
10. How does the experimental probability compare with the theoretical probability? Use<br />
complete sentences in your answer.<br />
174 Chapter 11 ■ Assignments
Assignment<br />
Assignment for Lesson 11.3<br />
Name ___________________________________________________<br />
Date _____________________<br />
A Brand New Bag<br />
Using Probabilities to Make Predictions<br />
Your sock drawer is a mess! You just shove all <strong>of</strong> your socks into the drawer without<br />
worrying about finding matches. Your aunt asks you how many pairs <strong>of</strong> each color you have.<br />
You know that you have a total <strong>of</strong> 32 pairs <strong>of</strong> socks, or 64 individual socks, in four different<br />
colors: white, blue, black, and tan. You do not want to count all <strong>of</strong> your socks, so you decide<br />
to randomly pick 20 socks and predict the number <strong>of</strong> each color from your results. Your results<br />
are shown in the table below.<br />
Sock color white blue black tan<br />
Number <strong>of</strong> socks 12 1 3 4<br />
1. What is the experimental probability <strong>of</strong> choosing each color <strong>of</strong> sock? Use complete<br />
sentences in your answer.<br />
2. Based on your experiment, how many <strong>of</strong> each color sock do you think is in the drawer?<br />
Show all your work and use a complete sentence in your answer.<br />
© 2008 Carnegie Learning, Inc.<br />
3. Based on your answers in Question 2, how many pairs <strong>of</strong> each color sock are in the<br />
drawer? Use a complete sentence in your answer.<br />
11<br />
Chapter 11 ■ Assignments 175
4. Your drawer actually contains 16 pairs <strong>of</strong> white socks, 2 pairs <strong>of</strong> blue socks, 6 pairs <strong>of</strong><br />
black socks, and 8 pairs <strong>of</strong> tan socks. How accurate was your prediction in Question 3?<br />
5. How could you increase the accuracy <strong>of</strong> your prediction? Use a complete sentence in<br />
your answer.<br />
6. Would it make sense to perform 100 trials <strong>of</strong> this experiment? Use complete sentences in<br />
your answer.<br />
11<br />
© 2008 Carnegie Learning, Inc.<br />
176 Chapter 11 ■ Assignments
Assignment<br />
Assignment for Lesson 11.4<br />
Name ___________________________________________________<br />
Date _____________________<br />
Fun with Number Cubes<br />
Graphing Frequencies <strong>of</strong> Outcomes<br />
You are playing a game that involves spinning two different spinners and moving around a<br />
board. Each spinner is divided into five equal regions labeled 1, 2, 3, 4, and 5. For each turn,<br />
you spin both spinners and add the two resulting numbers to see how many spaces you will<br />
move around the board.<br />
1. What is the maximum number <strong>of</strong> spaces that you can move on one turn?<br />
2. What is the minimum number <strong>of</strong> spaces that you can move on one turn?<br />
3. Complete the table below to show the total number <strong>of</strong> spaces that you will move if each<br />
spinner lands on the indicated number.<br />
First spinner<br />
1 2 3 4 5<br />
© 2008 Carnegie Learning, Inc.<br />
Second spinner<br />
1<br />
2<br />
3<br />
4<br />
5<br />
4. Create a line plot based on the results from the table in Question 3.<br />
11<br />
Chapter 11 ■ Assignments 177
5. If you spin a sum <strong>of</strong> 6 on your next turn, you will lose a turn. If you spin a sum <strong>of</strong> 7,<br />
you will win the game. Which outcome is more likely? Find the probability <strong>of</strong> each and<br />
use a complete sentence in your answer.<br />
6. On your next turn, what is the probability that you will move 4 spaces?<br />
7. On your next turn, what is the most likely number <strong>of</strong> spaces that you will move? How do<br />
you know? Use complete sentences in your answer.<br />
11<br />
© 2008 Carnegie Learning, Inc.<br />
178 Chapter 11 ■ Assignments
Assignment<br />
Assignment for Lesson 11.5<br />
Name ___________________________________________________<br />
Date _____________________<br />
Going to the Movies<br />
Counting and Permutations<br />
Simplify each expression by first writing each factorial as a product.<br />
1. 4! 2.<br />
4!2!<br />
3!<br />
10!<br />
3. 4.<br />
8!<br />
6!<br />
7!<br />
5. You look in your closet and see that you have 4 different pairs <strong>of</strong> jeans and 3 different<br />
belts. How many different jean and belt combinations do you have? Show all your work<br />
and use a complete sentence in your answer.<br />
© 2008 Carnegie Learning, Inc.<br />
6. A local fast-food restaurant is selling meal combinations for $3.99. Each meal includes a<br />
sandwich, a side dish, and a drink. If the restaurant has 6 sandwich options, 4 side dish<br />
options, and 3 drink options, how many different meal combinations can the restaurant<br />
<strong>of</strong>fer? Show all your work and use a complete sentence in your answer.<br />
7. A computer manufacturer is refurbishing old monitors, keyboards, and CPUs. They have<br />
5 types <strong>of</strong> monitors, 1 type <strong>of</strong> keyboard, and 2 types <strong>of</strong> CPUs. How many different computer<br />
combinations can the manufacturer <strong>of</strong>fer? Show all your work and use a complete<br />
sentence in your answer.<br />
11<br />
Chapter 11 ■ Assignments 179
Your baby sister is playing with four different lettered blocks. The letters on the blocks are<br />
E, B, R, and A. She is unable to read, so she is unable to consciously spell words.<br />
8. How many possible words can she spell? What are they?<br />
9. How many different ways can she arrange the lettered blocks? Show all your work and<br />
use a complete sentence in your answer.<br />
10. What is the probability that your sister will randomly spell a word? Show all your work and<br />
use a complete sentence in your answer.<br />
11<br />
© 2008 Carnegie Learning, Inc.<br />
180 Chapter 11 ■ Assignments
Assignment<br />
Assignment for Lesson 11.6<br />
Name ___________________________________________________<br />
Date _____________________<br />
Going Out for Pizza<br />
Permutations and Combinations<br />
Find the value <strong>of</strong> each expression. Show all your work.<br />
1. 5 P 3 2. 6 C 4<br />
3. The principal is choosing four students to be recognized on the evening news for winning<br />
awards in a Martin Luther King essay contest. Seven students from your school actually<br />
won honorable mention awards for their essays. Find the number <strong>of</strong> different groups <strong>of</strong><br />
students that can appear on the evening news. Show all your work and use a complete<br />
sentence in your answer.<br />
© 2008 Carnegie Learning, Inc.<br />
4. A wedding planner must decide how to seat some <strong>of</strong> a bride’s family members. Six seats<br />
are left in the front row and eight family members still need to be seated. Find how many<br />
different seating arrangements are possible for the front row. Show all your work and use<br />
a complete sentence in your answer.<br />
11<br />
Chapter 11 ■ Assignments 181
5. Describe two real-life counting scenarios, one that would use permutations and one that<br />
would use combinations. Use complete sentences in your answer.<br />
11<br />
© 2008 Carnegie Learning, Inc.<br />
182 Chapter 11 ■ Assignments
Assignment<br />
Assignment for Lesson 11.7<br />
Name ___________________________________________________<br />
Date _____________________<br />
Picking Out Socks<br />
Independent and Dependent Events<br />
Determine whether each <strong>of</strong> the compound events are independent or dependent.<br />
1. You roll two six-sided number cubes and get a 4 and a 5.<br />
2. You draw an ace out <strong>of</strong> a standard deck <strong>of</strong> cards and then, without replacing the card,<br />
draw another ace.<br />
3. You randomly choose a blue marble from a bag, and then randomly choose a red marble<br />
after replacing the first one.<br />
You and your best friend are picking plastic colored eggs out <strong>of</strong> a basket. A total <strong>of</strong> 10 eggs are<br />
in the basket. Only three <strong>of</strong> the eggs are filled with gift certificate prizes.<br />
4. You choose an egg first. What is the probability that you will choose one <strong>of</strong> the prizefilled<br />
eggs?<br />
© 2008 Carnegie Learning, Inc.<br />
5. Suppose you chose a prize-filled egg. What is the probability that your friend will also<br />
choose a prize-filled egg?<br />
6. What is the probability that you and your friend will each choose a prize-filled egg?<br />
Show all your work and use a complete sentence in your answer.<br />
11<br />
Chapter 11 ■ Assignments 183
7. Your favorite restaurant <strong>of</strong>fers 3 types <strong>of</strong> burgers and 4 kinds <strong>of</strong> sodas. Your sister says<br />
that she will pick something up for you on her way home. What is the probability that she<br />
will choose both your favorite burger and your favorite soda? Show all your work and use<br />
a complete sentence in your answer.<br />
8. If you are rolling two different six-sided number cubes, what is the probability that you will<br />
roll two sixes? Show all your work and use a complete sentence in your answer.<br />
9. Your name is placed in a jar with 14 other names for a raffle. If your name is chosen, you<br />
will then spin a spinner to determine the prize that you will receive. The spinner is divided<br />
into six equal regions. Each region has a different prize listed on it, and the one grand<br />
prize is a laptop computer. What is the probability that your name will be chosen and you<br />
will win the grand prize? Show all your work and use a complete sentence in your answer.<br />
11<br />
10. You randomly choose four cards from a standard deck <strong>of</strong> cards without replacement.<br />
What is the probability that you will choose four aces? Show all your work and use a<br />
complete sentence in your answer.<br />
© 2008 Carnegie Learning, Inc.<br />
184 Chapter 11 ■ Assignments
Assignment<br />
Assignment for Lesson 11.8<br />
Name ___________________________________________________<br />
Date _____________________<br />
Probability on the Shuffleboard Court<br />
Geometric Probability<br />
1. Find the area <strong>of</strong> an 8.5-inch by 11-inch sheet <strong>of</strong> paper. Show your work and use a<br />
complete sentence in your answer.<br />
2. Draw a 3-inch square “bull’s-eye” in the center <strong>of</strong> your sheet <strong>of</strong> paper. What is the area <strong>of</strong><br />
the square? Show all your work and use a complete sentence in your answer.<br />
3. If you were to randomly drop an object onto the sheet <strong>of</strong> paper 10 times, approximately<br />
how many times would you expect it to land in the “bull’s-eye?” (Assume that it always<br />
lands on the paper.) Use complete sentences to explain your reasoning.<br />
© 2008 Carnegie Learning, Inc.<br />
4. If you were to randomly drop an object onto the sheet <strong>of</strong> paper 20 times, approximately<br />
how many times would you expect it to land in the “bull’s-eye?” (Assume that it always<br />
lands on the paper.) Use complete sentences to explain your reasoning.<br />
5. If you were to randomly drop an object onto the sheet <strong>of</strong> paper 300 times, approximately<br />
how many times would you expect it to land in the “bull’s-eye?”(Assume that it always<br />
lands on the paper.) Use complete sentences to explain your reasoning.<br />
11<br />
Chapter 11 ■ Assignments 185
6. Perform an experiment to test your answers. Draw a 3-inch square in the center <strong>of</strong> a sheet<br />
<strong>of</strong> paper. With your eyes closed, drop a paper clip from a height <strong>of</strong> about 2 feet onto the<br />
paper 10 times. How many times does it land in the “bull’s-eye?”<br />
7. Drop a paper clip 10 more times for a total <strong>of</strong> 20 trials. How many times does it land in the<br />
“bull’s-eye?”<br />
8. Compare the experimental probability from Questions 6 and 7 with the theoretical<br />
probability in Questions 3 and 4? Use a complete sentence in your answer.<br />
9. Do you think this experiment can accurately test geometric probability? Why or why not?<br />
Use complete sentences in your answer.<br />
11<br />
© 2008 Carnegie Learning, Inc.<br />
186 Chapter 11 ■ Assignments
Assignment<br />
Assignment for Lesson 11.9<br />
Name ___________________________________________________<br />
Date _____________________<br />
Game Design<br />
Geometric Probabilities and Fair Games<br />
You and your friends create a game for game night that is played with two number cubes.<br />
The game board consists <strong>of</strong> twenty spaces arranged in a square. On each player’s turn, he or<br />
she rolls the number cubes. If the player rolls a sum <strong>of</strong> 7 or “doubles” (the same number on<br />
each cube), he or she moves forward two spaces. If the player does not roll 7 or “doubles,”<br />
he or she moves back one space. The player to cross the finish line first wins the game.<br />
1. Complete the following table <strong>of</strong> possible number cube rolls. Circle all rolls that would<br />
result in a forward move.<br />
1 2 3 4 5 6<br />
1<br />
2<br />
3<br />
4<br />
5<br />
6<br />
2. What is the probability that a roll will result in a forward move? Show all your work and<br />
use a complete sentence in your answer.<br />
© 2008 Carnegie Learning, Inc.<br />
3. What is the probability that a roll will result in a backward move? Show all your work and<br />
use a complete sentence in your answer.<br />
11<br />
4. If you roll the number cubes 15 times, how many <strong>of</strong> those rolls will likely result in a<br />
forward move? Show all your work and use a complete sentence in your answer.<br />
Chapter 11 ■ Assignments 187
5. How many spaces will you move forward as a result <strong>of</strong> the 15 rolls in Question 4?<br />
Show all your work and use a complete sentence in your answer.<br />
6. If you roll the number cubes 15 times, how many <strong>of</strong> those rolls will likely result in a backward<br />
move? Show all your work and use a complete sentence in your answer.<br />
7. How many spaces will you move backwards as a result <strong>of</strong> the 15 rolls in Question 6?<br />
Show all your work and use a complete sentence in your answer.<br />
8. Is this a fair game? Why or why not? Use a complete sentence in your answer.<br />
11<br />
© 2008 Carnegie Learning, Inc.<br />
188 Chapter 11 ■ Assignments
Assignment<br />
Assignment for Lesson 12.1<br />
Name ___________________________________________________<br />
Date _____________________<br />
Taking the PSAT<br />
Measures <strong>of</strong> Central Tendency<br />
Define each term in your own words.<br />
1. mean<br />
2. median<br />
3. mode<br />
The data below show the test scores for a ninth grade Algebra class. Jessica received a score<br />
<strong>of</strong> 71% on the test. She wants to analyze the data to see how her score compares to the<br />
scores <strong>of</strong> the rest <strong>of</strong> students in the class.<br />
Ninth grade Algebra test scores: 61, 55, 71, 84, 58, 93, 82, 91, 47, 88, 84, 65, 46, 61, 84, 55,<br />
69, 67, 73, 63, 37, 67, 72, 75, 73, 74, 95, 82, 73, 71<br />
4. Create a stem-and-leaf plot <strong>of</strong> the data.<br />
3 7 | 1 = ______<br />
4<br />
5<br />
6<br />
7<br />
8<br />
© 2008 Carnegie Learning, Inc.<br />
9<br />
5. What information about the data set can easily be seen after creating the stem-and-leaf<br />
plot? Use complete sentences in your answer.<br />
6. Describe the distribution <strong>of</strong> the data. Use a complete sentence in your answer.<br />
12<br />
Chapter 12 ■ Assignments 189
7. Analyze the data by finding the mean, median, and mode <strong>of</strong> the test scores. Use complete<br />
sentences in your answer.<br />
8. Describe how Jessica’s score compares to the scores <strong>of</strong> the rest <strong>of</strong> the students in the<br />
class. Use a complete sentence in your answer.<br />
9. Describe a real-life data set for which the median is a much better representation <strong>of</strong> the<br />
data set than the mean. Use complete sentences in your answer.<br />
© 2008 Carnegie Learning, Inc.<br />
12<br />
190 Chapter 12 ■ Assignments
Assignment<br />
Assignment for Lesson 12.2<br />
Name ___________________________________________________<br />
Date _____________________<br />
Compact Discs<br />
Collecting and Analyzing Data<br />
1. Given the data set below, your friend incorrectly states that the median is 111.<br />
Use a complete sentence to explain and correct your friend’s mistake.<br />
313, 415, 111, 111, 612<br />
Ask six different people in your school, including at least one adult if possible, to rate five<br />
different school subjects based on the scale below:<br />
This is one <strong>of</strong> my favorite subjects. 9–10<br />
I usually like this subject. 7–8<br />
This subject is OK. 5–6<br />
I usually dislike this subject. 3–4<br />
This is one <strong>of</strong> my least favorite subjects. 1–2<br />
2. Record the responses in the table below.<br />
<strong>School</strong> subject<br />
Reviewer 1<br />
rating<br />
© 2008 Carnegie Learning, Inc.<br />
Reviewer 2<br />
rating<br />
Reviewer 3<br />
rating<br />
Reviewer 4<br />
rating<br />
Reviewer 5<br />
rating<br />
Reviewer 6<br />
rating<br />
12<br />
Chapter 12 ■ Assignments 191
3. Find the mean and median rating for each school subject. Record these measures <strong>of</strong><br />
central tendency in the table below.<br />
<strong>School</strong> subject Mean rating Median rating<br />
4. Are the mean rating and the median rating close together for any <strong>of</strong> the subjects?<br />
Use a complete sentence in your answer.<br />
5. In each case, which measure <strong>of</strong> central tendency is more representative <strong>of</strong> the overall<br />
rating <strong>of</strong> the subject? Why? Use a complete sentence in your answer.<br />
6. Although a sample size <strong>of</strong> six is not really large enough to accurately represent the<br />
opinions <strong>of</strong> the students and staff at your school, what is one way you can try to<br />
make your survey as accurate as it can be? Use a complete sentence in your answer.<br />
© 2008 Carnegie Learning, Inc.<br />
12<br />
192 Chapter 12 ■ Assignments
Assignment<br />
Assignment for Lesson 12.3<br />
Name ___________________________________________________<br />
Date _____________________<br />
Breakfast Cereals<br />
Quartiles and Box-and-Whisker Plots<br />
The table below shows the number <strong>of</strong> home runs hit by Babe Ruth for each <strong>of</strong> the 15 years<br />
he played for the New York Yankees.<br />
Years Home runs Years Home runs<br />
1920 54 1928 54<br />
1921 59 1929 46<br />
1922 35 1930 49<br />
1923 41 1931 46<br />
1924 46 1932 41<br />
1925 25 1933 34<br />
1926 47 1934 22<br />
1927 60<br />
1. Use the home run data to complete the table below.<br />
Lower extreme<br />
First quartile, Q 1<br />
Second quartile, Q 2<br />
Third quartile, Q 3<br />
© 2008 Carnegie Learning, Inc.<br />
Upper extreme<br />
2. Use the information from the table in Question 1 to create a box-and-whisker plot.<br />
3. Find the interquartile range for the home run data. Use a complete sentence in<br />
your answer.<br />
4. Are there any data values that you would consider to be outliers? Why or why not?<br />
Use a complete sentence in your answer.<br />
12<br />
Chapter 12 ■ Assignments 193
© 2008 Carnegie Learning, Inc.<br />
12<br />
194 Chapter 12 ■ Assignments
Assignment<br />
Assignment for Lesson 12.4<br />
Name ___________________________________________________<br />
Date _____________________<br />
Home Team Advantage?<br />
Sample Variance and Standard Deviation<br />
The table below shows how long patients had to wait to see each <strong>of</strong> two dentists who<br />
practice together.<br />
Dr. Kent’s wait times<br />
(minutes)<br />
Dr. Mendoza’s wait times<br />
(minutes)<br />
5 21 18 30 19 42 17 18 36 20 19<br />
20 45 6 19 18 5 40 39 21 44 8<br />
1. Find the mean and the range <strong>of</strong> each data set. Show all your work and use complete<br />
sentences in your answer.<br />
© 2008 Carnegie Learning, Inc.<br />
2. Can you draw any conclusions about the wait times from the mean and the range?<br />
Why or why not? Use a complete sentence in your answer.<br />
3. How do you find the deviation <strong>of</strong> the set <strong>of</strong> data? Use a complete sentence in<br />
your answer.<br />
12<br />
Chapter 12 ■ Assignments 195
4. Complete the table below. Round to the nearest tenth, if necessary.<br />
Dr. Kent’s<br />
wait times<br />
(minutes)<br />
Deviation<br />
Square <strong>of</strong><br />
deviation<br />
Dr. Mendoza’s<br />
wait times<br />
(minutes)<br />
Deviation<br />
Square <strong>of</strong><br />
deviation<br />
5<br />
20<br />
21<br />
45<br />
18<br />
6<br />
30<br />
19<br />
19<br />
18<br />
42<br />
5<br />
17<br />
40<br />
18<br />
39<br />
36<br />
21<br />
20<br />
44<br />
19<br />
8<br />
5. Find the variance <strong>of</strong> the data for each dentist. Why is this information useful?<br />
Use complete sentences in your answer.<br />
6. Find the sample variance for each dentist. Show all your work.<br />
7. Find the standard deviation for each dentist. Show all your work. Round your answers to<br />
the nearest hundredth.<br />
© 2008 Carnegie Learning, Inc.<br />
12<br />
196 Chapter 12 ■ Assignments
Name ___________________________________________________<br />
Date _____________________<br />
8. If you were a patient who desires the shortest wait possible, which dentist would you<br />
choose? Use complete sentences <strong>of</strong> explain your answer.<br />
© 2008 Carnegie Learning, Inc.<br />
12<br />
Chapter 12 ■ Assignments 197
© 2008 Carnegie Learning, Inc.<br />
12<br />
198 Chapter 12 ■ Assignments
Assignment<br />
Assignment for Lesson 13.1<br />
Name ___________________________________________________<br />
Solid Carpentry<br />
The Pythagorean Theorem and Its Converse<br />
1. Tracks are being built along a large hill so that commuters can<br />
ride cable cars as they travel up and down the hill to and from work.<br />
What distance will the cable cars travel down the hill? Show all your<br />
work and use a complete sentence in your answer.<br />
Date _____________________<br />
13<br />
300 ft<br />
c ft<br />
150 ft<br />
2. In baseball, the distance between each base is 90 feet.<br />
A runner on first base is attempting to steal second base.<br />
What is the distance that the catcher must throw the ball<br />
from home plate to second base? Label the diagram to<br />
illustrate the problem. Show all your work and use a<br />
complete sentence in your answer.<br />
© 2008 Carnegie Learning, Inc.<br />
3. A carpenter places a 10-foot ladder against a wall so that the base <strong>of</strong><br />
the ladder is 3 feet from the wall. How high up the wall does the ladder<br />
extend? Draw and label a diagram. Show all your work and use a<br />
complete sentence in your answer.<br />
Chapter 13 ■ Assignments 199
13<br />
4. If you know that two sides <strong>of</strong> a right triangle have lengths 3 and 4, do you necessarily<br />
know the length <strong>of</strong> the third side? Use complete sentences to explain your reasoning.<br />
5. Write your own word problem that can be solved using the Pythagorean Theorem. Solve<br />
your problem. Show all your work and use a complete sentence in your answer.<br />
© 2008 Carnegie Learning, Inc.<br />
200 Chapter 13 ■ Assignments
Assignment<br />
Assignment for Lesson 13.2<br />
Name ___________________________________________________<br />
Location, Location, Location<br />
The Distance and Midpoint Formulas<br />
Date _____________________<br />
Upon leaving your house, you travel 2 miles east to a park. After spending some time in the<br />
park, you travel 3 miles north to visit a friend.<br />
13<br />
1. Suppose the coordinates <strong>of</strong> your house are (0, 0). What are the coordinates in miles for<br />
the park?<br />
2. What are the coordinates in miles <strong>of</strong> your friend’s house?<br />
3. What was the total distance that you traveled from your house to the park and then to<br />
your friend’s house?<br />
4. Use the distance formula to find the distance from your house to your friend’s house.<br />
Round your answer to nearest tenth, if necessary. Show all your work and use a complete<br />
sentence in your answer.<br />
© 2008 Carnegie Learning, Inc.<br />
5. Could you have also used the Pythagorean Theorem to solve Question 4? Explain the<br />
relationship between the Pythagorean Theorem and the Distance Formula.<br />
Chapter 13 ■ Assignments 201
13<br />
6. Your school is located exactly halfway between your house and your friend’s house.<br />
What are the coordinates in miles <strong>of</strong> your school? Show all your work and use a complete<br />
sentence in your answer.<br />
Find the distance between each pair <strong>of</strong> points. Then find the midpoint <strong>of</strong> the line<br />
segment that has the given points as its endpoints. Round your answer to the<br />
nearest tenth, if necessary.<br />
7. (4, 3) and (8, 5) 8. (–2, 4) and (0, 6))<br />
9. (–10, –10) and (10, 10) 10. (2, 3) and (–4, –7)<br />
© 2008 Carnegie Learning, Inc.<br />
202 Chapter 13 ■ Assignments
Assignment<br />
Assignment for Lesson 13.3<br />
Name ___________________________________________________<br />
Date _____________________<br />
“Old” Mathematics<br />
Completing the Square and Deriving the Quadratic Formula<br />
13<br />
Factor each trinomial.<br />
1. x 2 4x 4<br />
2. x 2 6x 9<br />
3.<br />
x 2 12x 36<br />
4. x 2 x 1 5. x 2 8x 16<br />
6.<br />
4<br />
x 2 2x 1<br />
Solve each equation by completing the square and then extracting square roots.<br />
Show all your work.<br />
7. x 2 2x 35 0<br />
8.<br />
x 2 6x 5 0<br />
© 2008 Carnegie Learning, Inc.<br />
Decide whether it would be better to solve each equation by completing the<br />
square or by using the quadratic formula. Use complete sentences to explain<br />
your answer.<br />
9.<br />
2x 2 5x 1 0<br />
10. x 2 12x 13 0<br />
Chapter 13 ■ Assignments 203
13<br />
© 2008 Carnegie Learning, Inc.<br />
204 Chapter 13 ■ Assignments
Assignment<br />
Name ___________________________________________________<br />
Learning to Be a Teacher<br />
Vertex Form <strong>of</strong> a Quadratic Equation<br />
Consider the equation y = x 2 – 2x – 3.<br />
1. In which form is the equation given?<br />
Assignment for Lesson 13.4<br />
Date _____________________<br />
13<br />
2. Write the equation in the factored form and vertex form.<br />
3. Does the parabola open up or down?<br />
4. What are the x-intercepts? Which form makes the x-intercepts easy to identify? Use complete<br />
sentences in your answer.<br />
5. What is the y-intercept? Which form makes the y-intercept easy to identify? Use complete<br />
sentences in your answer.<br />
© 2008 Carnegie Learning, Inc.<br />
6. What is the vertex <strong>of</strong> the parabola? Which form makes the vertex easy to identify?<br />
Use complete sentences in your answer.<br />
Chapter 13 ■ Assignments 205
13<br />
7. Graph the equation.<br />
Rewrite each equation in vertex form. Then identify the vertex.<br />
8. y x 2 4x 2<br />
9.<br />
Vertex form: __________________<br />
y x 2 8x<br />
Vertex form: __________________<br />
Vertex: _______________<br />
Vertex: _______________<br />
10. In your own words, describe why it might be useful to be able to convert from standard<br />
form to vertex form to factored form.<br />
© 2008 Carnegie Learning, Inc.<br />
206 Chapter 13 ■ Assignments
Assignment<br />
Name ___________________________________________________<br />
Screen Saver<br />
Graphing by Using Parent Functions<br />
Assignment for Lesson 13.5<br />
Date _____________________<br />
13<br />
Describe each transformation in your own words. Then give an example using the<br />
parent function y = x 2 .<br />
1. translation<br />
2. dilation<br />
3. reflection<br />
For each function below, identify the parent function. Then describe the<br />
transformation on the parent function that will result in the graph <strong>of</strong> the<br />
given function. In some cases, there is more than one kind <strong>of</strong> transformation.<br />
4.<br />
y |x| 4<br />
Parent function: ____________________<br />
Transformation(s): ______________________________________________________________<br />
5.<br />
y 1 (x 3)2<br />
2<br />
Parent function: ____________________<br />
© 2008 Carnegie Learning, Inc.<br />
6.<br />
Transformation(s): ______________________________________________________________<br />
y 1 4 x2<br />
Parent function: ____________________<br />
Transformation(s): ______________________________________________________________<br />
7.<br />
y |x 1| 5<br />
Parent function: ____________________<br />
Transformation(s): ______________________________________________________________<br />
Chapter 13 ■ Assignments 207
13<br />
8. Graph y (x 4) 2 2.<br />
1<br />
9. Challenge A parabola was reflected over the x-axis, stretched by a factor <strong>of</strong> , and<br />
2<br />
shifted 5 units to the left and 4 units down. After the transformations, the equation <strong>of</strong> the<br />
parabola is y 1 . What was the equation <strong>of</strong> the original parabola before<br />
2 (x 2)2 4<br />
the transformations?<br />
© 2008 Carnegie Learning, Inc.<br />
208 Chapter 13 ■ Assignments
Assignment<br />
Assignment for Lesson 13.6<br />
Name ___________________________________________________<br />
Science Fair<br />
Introduction to Exponential Functions<br />
Date _____________________<br />
In an experiment for the science fair at your school, you record the following data for the death<br />
phase <strong>of</strong> bacterial growth.<br />
13<br />
Time since beginning<br />
<strong>of</strong> death phase (in hours)<br />
Number <strong>of</strong> bacteria<br />
Number <strong>of</strong> bacteria<br />
0 4000 4000 ( 1 2 ) 0<br />
1 2000<br />
2 1000<br />
3 500<br />
4 250<br />
© 2008 Carnegie Learning, Inc.<br />
1. Assuming that the bacterial growth continues in this manner, how many bacteria will there<br />
be five hours after the beginning <strong>of</strong> the death phase? Use a complete sentence to explain<br />
how you found your answer.<br />
2. Based on the expression for the 4000 bacteria in the first row <strong>of</strong> the table, write an<br />
expression for each number <strong>of</strong> bacteria. Record your results in the third column <strong>of</strong><br />
the table.<br />
3. Write a function that gives the bacterial growth in terms <strong>of</strong> time. Let y represent the<br />
number <strong>of</strong> bacteria and let x represent the amount <strong>of</strong> time in hours.<br />
Chapter 13 ■ Assignments 209
13<br />
4. Create a graph that shows the bacterial growth as a function <strong>of</strong> time on the grid below.<br />
First, choose your bounds and intervals. Be sure to label your graph clearly.<br />
Variable quantity Lower bound Upper bound Interval<br />
(label) (units)<br />
(label)<br />
y 4000 ( 1 2 ) x<br />
5. What is the y-intercept <strong>of</strong> ? What does the y-intercept represent in the<br />
problem situation? Use a complete sentence in your answer.<br />
y ( 1 2 ) x<br />
6. How is the graph <strong>of</strong> the function different from the graph <strong>of</strong> the function<br />
(units)<br />
y 4000 ( 1 ? Use a complete sentence in your answer.<br />
2 ) x<br />
© 2008 Carnegie Learning, Inc.<br />
210 Chapter 13 ■ Assignments
Assignment<br />
y C(1 r) 1. The general formula for exponential growth is t . For the scenario above,<br />
Assignment for Lesson 13.7<br />
Name ___________________________________________________ Date _____________________<br />
Money Comes and Money Goes<br />
Exponential Growth and Decay<br />
When you were born, your uncle deposited $1000 into an account that he hoped would help<br />
you pay for college. The account compounds annually at a rate <strong>of</strong> 4%.<br />
write a function for the account balance over time and define the variables.<br />
13<br />
2. Complete the table below:<br />
Quantity Name<br />
Unit<br />
Expression<br />
Time<br />
Account balance<br />
© 2008 Carnegie Learning, Inc.<br />
3. Books and a meal plan at a local college are estimated to cost about $2000. When you<br />
start college at the age <strong>of</strong> 18, will your uncle’s account fully cover this expense? Show all<br />
your work and use a complete sentence in your answer.<br />
4. Suppose your uncle had invested only $750 in an account with a higher compound annual<br />
interest rate <strong>of</strong> 5%. Would the account have more or less money when you start college?<br />
Show all <strong>of</strong> your work and use a complete sentence in your answer.<br />
Chapter 13 ■ Assignments 211
13<br />
5. The cost <strong>of</strong> tuition to the college <strong>of</strong> your choice for all 4 years is estimated to be $60,000.<br />
If your uncle wanted to pay your entire tuition by investing in an account that compounded<br />
annually at a rate <strong>of</strong> 4% for 18 years, how much would he have had to initially invest?<br />
Show all your work and use a complete sentence in your answer.<br />
Consumers are <strong>of</strong>ten surprised by how quickly new toys, games, and gadgets become<br />
outdated. A popular computer model claims to depreciate in value at a rate <strong>of</strong> only 20%<br />
each year. The purchase price is approximately $1500.<br />
6. The general formula for exponential decay is y C(1 r) t . For the scenario above,<br />
write a function to represent the value <strong>of</strong> the computer over time and define the variables.<br />
© 2008 Carnegie Learning, Inc.<br />
212 Chapter 13 ■ Assignments
Name ___________________________________________________<br />
Date _____________________<br />
7. Complete the table below.<br />
Quantity Name<br />
Time<br />
Value<br />
13<br />
Unit<br />
Expression<br />
© 2008 Carnegie Learning, Inc.<br />
Chapter 13 ■ Assignments 213
13<br />
8. Create a graph that shows the computer’s value as a function <strong>of</strong> time on the grid below.<br />
First, choose your bounds and intervals. Be sure to label your graph clearly.<br />
Variable quantity Lower bound Upper bound Interval<br />
(label) (units)<br />
(label)<br />
9. Use your graph to determine after what number <strong>of</strong> years the computer’s value will be<br />
$100. Show all your work and use a complete sentence in your answer.<br />
10. According to this model, will the computer ever be valued at $0? Use complete sentences<br />
to explain your reasoning.<br />
(units)<br />
© 2008 Carnegie Learning, Inc.<br />
214 Chapter 13 ■ Assignments
Assignment<br />
Assignment for Lesson 13.8<br />
Name ___________________________________________________<br />
Camping<br />
Special Topic: Logic<br />
Date _____________________<br />
1. In your own words, describe how a mathematical statement is proven using a direct pro<strong>of</strong>.<br />
Use a complete sentence in your answer.<br />
13<br />
2. In your own words, describe how a mathematical statement is proven indirectly. Use a<br />
complete sentence in your answer.<br />
3. In your words, define counterexample. Use a complete sentence in your answer.<br />
Decide whether each statement is true or false. If it is true, provide a pro<strong>of</strong>.<br />
If it is false, provide a counterexample to prove that it is false. Use complete<br />
sentences in your answer.<br />
4. Every time Jonathan goes to Little’s Shoe Store, he buys a pair <strong>of</strong> sneakers. Jonathan<br />
came home with a new pair <strong>of</strong> sneakers, so he must have stopped at Little’s Shoes on his<br />
way home.<br />
© 2008 Carnegie Learning, Inc.<br />
5. a 2 b 2 c 2 is true for all triangles, where a and b are the lengths <strong>of</strong> the smaller sides and<br />
c is the length <strong>of</strong> the largest side.<br />
Chapter 13 ■ Assignments 215
13<br />
6. Given three points A, B, and C on a piece <strong>of</strong> paper, the distance between A and B plus<br />
the distance between B and C equals the distance between A and C.<br />
7. Multiplying two even numbers always results in an even number.<br />
8. Prove the following statement indirectly.<br />
If x is an even number and y is an odd number, then x y is an odd number.<br />
© 2008 Carnegie Learning, Inc.<br />
216 Chapter 13 ■ Assignments