Winter 1992, Volume 17, Number 2 - Association of Schools and ...
Winter 1992, Volume 17, Number 2 - Association of Schools and ...
Winter 1992, Volume 17, Number 2 - Association of Schools and ...

Create successful ePaper yourself
Turn your PDF publications into a flip-book with our unique Google optimized e-Paper software.
For the classroom, the instructor is<br />
free to allow all independent variables<br />
to vary to any values he/she desires.<br />
This introduces another level <strong>of</strong> independent<br />
change in the assignments<br />
to assure individual attention to the<br />
assigned problem by each student.<br />
To convert the spherical mirror<br />
spreadsheet in Figure 2 into one for<br />
problem assignment, the instructor<br />
could add an additional assignment<br />
column for the mirror power. An<br />
example <strong>of</strong> this is shown in Figure<br />
4, where the mirror power has been<br />
added as an additional variable in<br />
column D.<br />
3. Lecture illustrations<br />
The spreadsheets used for class<br />
problem assignments or laboratory<br />
assignments can also produce illustrations<br />
to enhance lecture presentations.<br />
This is achieved by use <strong>of</strong> the<br />
graph facilities that are part <strong>of</strong> every<br />
commercial spreadsheet program.<br />
The graphing functions usually allow<br />
§<br />
©<br />
U<br />
S<br />
w<br />
Q<br />
100<br />
D<br />
i -50-<br />
Thin<br />
Power<br />
the user to plot the ordered pairs <strong>of</strong><br />
data in the spreadsheet columns in<br />
formats <strong>of</strong> bar, pie or xy plots.<br />
Most appropriate for the type <strong>of</strong><br />
spreadsheets likely to be designed for<br />
optics instruction are xy plots. The<br />
data in the independent variable column<br />
would be defined as the x axis<br />
<strong>of</strong> the plot, while the data in the dependent<br />
variable column would be<br />
defined as the y axis <strong>of</strong> the plot. For<br />
the assignment spreadsheets, the independent<br />
variable generated different,<br />
unique numbers for each student<br />
<strong>and</strong> could represent some physical<br />
quantity such as the object position<br />
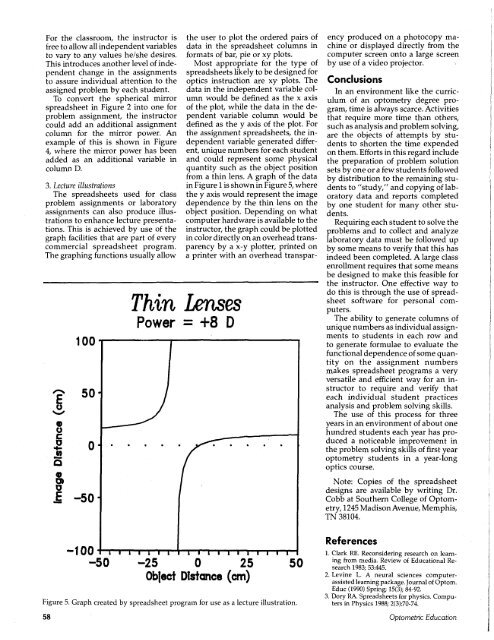
from a thin lens. A graph <strong>of</strong> the data<br />
in Figure 1 is shown in Figure 5, where<br />
the y axis would represent the image<br />
dependence by the thin lens on the<br />
object position. Depending on what<br />
computer hardware is available to the<br />
instructor, the graph could be plotted<br />
in color directly on an overhead transparency<br />
by a x-y plotter, printed on<br />
a printer with an overhead transpar-<br />
Lenses<br />
= +8 D<br />
ency produced on a photocopy machine<br />
or displayed directly from the<br />
computer screen onto a large screen<br />
by use <strong>of</strong> a video projector.<br />
Conclusions<br />
In an environment like the curriculum<br />
<strong>of</strong> an optometry degree program,<br />
time is always scarce. Activities<br />
that require more time than others,<br />
such as analysis <strong>and</strong> problem solving,<br />
are the objects <strong>of</strong> attempts by students<br />
to shorten the time expended<br />
on them. Efforts in this regard include<br />
the preparation <strong>of</strong> problem solution<br />
sets by one or a few students followed<br />
by distribution to the remaining students<br />
to "study," <strong>and</strong> copying <strong>of</strong> laboratory<br />
data <strong>and</strong> reports completed<br />
by one student for many other students.<br />
Requiring each student to solve the<br />
problems <strong>and</strong> to collect <strong>and</strong> analyze<br />
laboratory data must be followed up<br />
by some means to verify that this has<br />
indeed been completed. A large class<br />
enrollment requires that some means<br />
be designed to make this feasible for<br />
the instructor. One effective way to<br />
do this is through the use <strong>of</strong> spreadsheet<br />
s<strong>of</strong>tware for personal computers.<br />
The ability to generate columns <strong>of</strong><br />
unique numbers as individual assignments<br />
to students in each row <strong>and</strong><br />
to generate formulae to evaluate the<br />
functional dependence <strong>of</strong> some quantity<br />
on the assignment numbers<br />
makes spreadsheet programs a very<br />
versatile <strong>and</strong> efficient way for an instructor<br />
to require <strong>and</strong> verify that<br />
each individual student practices<br />
analysis <strong>and</strong> problem solving skills.<br />
The use <strong>of</strong> this process for three<br />
years in an environment <strong>of</strong> about one<br />
hundred students each year has produced<br />
a noticeable improvement in<br />
the problem solving skills <strong>of</strong> first year<br />
optometry students in a year-long<br />
optics course.<br />
Note: Copies <strong>of</strong> the spreadsheet<br />
designs are available by writing Dr.<br />
Cobb at Southern College <strong>of</strong> Optometry,<br />
1245 Madison Avenue, Memphis,<br />
TN 38104.<br />
-100<br />
-25 0 25<br />
Object Distance (cm)<br />
Figure 5. Graph created by spreadsheet program for use as a lecture illustration.<br />
References<br />
1. Clark RE. Reconsidering research on learning<br />
from media. Review <strong>of</strong> Educational Research<br />
1983; 53:445.<br />
2. Levine L. A neural sciences computerassisted<br />
learning package. Journal <strong>of</strong> Optom.<br />
Educ (1990) Spring; 15(3); 84-92.<br />
3. Dory RA. Spreadsheets for physics. Computers<br />
in Physics 1988; 2(3):70-74.<br />
58 Optometric Education