DOGAMI Fact Sheet: New FEMA Flood Maps for Coos County, Oregon
DOGAMI Fact Sheet: New FEMA Flood Maps for Coos County, Oregon
DOGAMI Fact Sheet: New FEMA Flood Maps for Coos County, Oregon

Create successful ePaper yourself
Turn your PDF publications into a flip-book with our unique Google optimized e-Paper software.
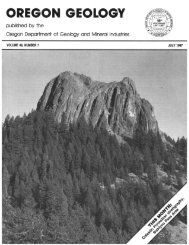
What is lidar?<br />
Examples showing problems with older flood maps and <strong>DOGAMI</strong>’s solutions<br />
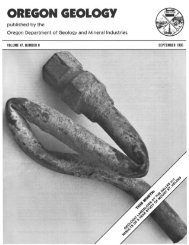
Light detection and ranging (lidar) technology<br />
is revolutionizing the way we see<br />
the earth. The lidar data used to create<br />
the new <strong>FEMA</strong> flood maps by <strong>DOGAMI</strong><br />
were collected from a light aircraft carrying<br />
a highly accurate laser scanner. The<br />
scan<br />
anner makes over<br />
100,000 measurements<br />
each second to build<br />
up<br />
a three-dimensional<br />
“point cloud” model of<br />
the surface of the earth<br />
and the vegetation and<br />
structures on it. A<br />
computer<br />
sor<br />
ts the<br />
points, separating those<br />
that measure the ground from those<br />
that measure other objects such as trees<br />
or buildings. Images derived from these<br />
sets<br />
of points<br />
are<br />
then merged<br />
with other<br />
<strong>for</strong>ms of digital data to create the maps.<br />
Bandon<br />
Public<br />
Library<br />
image source: USGS<br />
1<br />
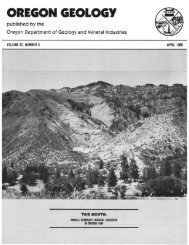
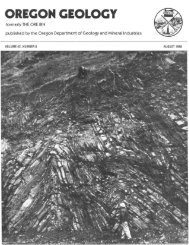
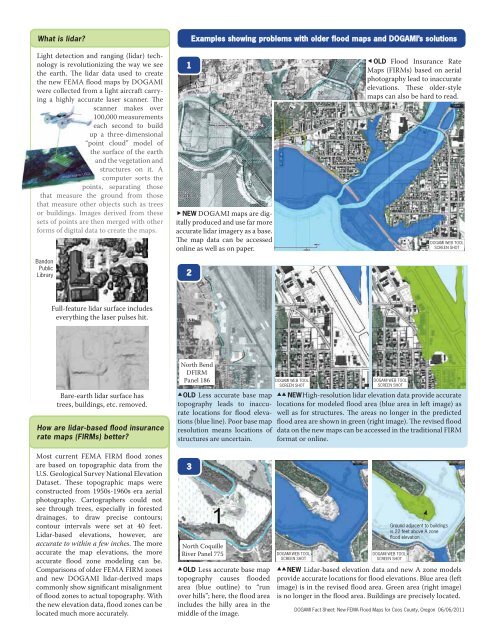
NEW <strong>DOGAMI</strong> maps are digitally<br />
produced and use far more<br />
accurate lidar imagery as a base.<br />
The map data can be accessed<br />
online as well as on paper.<br />
2<br />
OLD <strong>Flood</strong> Insurance Rate<br />
<strong>Maps</strong> (FIRMs) based on aerial<br />
photography lead to inaccurate<br />
elevations. These older-style<br />
maps can also be hard to read.<br />
<strong>DOGAMI</strong> WEB TOOL<br />
SCREEN SHOT<br />
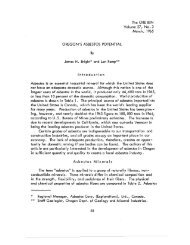
Full-feature lidar surface includes<br />
everything the laser pulses hit.<br />
Bare-earth lidar surface has<br />
trees, buildings, etc. removed.<br />
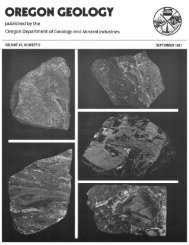
How are lidar-based flood insurance<br />
rate maps (FIRMs) better?<br />
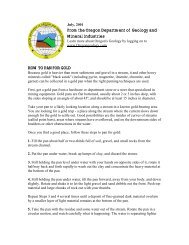
North Bend<br />
DFIRM<br />
Panel 186<br />
OLD Less accurate base map<br />
topography leads to inaccurate<br />
locations <strong>for</strong> flood elevations<br />
(blue line). Poor base map<br />
resolution means locations of<br />
structures are uncertain.<br />
<strong>DOGAMI</strong> WEB TOOL<br />
SCREEN SHOT<br />
<strong>DOGAMI</strong> WEB TOOL<br />
SCREEN SHOT<br />
NEW High-resolution lidar elevation data provide accurate<br />
locations <strong>for</strong> modeled flood area (blue area in left image) as<br />
well as <strong>for</strong> structures. The areas no longer in the predicted<br />
flood area are shown in green (right image). The revised flood<br />
data on the new maps can be accessed in the traditional FIRM<br />
<strong>for</strong>mat or online.<br />
Most current <strong>FEMA</strong> FIRM flood zones<br />
are based on topographic data from the<br />
U.S. Geological Survey National Elevation<br />
Dataset. These topographic maps were<br />
constructed from 1950s-1960s era aerial<br />
photography. Cartographers could not<br />
see through trees, especially in <strong>for</strong>ested<br />
drainages, to draw precise contours;<br />
contour intervals were set at 40 feet.<br />
Lidar-based elevations, however, are<br />
accurate to within a few inches. The more<br />
accurate the map elevations, the more<br />
accurate flood zone modeling can be.<br />
Comparisons of older <strong>FEMA</strong> FIRM zones<br />
and new <strong>DOGAMI</strong> lidar-derived maps<br />
commonly show significant misalignment<br />
of flood zones to actual topography. With<br />
the new elevation data, flood zones can be<br />
located much more accurately.<br />
3<br />
North Coquille<br />
River Panel 775<br />
OLD Less accurate base map<br />
topography causes flooded<br />
area (blue outline) to “run<br />
over hills”; here, the flood area<br />
includes the hilly area in the<br />
middle of the image.<br />
<strong>DOGAMI</strong> WEB TOOL<br />
SCREEN SHOT<br />
Ground adjacent to buildings<br />
is 22 feet above A zone<br />
fl ood elevation<br />
<strong>DOGAMI</strong> WEB TOOL<br />
SCREEN SHOT<br />
NEW Lidar-based elevation data and new A zone models<br />
provide accurate locations <strong>for</strong> flood elevations. Blue area (left<br />
image) is in the revised flood area. Green area (right image)<br />
is no longer in the flood area. Buildings are precisely located.<br />
<strong>DOGAMI</strong> <strong>Fact</strong> <strong>Sheet</strong>: <strong>New</strong> <strong>FEMA</strong> <strong>Flood</strong> <strong>Maps</strong> <strong>for</strong> <strong>Coos</strong> <strong>County</strong>, <strong>Oregon</strong> 06/06/2011