Appendix F - City of Oshawa
Appendix F - City of Oshawa
Appendix F - City of Oshawa

You also want an ePaper? Increase the reach of your titles
YUMPU automatically turns print PDFs into web optimized ePapers that Google loves.
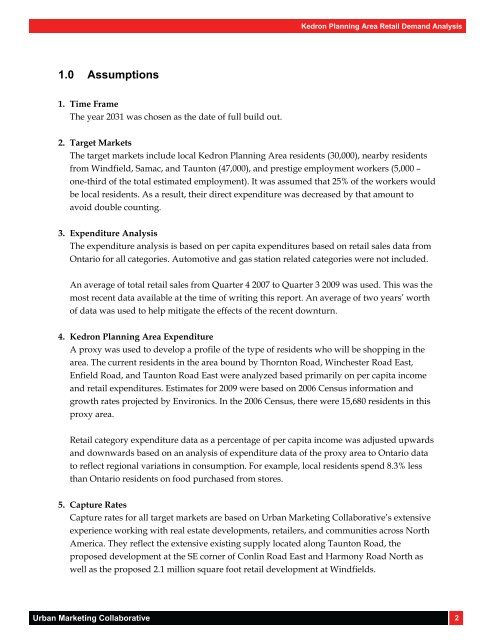
Kedron Planning Area Retail Demand Analysis<br />
1.0 Assumptions<br />
1. Time Frame<br />
The year 2031 was chosen as the date <strong>of</strong> full build out.<br />
2. Target Markets<br />
The target markets include local Kedron Planning Area residents (30,000), nearby residents<br />
from Windfield, Samac, and Taunton (47,000), and prestige employment workers (5,000 –<br />
one-third <strong>of</strong> the total estimated employment). It was assumed that 25% <strong>of</strong> the workers would<br />
be local residents. As a result, their direct expenditure was decreased by that amount to<br />
avoid double counting.<br />
3. Expenditure Analysis<br />
The expenditure analysis is based on per capita expenditures based on retail sales data from<br />
Ontario for all categories. Automotive and gas station related categories were not included.<br />
An average <strong>of</strong> total retail sales from Quarter 4 2007 to Quarter 3 2009 was used. This was the<br />
most recent data available at the time <strong>of</strong> writing this report. An average <strong>of</strong> two years’ worth<br />
<strong>of</strong> data was used to help mitigate the effects <strong>of</strong> the recent downturn.<br />
4. Kedron Planning Area Expenditure<br />
A proxy was used to develop a pr<strong>of</strong>ile <strong>of</strong> the type <strong>of</strong> residents who will be shopping in the<br />
area. The current residents in the area bound by Thornton Road, Winchester Road East,<br />
Enfield Road, and Taunton Road East were analyzed based primarily on per capita income<br />
and retail expenditures. Estimates for 2009 were based on 2006 Census information and<br />
growth rates projected by Environics. In the 2006 Census, there were 15,680 residents in this<br />
proxy area.<br />
Retail category expenditure data as a percentage <strong>of</strong> per capita income was adjusted upwards<br />
and downwards based on an analysis <strong>of</strong> expenditure data <strong>of</strong> the proxy area to Ontario data<br />
to reflect regional variations in consumption. For example, local residents spend 8.3% less<br />
than Ontario residents on food purchased from stores.<br />
5. Capture Rates<br />
Capture rates for all target markets are based on Urban Marketing Collaborative’s extensive<br />
experience working with real estate developments, retailers, and communities across North<br />
America. They reflect the extensive existing supply located along Taunton Road, the<br />
proposed development at the SE corner <strong>of</strong> Conlin Road East and Harmony Road North as<br />
well as the proposed 2.1 million square foot retail development at Windfields.<br />
Urban Marketing Collaborative 2