Estimation of the area of sealed soil using GIS technology and ...
Estimation of the area of sealed soil using GIS technology and ...
Estimation of the area of sealed soil using GIS technology and ...

You also want an ePaper? Increase the reach of your titles
YUMPU automatically turns print PDFs into web optimized ePapers that Google loves.
DATA<br />
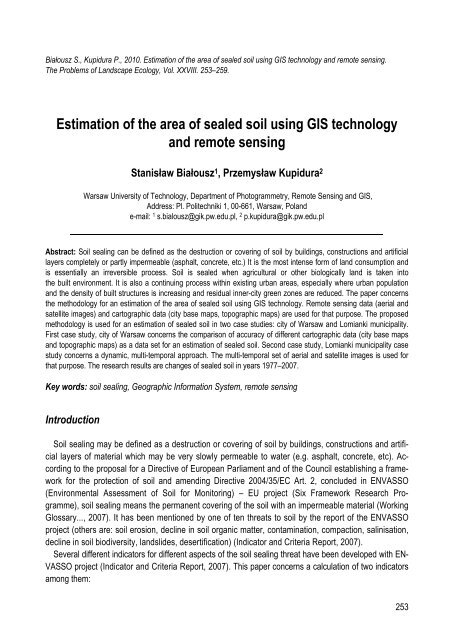
Białousz S., Kupidura P., 2010. <strong>Estimation</strong> <strong>of</strong> <strong>the</strong> <strong>area</strong> <strong>of</strong> <strong>sealed</strong> <strong>soil</strong> <strong>using</strong> <strong>GIS</strong> <strong>technology</strong> <strong>and</strong> remote sensing.<br />
The Problems <strong>of</strong> L<strong>and</strong>scape Ecology, Vol. XXVIII. 253–259.<br />
<strong>Estimation</strong> <strong>of</strong> <strong>the</strong> <strong>area</strong> <strong>of</strong> <strong>sealed</strong> <strong>soil</strong> <strong>using</strong> <strong>GIS</strong> <strong>technology</strong><br />
<strong>and</strong> remote sensing<br />
Stanisław Białousz 1 , Przemysław Kupidura 2<br />
Warsaw University <strong>of</strong> Technology, Department <strong>of</strong> Photogrammetry, Remote Sensing <strong>and</strong> <strong>GIS</strong>,<br />
Address: Pl. Politechniki 1, 00-661, Warsaw, Pol<strong>and</strong><br />
e-mail: 1 s.bialousz@gik.pw.edu.pl, 2 p.kupidura@gik.pw.edu.pl<br />
Abstract: Soil sealing can be defined as <strong>the</strong> destruction or covering <strong>of</strong> <strong>soil</strong> by buildings, constructions <strong>and</strong> artificial<br />
layers completely or partly impermeable (asphalt, concrete, etc.) It is <strong>the</strong> most intense form <strong>of</strong> l<strong>and</strong> consumption <strong>and</strong><br />
is essentially an irreversible process. Soil is <strong>sealed</strong> when agricultural or o<strong>the</strong>r biologically l<strong>and</strong> is taken into<br />
<strong>the</strong> built environment. It is also a continuing process within existing urban <strong>area</strong>s, especially where urban population<br />
<strong>and</strong> <strong>the</strong> density <strong>of</strong> built structures is increasing <strong>and</strong> residual inner-city green zones are reduced. The paper concerns<br />
<strong>the</strong> methodology for an estimation <strong>of</strong> <strong>the</strong> <strong>area</strong> <strong>of</strong> <strong>sealed</strong> <strong>soil</strong> <strong>using</strong> <strong>GIS</strong> <strong>technology</strong>. Remote sensing data (aerial <strong>and</strong><br />
satellite images) <strong>and</strong> cartographic data (city base maps, topographic maps) are used for that purpose. The proposed<br />
methodology is used for an estimation <strong>of</strong> <strong>sealed</strong> <strong>soil</strong> in two case studies: city <strong>of</strong> Warsaw <strong>and</strong> Lomianki municipality.<br />
First case study, city <strong>of</strong> Warsaw concerns <strong>the</strong> comparison <strong>of</strong> accuracy <strong>of</strong> different cartographic data (city base maps<br />
<strong>and</strong> topographic maps) as a data set for an estimation <strong>of</strong> <strong>sealed</strong> <strong>soil</strong>. Second case study, Lomianki municipality case<br />
study concerns a dynamic, multi-temporal approach. The multi-temporal set <strong>of</strong> aerial <strong>and</strong> satellite images is used for<br />
that purpose. The research results are changes <strong>of</strong> <strong>sealed</strong> <strong>soil</strong> in years 1977–2007.<br />
Key words: <strong>soil</strong> sealing, Geographic Information System, remote sensing<br />
Introduction<br />
Soil sealing may be defined as a destruction or covering <strong>of</strong> <strong>soil</strong> by buildings, constructions <strong>and</strong> artificial<br />
layers <strong>of</strong> material which may be very slowly permeable to water (e.g. asphalt, concrete, etc). According<br />
to <strong>the</strong> proposal for a Directive <strong>of</strong> European Parliament <strong>and</strong> <strong>of</strong> <strong>the</strong> Council establishing a framework<br />
for <strong>the</strong> protection <strong>of</strong> <strong>soil</strong> <strong>and</strong> amending Directive 2004/35/EC Art. 2, concluded in ENVASSO<br />
(Environmental Assessment <strong>of</strong> Soil for Monitoring) – EU project (Six Framework Research Programme),<br />
<strong>soil</strong> sealing means <strong>the</strong> permanent covering <strong>of</strong> <strong>the</strong> <strong>soil</strong> with an impermeable material (Working<br />
Glossary..., 2007). It has been mentioned by one <strong>of</strong> ten threats to <strong>soil</strong> by <strong>the</strong> report <strong>of</strong> <strong>the</strong> ENVASSO<br />
project (o<strong>the</strong>rs are: <strong>soil</strong> erosion, decline in <strong>soil</strong> organic matter, contamination, compaction, salinisation,<br />
decline in <strong>soil</strong> biodiversity, l<strong>and</strong>slides, desertification) (Indicator <strong>and</strong> Criteria Report, 2007).<br />
Several different indicators for different aspects <strong>of</strong> <strong>the</strong> <strong>soil</strong> sealing threat have been developed with EN-<br />
VASSO project (Indicator <strong>and</strong> Criteria Report, 2007). This paper concerns a calculation <strong>of</strong> two indicators<br />
among <strong>the</strong>m:<br />
253
Białousz S., Kupidura P.<br />
• <strong>sealed</strong> <strong>area</strong> – <strong>the</strong> indicator quantifying an absolute <strong>area</strong> <strong>of</strong> <strong>sealed</strong> <strong>soil</strong>,<br />
• l<strong>and</strong> take – <strong>the</strong> indicator quantifying how much, in what proportions <strong>and</strong> at what growth rate <strong>soil</strong> is lost<br />
by converting agricultural, forest, semi-natural <strong>and</strong> natural l<strong>and</strong> to urban <strong>and</strong> o<strong>the</strong>r artificial l<strong>and</strong> covers.<br />
The main problem is to measure or calculate an <strong>area</strong> <strong>of</strong> <strong>sealed</strong> <strong>soil</strong> within an <strong>area</strong> <strong>of</strong> interest. One <strong>of</strong> <strong>the</strong><br />
proposition submitted during <strong>the</strong> works <strong>of</strong> <strong>the</strong> ENVASSO project was to use cadastral maps for a calculation <strong>of</strong> a<br />
percentage <strong>of</strong> built-up <strong>and</strong> non-built-up <strong>area</strong>. However, differences in cadastral data between European countries<br />
are significant <strong>and</strong> this solution cannot be applied in most <strong>of</strong> <strong>the</strong> EU countries. For example, in Germany<br />
<strong>the</strong>re is an information about percentage <strong>of</strong> <strong>sealed</strong> <strong>soil</strong> <strong>area</strong> for different types <strong>of</strong> built-up <strong>area</strong> in cadastral<br />
maps, so <strong>the</strong> mentioned proposition may be applied directly <strong>the</strong>re. In o<strong>the</strong>r countries (e.g. Pol<strong>and</strong>), <strong>the</strong>re is<br />
no such an information (figure 1), so cadastral data has restricted usefulness for <strong>sealed</strong> <strong>soil</strong> <strong>area</strong> evaluation.<br />
Fig. 1. Built-up <strong>area</strong> marked in <strong>the</strong> cadastral map on <strong>the</strong> left <strong>and</strong> „real” situation measured in <strong>the</strong> city map (<strong>sealed</strong> <strong>soil</strong><br />
marked with grey) on <strong>the</strong> right<br />
This paper concerns <strong>the</strong> proposition <strong>of</strong> a methodology to evaluate an <strong>area</strong> <strong>of</strong> <strong>sealed</strong> <strong>soil</strong> <strong>and</strong> to calculate<br />
<strong>the</strong> values <strong>of</strong> proposed <strong>soil</strong> sealing indicators. They are based on <strong>the</strong> idea <strong>of</strong> sampling – different<br />
built-up <strong>area</strong> classes are indentified in remote sensing data <strong>and</strong> <strong>the</strong> total <strong>area</strong> <strong>of</strong> <strong>sealed</strong> <strong>soil</strong> is calculated<br />
<strong>using</strong> <strong>the</strong> percentage <strong>of</strong> <strong>sealed</strong> <strong>soil</strong> in each class measured on topographic maps or on images. Two pilot<br />
<strong>area</strong>s: Warsaw city <strong>and</strong> Lomianki municipality have been used for a methodology testing. Two slightly<br />
different approaches have been applied for each one <strong>of</strong> <strong>the</strong>m. Also different indicators have been calculated:<br />
Sealed Area for Warsaw city <strong>using</strong> a single Spot satellite image <strong>and</strong> L<strong>and</strong> Take for Lomianki municipality<br />
<strong>using</strong> multi-temporal set <strong>of</strong> aerial <strong>and</strong> satellite images.<br />
Methodology <strong>and</strong> results<br />
The process <strong>of</strong> <strong>sealed</strong> <strong>soil</strong> <strong>area</strong> estimation according to <strong>the</strong> proposed methodology includes following<br />
steps (Białousz et al., 2007):<br />
254
<strong>Estimation</strong> <strong>of</strong> <strong>the</strong> <strong>area</strong> <strong>of</strong> <strong>sealed</strong>...<br />
1. Determination <strong>of</strong> built-up <strong>area</strong> classes according to an intensity <strong>of</strong> terrain cover <strong>and</strong> by functions –<br />
It should rely on a specific <strong>of</strong> <strong>the</strong> <strong>area</strong> <strong>of</strong> interest.<br />
2. Measure <strong>of</strong> a percentage <strong>of</strong> <strong>sealed</strong> <strong>soil</strong> for mentioned classes <strong>using</strong> several representative examples<br />
– might be completed <strong>using</strong> aerial or satellite images, management plans <strong>and</strong> base maps or topographic<br />
maps.<br />
3. Identification <strong>of</strong> borders <strong>of</strong> zones <strong>of</strong> different built-up classes <strong>and</strong> measure <strong>of</strong> <strong>the</strong>ir <strong>area</strong>s – preferably<br />
<strong>using</strong> satellite images.<br />
4. Calculation <strong>of</strong> <strong>the</strong> <strong>area</strong> <strong>of</strong> <strong>sealed</strong> <strong>soil</strong> for different zones <strong>and</strong> <strong>the</strong>n for total <strong>area</strong>.<br />
Warsaw city pilot <strong>area</strong><br />
Seven different classes <strong>of</strong> built-up <strong>area</strong> according to an intensity <strong>of</strong> terrain cover <strong>and</strong> by functions have<br />
been extracted:<br />
• very high intensity – old cities, traditional bordering buildings (tenement-houses with annexes, with<br />
“wells”),<br />
• high intensity – bordering buildings along streets <strong>and</strong> with green <strong>area</strong>s inside,<br />
• high intensity – industrial <strong>area</strong>s,<br />
• medium density – blocks scattered in green <strong>area</strong>s,<br />
• medium density – public domain,<br />
• low density – residential ho<strong>using</strong>,<br />
• very low density – green <strong>area</strong>s.<br />
A percentage <strong>of</strong> <strong>sealed</strong> <strong>soil</strong> for each class have been determined <strong>using</strong> topographic maps (scale<br />
1 : 10 000) <strong>and</strong>, independently, base city maps (scale 1 : 500). Several samples for different built-up <strong>area</strong><br />
classes are presented in figures 2–5. The comparison <strong>of</strong> <strong>the</strong> results obtained <strong>using</strong> <strong>the</strong>se different scale<br />
maps showed an insignificant differences between <strong>the</strong>m. They are presented in <strong>the</strong> table 1.<br />
Table 1. The percentage <strong>of</strong> <strong>sealed</strong> <strong>soil</strong> in different built-up <strong>area</strong> classes according to <strong>the</strong> samples measured on <strong>the</strong><br />
base city maps <strong>and</strong> topographic maps<br />
Class <strong>of</strong> built-up <strong>area</strong><br />
Sealed <strong>area</strong> after<br />
city map<br />
[%]<br />
Sealed <strong>area</strong> after<br />
topographic map<br />
[%]<br />
Absolute difference<br />
[%]<br />
Very high density 96 97 1<br />
Very high density (industrial zones) 91 98 7<br />
High density (bordering buildings) 74 79 5<br />
High density (public domain) 75 78 3<br />
Medium density (blocks) 52 47 5<br />
Low density 26 23 3<br />
Very low density 20 20 0<br />
255
Białousz S., Kupidura P.<br />
Legend<br />
buildings<br />
roads, paved foot-paths, squares<br />
non-<strong>sealed</strong> <strong>area</strong><br />
Fig. 2. Very high density built-up <strong>area</strong> class. Sealed <strong>area</strong> extracted <strong>using</strong> a city map (left) <strong>and</strong> a topographic map (right)<br />
Legend<br />
buildings<br />
roads, paved foot-paths, squares<br />
non-<strong>sealed</strong> <strong>area</strong><br />
Fig. 3. High density built-up <strong>area</strong> class (bordering buildings). Sealed <strong>area</strong> extracted <strong>using</strong> a city map (left) <strong>and</strong> a<br />
topographic map (right)<br />
Legend<br />
buildings<br />
roads, paved foot-paths, squares<br />
non-<strong>sealed</strong> <strong>area</strong><br />
Fig. 4. Medium density built-up <strong>area</strong> class (blocks). Sealed <strong>area</strong> extracted <strong>using</strong> a city map (left) <strong>and</strong> a topographic<br />
map (right)<br />
256
<strong>Estimation</strong> <strong>of</strong> <strong>the</strong> <strong>area</strong> <strong>of</strong> <strong>sealed</strong>...<br />
Legend<br />
buildings<br />
roads, paved foot-paths, squares<br />
non-<strong>sealed</strong> <strong>area</strong><br />
Fig. 5. Very low density built-up <strong>area</strong> class. Sealed <strong>area</strong> extracted <strong>using</strong> a city map (left) <strong>and</strong> a topographic map<br />
(right)<br />
Using a percentage <strong>of</strong> <strong>sealed</strong> <strong>soil</strong> for each class, <strong>the</strong> borders <strong>of</strong> different zones in Warsaw have been<br />
determined as well as <strong>the</strong>ir <strong>area</strong>s, <strong>using</strong> Spot 5 image. The results <strong>of</strong> <strong>the</strong> calculation are presented in <strong>the</strong><br />
figure 6 <strong>and</strong> in <strong>the</strong> table 2.<br />
Fig. 6. Built-up <strong>area</strong> zones in Warsaw extracted in Spot 5 satellite image<br />
257
Białousz S., Kupidura P.<br />
Table 2. The <strong>area</strong> <strong>of</strong> different built-up zones measured on <strong>the</strong> satellite image<br />
Class <strong>of</strong> built-up <strong>area</strong> Area <strong>of</strong> <strong>the</strong> class [km 2 ] Total <strong>sealed</strong> <strong>area</strong> [km 2 ]<br />
Very high density 6.19 5.94<br />
Very high density (industrial zones) 17.29 15.73<br />
High density (bordering buildings) 29.23 21.63<br />
High density (public domain) 2.86 2.15<br />
Medium density (blocks) 80.23 41.72<br />
Low density 63.13 16.61<br />
Very low density 48.16 9.63<br />
Summarizing, according to <strong>the</strong> presented methodology total <strong>sealed</strong> <strong>area</strong> in Warsaw is c.a. 113 km 2<br />
what gives 43% out <strong>of</strong> 247 km 2 <strong>of</strong> built-up <strong>area</strong> <strong>and</strong> 22% out <strong>of</strong> total <strong>area</strong> <strong>of</strong> Warsaw (518 km 2 ).<br />
Lomianki municipality pilot <strong>area</strong><br />
The same methodology has been applied in <strong>the</strong> second pilot <strong>area</strong> – Lomianki municipality. There were<br />
two differences in <strong>the</strong> process: different classes <strong>of</strong> built-up <strong>area</strong> have been determined <strong>and</strong> <strong>the</strong> satellite<br />
image <strong>of</strong> very high resolution have been used for a determination <strong>of</strong> percentage <strong>of</strong> <strong>sealed</strong> <strong>soil</strong> in <strong>the</strong>se<br />
built-up classes. Also, <strong>the</strong> use <strong>of</strong> multi-temporal set <strong>of</strong> images allowed to calculate L<strong>and</strong> Take indicator.<br />
The following built-up <strong>area</strong> classes have been determined:<br />
• residential,<br />
• industrial <strong>and</strong> commercial,<br />
• public domain,<br />
• recreational.<br />
As mentioned above, a percentage <strong>of</strong> <strong>sealed</strong> <strong>area</strong> in <strong>the</strong>se classes have been determined in a satellite<br />
Quickbird image. Table 3 presents a percentage measured for <strong>the</strong> samples <strong>of</strong> <strong>the</strong> determined built-up<br />
<strong>area</strong> classes.<br />
Table 3. The percentage <strong>of</strong> <strong>sealed</strong> <strong>soil</strong> in different built-up classes according to <strong>the</strong> samples measured on <strong>the</strong> satellite image<br />
Class <strong>of</strong> built-up <strong>area</strong><br />
Sealed <strong>area</strong> after satellite image<br />
[%]<br />
Residential 35<br />
Industrial <strong>and</strong> commercial 93<br />
Public domain 64<br />
Recreational 9<br />
The measurement <strong>of</strong> <strong>the</strong> <strong>area</strong> <strong>of</strong> different classes has been made <strong>using</strong> remote sensing data. Four aerial<br />
<strong>and</strong> satellite images <strong>of</strong> different dates <strong>of</strong> acquisition have been used:<br />
• aerial photo from 1977,<br />
• aerial photo from 1987,<br />
• aerial photo from 1997,<br />
• satellite Quickbird image from 2007.<br />
258
<strong>Estimation</strong> <strong>of</strong> <strong>the</strong> <strong>area</strong> <strong>of</strong> <strong>sealed</strong>...<br />
This image set allowed to collect data on l<strong>and</strong> cover in Lomianki in different dates, to calculate <strong>the</strong> <strong>area</strong><br />
<strong>of</strong> <strong>sealed</strong> <strong>soil</strong> <strong>and</strong>, finally, to calculate L<strong>and</strong> Take indicator. Table 4 presents <strong>the</strong> results <strong>of</strong> <strong>the</strong> measure<br />
<strong>and</strong> calculations.<br />
Table 4. Total <strong>area</strong> <strong>of</strong> <strong>sealed</strong> <strong>soil</strong> <strong>and</strong> calculated L<strong>and</strong> Take indicator<br />
Year<br />
Residential zone<br />
<strong>area</strong><br />
[ha]<br />
Industrial <strong>and</strong><br />
commercial zone<br />
<strong>area</strong> [ha]<br />
Public domain<br />
zone <strong>area</strong><br />
[ha]<br />
Recreational<br />
zone <strong>area</strong><br />
[ha]<br />
Total <strong>area</strong> <strong>of</strong><br />
<strong>sealed</strong> <strong>soil</strong><br />
[ha]<br />
L<strong>and</strong> Take<br />
[ha/10y]<br />
1977 369.4 65.2 7.0 0.0 194.4 –<br />
1987 448.5 89.5 8.7 34.8 248.9 54.5<br />
1997 502.1 102.5 9.6 34.8 280.3 31.4<br />
2007 783.7 159.6 15.5 35.3 435.8 155.5<br />
Total <strong>area</strong> <strong>of</strong> Lomianki municipality is 38.06 km 2 (3806 ha), so 784 ha <strong>of</strong> <strong>sealed</strong> <strong>soil</strong> in 2007 is c.a. 21%<br />
out <strong>of</strong> total <strong>area</strong> <strong>of</strong> <strong>the</strong> whole municipality. It can be clearly seen, that 241 ha – 6% <strong>of</strong> total <strong>area</strong>, have<br />
been <strong>sealed</strong> since 1977 <strong>and</strong> 177 ha 4% – since 1997. The <strong>soil</strong> sealing process becomes more <strong>and</strong> more<br />
intensive.<br />
Conclusions<br />
The proposed methodology is a compromise between an accuracy <strong>of</strong> <strong>the</strong> measurement <strong>of</strong> an <strong>area</strong> <strong>of</strong><br />
<strong>sealed</strong> <strong>soil</strong> <strong>and</strong> an efficiency <strong>of</strong> this process. Using <strong>the</strong> sampling approach it is possible to estimate <strong>the</strong><br />
values <strong>of</strong> <strong>soil</strong> sealing indicators fast <strong>and</strong> with relatively high precision. This methodology is also universal,<br />
it may be used regardless to <strong>the</strong> differences in cadastral data in different countries.<br />
References<br />
Indicators <strong>and</strong> Criteria Report, 2007. ENVASSO project report.<br />
Working Glossary <strong>of</strong> Key Terms For a European Soil Monitoring System, 2007. ENVASSO Work Package<br />
4, ENVASSO project report.<br />
Białousz S., Kupidura P., Neite H., Dobos A., Kozak J., Penizek V., Heilman H. 2007. ENVASSO, Threat<br />
Report “Soil Sealing, ENVASSO project report.<br />
259
260<br />
Białousz S., Kupidura P.