Tucson - Pima Association of Governments
Tucson - Pima Association of Governments
Tucson - Pima Association of Governments

Create successful ePaper yourself
Turn your PDF publications into a flip-book with our unique Google optimized e-Paper software.
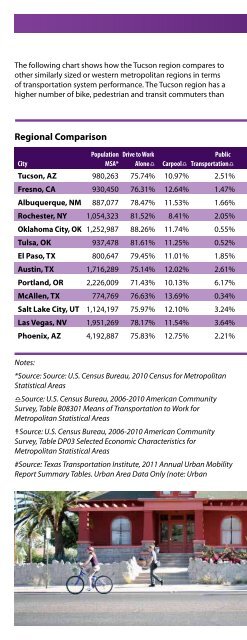
Regional Comparison<br />
The following chart shows how the <strong>Tucson</strong> region compares to<br />
other similarly sized or western metropolitan regions in terms<br />
<strong>of</strong> transportation system performance. The <strong>Tucson</strong> region has a<br />
higher number <strong>of</strong> bike, pedestrian and transit commuters than<br />
many other communities. Commute time is about average, and<br />
<strong>Pima</strong> County has the 3rd highest traffic fatality rate as compared<br />
to other communities in this set. Note: Data refer to a variety <strong>of</strong><br />
geographic scales and should be used for comparative purposes<br />
only.<br />
Regional Comparison<br />
Population Drive to Work Public Travel Time Travel Time Freeway Daily Transit Traffic<br />
City MSA* Alone♎ Carpool♎ Transportation♎ Walk♎ Bike♎ to Work☨ Index# Miles# Ridership♈ Fatalities♓<br />
<strong>Tucson</strong>, AZ 980,263 75.74% 10.97% 2.51% 2.67% 1.32% 23.9 1.11 253 57,117 10.81<br />
Fresno, CA 930,450 76.31% 12.64% 1.47% 2.17% 0.60% 21.5 1.07 303 48,844 12.04<br />
Albuquerque, NM 887,077 78.47% 11.53% 1.66% 1.80% 0.88% 23.6 1.10 338 34,579 7.40<br />
Rochester, NY 1,054,323 81.52% 8.41% 2.05% 3.49% 0.42% 20.4 1.05 550 47,229 6.58<br />
Oklahoma City, OK 1,252,987 88.26% 11.74% 0.55% 1.66% 0.30% 21.4 1.10 778 7,687 11.20<br />
Tulsa, Ok 937,478 81.61% 11.25% 0.52% 1.46% 0.14% 20.9 1.08 758 7,446 9.45<br />
El Paso, TX 800,647 79.45% 11.01% 1.85% 2.13% 0.13% 22.4 1.16 449 41,028 6.87<br />
Austin, TX 1,716,289 75.14% 12.02% 2.61% 1.69% 0.62% 25.3 1.28 836 98,245 7.62<br />
Portland, OR 2,226,009 71.43% 10.13% 6.17% 3.28% 2.01% 24.8 1.25 793 285,978 4.22<br />
McAllen, TX 774,769 76.63% 13.69% 0.34% 1.39% 0.16% 21.0 1.10 306 294 9.03<br />
Salt Lake City, UT 1,124,197 75.97% 12.10% 3.24% 2.28% 0.80% 22.2 1.11 576 105,106 5.44<br />
Las Vegas, NV 1,951,269 78.17% 11.54% 3.64% 1.81% 0.46% 24.3 1.24 566 157,299 7.40<br />
Phoenix, AZ 4,192,887 75.83% 12.75% 2.21% 1.70% 0.73% 26.2 1.21 1,594 160,577 8.17<br />
Notes:<br />
*Source: Source: U.S. Census Bureau, 2010 Census for Metropolitan<br />
Statistical Areas<br />
♎Source: U.S. Census Bureau, 2006-2010 American Community<br />
Survey, Table B08301 Means <strong>of</strong> Transportation to Work for<br />
Metropolitan Statistical Areas<br />
☨Source: U.S. Census Bureau, 2006-2010 American Community<br />
Survey, Table DP03 Selected Economic Characteristics for<br />
Metropolitan Statistical Areas<br />
#Source: Texas Transportation Institute, 2011 Annual Urban Mobility<br />
Report Summary Tables. Urban Area Data Only (note: Urban<br />
Area refers only to locations exceeding a density <strong>of</strong> 1,000 people<br />
per square mile) Travel Time Index (TTI) is a congestion measure<br />
developed by the Texas Transportation Institute that measures the<br />
ratio <strong>of</strong> travel time during peak-period to travel time during free<br />
flow conditions.<br />
♈Source: Federal Transit Administration, National Transit Database<br />
♓(Traffic Fatalities per 100,000 Population) source: National<br />
Highway Traffic Safety Administration, Fatality Analysis Reporting<br />
System. Fatality rate based on county level data <strong>of</strong> principle county<br />
within the Metropolitan Statistical Area.