Tucson - Pima Association of Governments
Tucson - Pima Association of Governments
Tucson - Pima Association of Governments

Create successful ePaper yourself
Turn your PDF publications into a flip-book with our unique Google optimized e-Paper software.
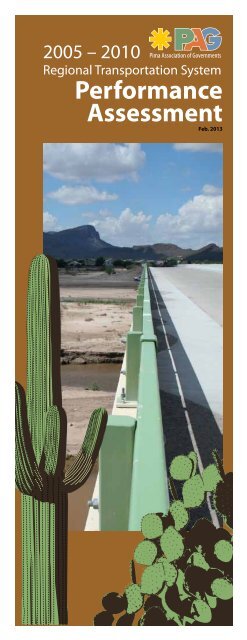
2005 – 2010<br />
Regional Transportation System<br />
Performance<br />
Assessment<br />
Feb. 2013
86<br />
t<br />
t a<br />
C<br />
C e n<br />
86<br />
W e<br />
s t<br />
B<br />
O<br />
t a<br />
l<br />
77<br />
77<br />
C r u z R i v e r<br />
BSN<br />
19<br />
BSN<br />
19<br />
BSN<br />
19<br />
Ri lito<br />
Cr<br />
e<br />
d<br />
l<br />
r<br />
C<br />
r<br />
Ve<br />
s h<br />
r d e<br />
C r<br />
83<br />
The 2005-2010 Regional Transportation System Performance<br />
Assessment presents an evaluation <strong>of</strong> the transportation system<br />
in the <strong>Tucson</strong> metropolitan region, an area encompassing<br />
all <strong>of</strong> <strong>Pima</strong> County and covering nearly 9,200 square miles.<br />
An estimated 95 percent <strong>of</strong> the region’s population and a<br />
comparable share <strong>of</strong> the region’s jobs are concentrated in<br />
eastern <strong>Pima</strong> County, which includes the towns <strong>of</strong> Marana,<br />
Sahuarita, and Oro Valley, the cities <strong>of</strong> <strong>Tucson</strong> and South <strong>Tucson</strong>,<br />
and the most populous places in unincorporated <strong>Pima</strong> County.<br />
This report, prepared by <strong>Pima</strong> <strong>Association</strong> <strong>of</strong> <strong>Governments</strong><br />
(PAG), reviews growth trends, travel conditions and system<br />
improvements. It is the first such report to be prepared since the<br />
establishment <strong>of</strong> the 2006 voter- approved, $2.1 billion Regional<br />
Transportation Authority (RTA) plan and reflects many <strong>of</strong> the<br />
improvements made during the first period (FY 2007-2011)<br />
<strong>of</strong> the 20-year plan. Through its first five-year period, the RTA<br />
funded 420 projects regionwide.<br />
The period covered by this report was one in which the nation<br />
and region struggled through a once-in-a-generation housing<br />
crisis and economic recession, resulting in high unemployment,<br />
and lower-than-expected population growth and home building.<br />
Because <strong>of</strong> the unprecedented volatility <strong>of</strong> the latter part <strong>of</strong> the<br />
decade, many population and travel estimates for the inter-<br />
Census period were unreliable and required downward revisions<br />
following the release <strong>of</strong> 2010 Census data. The Performance<br />
Assessment uses the most recently available data based on the<br />
2010 Census to report on the system.<br />
S a n t a<br />
Ironwood<br />
Forest<br />
National<br />
Monument<br />
C r u z<br />
Sanders Rd<br />
R i v e r<br />
10<br />
Schuk Toak District<br />
<strong>of</strong> the Tohono<br />
O’odham<br />
Nation<br />
C e n t r a l A<br />
r i z o n a<br />
Marana<br />
Northwest<br />
Regional<br />
Airport<br />
Sandario Rd<br />
P r o j e c<br />
C e n t r a l A r i z o n a<br />
t C a n a l<br />
Avra Valley Rd<br />
Saguaro<br />
National Park<br />
(West Unit)<br />
P r o<br />
Marana<br />
Twin Peaks Rd<br />
j e c<br />
Ryan<br />
Airfield<br />
<strong>Tucson</strong><br />
Mountain<br />
Park<br />
C a n a l<br />
S a n<br />
Tangerine Rd<br />
r u<br />
Ajo Hwy<br />
San Xavier District<br />
<strong>of</strong> the Tohono O’odham<br />
Nation<br />
2006 Eastern <strong>Pima</strong> County<br />
MILES<br />
0 1 2 3 4 5 6 7 8 9 10<br />
z R<br />
i v e r<br />
10<br />
Pascua Yaqui<br />
Tribe<br />
Tortolita<br />
Mountain<br />
Park<br />
Thornydale Rd<br />
Arthur<br />
Pack<br />
Regional<br />
Park<br />
La Cholla<br />
Airpark<br />
C a ñ a d a d e l<br />
10<br />
t r a l A r i z o n a P r o j e c t C a n a<br />
P I N A L C O U N T Y<br />
Oro<br />
Valley<br />
r o<br />
Silverbell Rd<br />
S a n<br />
r a n c h<br />
C r u z<br />
R i v e r<br />
P I M A C O U N T Y<br />
La Canada Dr<br />
Ina Rd<br />
19<br />
Oracle Rd<br />
South<br />
<strong>Tucson</strong><br />
Mission Rd<br />
Duval Mine Rd<br />
19<br />
S a n t a<br />
Introduction<br />
<strong>Tucson</strong> Metropolitan Region<br />
1st Ave<br />
Oracle Rd<br />
River Rd<br />
Prince Rd<br />
6th Ave<br />
Campbell Ave<br />
P i m a<br />
C a ñ a d a<br />
W a s h<br />
6th St<br />
<strong>Tucson</strong><br />
Valencia Rd<br />
10<br />
Sahuarita<br />
Old <strong>Tucson</strong>-Nogales Hwy<br />
O r o<br />
Catalina<br />
State Park<br />
Alvernon Wy<br />
Swan Rd<br />
<strong>Tucson</strong><br />
International<br />
Airport<br />
Grant Rd<br />
Speedway Blvd<br />
Kolb Rd<br />
Pantano<br />
Golf Links Rd<br />
Davis-Monthan<br />
Air Force<br />
Base<br />
Irvington Rd<br />
Santa Rita<br />
Experimental<br />
Range<br />
Wash<br />
22nd St<br />
Sabino Cyn Rd<br />
S a b<br />
S a b i n o C<br />
i n o<br />
Bear Cyn Rd<br />
T a n q u e<br />
C r<br />
Ve r d e<br />
10<br />
B e a r<br />
C r<br />
Broadway Blvd<br />
Southeast<br />
Regional<br />
Park<br />
Coronado<br />
National<br />
Forest<br />
Snyder Rd<br />
Catalina Highway<br />
Harrison Rd<br />
Houghton Rd<br />
Valencia Rd<br />
A g u a<br />
T a n q u e<br />
Coronado<br />
National<br />
Forest<br />
C a l<br />
Tanque Verde Rd<br />
Sahuarita Rd<br />
P a n t a n o W a<br />
i e n t e W a s h<br />
Saguaro<br />
National Park<br />
(East Unit)<br />
Cienega Creek<br />
Preservation Area<br />
Whitehouse Canyon Rd<br />
<strong>Pima</strong> County, Arizona<br />
The roadway system in eastern <strong>Pima</strong> County consists <strong>of</strong> approximately 4,715 lane<br />
miles <strong>of</strong> freeways , parkways, and major and minor arterial roadways, which<br />
together carry an estimated 85 percent <strong>of</strong> total vehicle miles travelled in the region.<br />
Empire-<br />
Cienega Resource<br />
Conservation Area
Housing<br />
50,000<br />
40,000<br />
30,000<br />
20,000<br />
10,000<br />
Residential Building Permits<br />
0<br />
Issued<br />
2000 - 2010 2001-2005 2006-2010<br />
50,000<br />
40,000<br />
30,000<br />
20,000<br />
10,000<br />
0<br />
2001-2005 2006-2010<br />
Outside City <strong>of</strong> <strong>Tucson</strong><br />
Between 2000 and 2010, the population <strong>of</strong> <strong>Pima</strong> County<br />
Within City <strong>of</strong> <strong>Tucson</strong><br />
grew by 16 percent, from 843,746 to 980,263. Approximately<br />
75 percent <strong>of</strong> population growth and 70 percent <strong>of</strong> housing<br />
growth occurred outside <strong>of</strong> the <strong>Tucson</strong> city limits in rapidly<br />
growing suburban areas.<br />
Residential Building Permits by Housing Type<br />
2001 - 2005 2006 - 2010<br />
40,500<br />
350 4,600<br />
350<br />
3,500<br />
Single Family Residential<br />
Townhome<br />
Mobile Home<br />
Multifamily<br />
Outside City <strong>of</strong> <strong>Tucson</strong><br />
Within City <strong>of</strong> <strong>Tucson</strong><br />
Source: <strong>Pima</strong> County<br />
18,000<br />
650<br />
1,150<br />
Source: <strong>Pima</strong> County<br />
Housing, Population and Employment<br />
Population<br />
600,000<br />
500,000<br />
400,000<br />
300,000<br />
200,000<br />
100,000<br />
0<br />
South<br />
<strong>Tucson</strong><br />
Jurisdictional Population Growth Growth<br />
2000 - 2010 - 2010<br />
<strong>Tucson</strong><br />
Unincorporated<br />
<strong>Pima</strong> Cty<br />
Oro<br />
Valley Marana Sahuarita<br />
2000: 5,490 486,699 305,059 19,657 13,556 3,242<br />
2010: 5,652 520,116 353,264 41,011 34,961 25,259<br />
3% Growth 7% Growth 16% Growth 109% Growth 158% Growth 679% Growth<br />
700%<br />
600%<br />
500%<br />
400%<br />
300%<br />
200%<br />
100%<br />
0%<br />
In the last decade, the share <strong>of</strong> the region’s population that is 65<br />
years or older grew by 8.5 percent. As the region’s population<br />
continues to age, we will need to expand mobility services for a<br />
growing non-driving population.<br />
Employment<br />
Total Employment<br />
2000 2005 2010<br />
393,716 418,214 433,806<br />
Source: U.S. Census<br />
Total employment in the region grew by 10.2 percent from 2000<br />
to 2010, peaking at 446,651 in 2008 (Source: Arizona Department <strong>of</strong><br />
Administration, Office <strong>of</strong> Employment and Population Statistics).<br />
Traffic Growth<br />
2005 2010<br />
Daily Vehicle Miles Traveled (VMT) 18,301,643 20,767,534<br />
Daily Vehicle Hours Traveled (VHT) 463,462 518,698<br />
Daily VMT/Capita 19.23 21.19<br />
Daily VHT/Capita 0.49 0.53<br />
Daily Vehicle Trips 2,661,925 2,799,985<br />
Average Network Speed (mph) 39.49 40.04<br />
Sun Tran Annual Bus Revenue Miles 6,913,227 7,950,999<br />
Sun Tran Annual Bus Revenue Hours 532,792 593,773<br />
Ratio Vehicle Passenger Miles/<br />
Transit Passenger Miles 113/1 98/1<br />
Average Transit Speed 12.98 13.39<br />
From 2005 to 2010, daily vehicle miles traveled (VMT) increased<br />
13.5 percent, while daily vehicle hours traveled (VHT) increased<br />
by 11.9 percent.<br />
As transit services were expanded in the region, the total number<br />
<strong>of</strong> passenger miles traveled by transit increased relative to<br />
those traveled by car. (Passenger miles traveled is calculated by<br />
multiplying miles traveled by number <strong>of</strong> passengers.)<br />
Vehicle numbers provided in this table are computed using the PAG travel demand<br />
model, which is an estimation tool that only includes travel on major streets in the<br />
regional network. Trips taken on local roads are excluded from the model.<br />
Numbers may vary from earlier VMT estimates since the model was recently updated<br />
to include 2010 Census data and newer socio-demographic information. Earlier VMT<br />
estimates were based on population assumptions that were shown to be too high for<br />
the region during the inter-Census period.
Traffic Volume<br />
PAG collects traffic volume data annually on roadway segments.<br />
The table below shows the 20 busiest segments based on average<br />
daily traffic (ADT). Daily traffic on most <strong>of</strong> the busiest segments<br />
increased during the five-year period. For more detailed<br />
information on specific segments, visit http://www.pagnet.org/<br />
applications/trafficcounts/<br />
Average Daily Traffic: 20 Busiest Segments<br />
2005 2010<br />
I-10: Speedway to Park 160,000 173,000<br />
Grant Rd: Swan to Craycr<strong>of</strong>t 51,259 61,523<br />
Speedway Blvd: Country Club to Alvernon 52,951 56,474<br />
Golf Links Rd: Swan to Craycr<strong>of</strong>t 55,033 55,482<br />
Oracle Road: Orange Grove to Magee 53,013 54,993<br />
Campbell Ave: 6th St to Broadway 40,494 54,941<br />
Tanque Verde: Kolb to Sabino Canyon 59,604 53,855<br />
22nd St: <strong>Tucson</strong> Blvd to Country Club 49,686 53,488<br />
Grant Rd: Wilmot to Tanque Verde 48,999 53,205<br />
Wilmot Rd: 5th St to Speedway 42,489 53,146<br />
Valencia Rd: I-19 to 12th Ave 51,609 52,635<br />
Golf Links Rd: Craycr<strong>of</strong>t to Wilmot 56,676 52,401<br />
River Rd: 1st Ave to Campbell 36,139 51,901<br />
Tanque Verde Rd:<br />
Sabino Canyon to Camino Pio Decimo 52,257 51,687<br />
Broadway Blvd: Craycr<strong>of</strong>t to Wilmot 53,030 50,965<br />
Speedway Blvd: Craycr<strong>of</strong>t to Wilmot 47,843 50,951<br />
Broadway Blvd: Country Club to Alvernon 43,880 50,094<br />
Speedway Blvd: <strong>Tucson</strong> to Country Club 55,898 50,077<br />
Kolb Rd: 22nd St to Broadway 53,570 49,915<br />
Valencia Rd: Mission to I-19 47,360 49,911<br />
Note: 2005 counts occurred 2004-2006, 2010 counts occurred<br />
2009-2011<br />
The table below shows the top 10 locations for total peak bicycle<br />
activity as reported in the 2010 PAG regional bicycle count. The<br />
numbers represent the sum <strong>of</strong> cyclists counted during a single<br />
2-hour AM and a single 2-hour PM peak period.<br />
10 Busiest Peak Hour Bike Locations<br />
1 3rd St / Campbell Ave 992<br />
2 University Blvd / Park Ave 986<br />
3 Helen St / Mountain Ave 771<br />
4 2nd St / Highland Ave 566<br />
5 Old Spanish Trail /<br />
Freeman Rd Weekend 487<br />
6 3rd St / Country Club Rd 340<br />
7 Blacklidge Dr / Mountain Ave 307<br />
8 Rillito Pathway /<br />
Mountain Ave - North Weekend 292<br />
9 University Blvd / Stone Ave 291<br />
10 9th St / 4th Ave 271<br />
The table below shows the 10 busiest Sun Tran routes for 2010<br />
as measured by the number <strong>of</strong> passengers that board buses each<br />
year.<br />
10 Highest Ridership Bus Routes<br />
Route# Description Total Passengers<br />
1 8 Broadway/South 6th Ave 3,228,740<br />
2 16 12th Ave/Oracle 1,933,424<br />
3 4 Speedway 1,654,037<br />
4 11 Alvernon/Ajo 1,328,097<br />
5 6 South Park/North First Ave 1,265,221<br />
6 3 6th St/Wilmot 945,612<br />
7 17 Country Club/29th St 892,460<br />
8 9 Grant 785,954<br />
9 7 22nd St 782,808<br />
10 34 Craycr<strong>of</strong>t 658,295
Revenue and Expenditures<br />
The region’s transportation system is funded from a mix <strong>of</strong> local,<br />
regional, state and federal sources.<br />
Revenue<br />
Local Funding<br />
Local funding for transportation comes from various jurisdictional<br />
impact fees, general funds, construction sales taxes, transit<br />
fares and other sources.<br />
Regional Funding<br />
In 2006, voters approved the $2.1 billion, 20-year Regional Transportation<br />
Authority (RTA) plan, paid for with a half-cent countywide<br />
sales tax in <strong>Pima</strong> County. Since its passage, the revenue<br />
raised through the RTA has been vital for funding many transportation<br />
projects in the region, some years accounting for as<br />
much as 60 percent to 70 percent <strong>of</strong> the programmed funds for<br />
regional transportation projects. The RTA plan contains a number<br />
<strong>of</strong> roadway, safety, environmental and economic vitality, and<br />
transit improvements. Between FY 2007-2008 and FY 2010-2011,<br />
the RTA collected $283.9 million in sales tax revenue.<br />
State Funding<br />
State funding for transportation comes primarily from the Highway<br />
User Revenue Fund (HURF), which is raised through gasoline<br />
taxes, vehicle registration fees, vehicle license taxes and other<br />
sources. State HURF funds typically are allocated for roadway<br />
projects, unlike other funding sources which are generally more<br />
flexible and can be used for transit, bike, pedestrian and other<br />
projects. The current<br />
Arizona fuel tax rate is 19<br />
cents per gallon for gas<br />
and 27 cents per gallon<br />
for diesel fuel, <strong>of</strong> which<br />
18 cents and 26 cents,<br />
respectively, is committed<br />
to the state HURF.<br />
Federal Funding<br />
Federal funding for<br />
transportation comes<br />
from a wide variety <strong>of</strong><br />
federal programs including<br />
the Surface Transportation<br />
Program (STP),<br />
which provides flexible<br />
funding that may be<br />
used for projects on any<br />
roadway that is eligible<br />
to receive federal funds.<br />
The current federal gas<br />
tax rate, the primary<br />
source <strong>of</strong> STP funding, is<br />
18.4 cents per gallon.<br />
Selected RTA-Funded System<br />
Improvements FY2006-2011<br />
Total centerline<br />
roadway miles added 19<br />
Intersection safety and<br />
capacity improvements 95<br />
Park and rides built 6<br />
Bus pullouts built 44<br />
Bus services<br />
Expanded evening and<br />
weekend services 44<br />
Frequency and<br />
overcrowding relief projects 6<br />
Express service added 7<br />
Neighborhood circulator<br />
routes started 11<br />
Safety<br />
Bike facility miles added 162<br />
Sidewalk miles added 101<br />
Pathway miles added 18<br />
HAWK pedestrian crossing<br />
signal installations 42<br />
Expenditures<br />
Operations and Maintenance<br />
Currently, PAG member jurisdictions spend a combined total<br />
<strong>of</strong> roughly $120 million annually on maintaining and operating<br />
the region’s transportation system. This includes funding spent<br />
on local roads and roads <strong>of</strong> regional significance as well as on<br />
regional transit services. While considerable, the amount spent<br />
on operations and maintenance falls short <strong>of</strong> what is needed to<br />
maintain the transportation system at a high level.<br />
Projects<br />
Although costs can vary year-to-year, the region typically<br />
programs between $150 million to $280 million annually for<br />
transportation projects <strong>of</strong> regional significance based on funding<br />
availability and project schedules. In 2010, $185 million was<br />
programmed in the region.<br />
The RTA funded 420 projects through the first five-year period <strong>of</strong><br />
the plan, resulting in expanded transit service, completion <strong>of</strong> a<br />
number <strong>of</strong> safety and intersection projects, the addition <strong>of</strong> over<br />
100 miles each <strong>of</strong> bike facilities and sidewalks, and increased<br />
roadway capacity.<br />
*Bike facilities include bike routes, bike routes with striped shoulders,<br />
shared use paths, and bus/bike lanes.
Congestion and Pavement Conditions<br />
Roadway Congestion<br />
Volume-to-Capacity Ratio (V/C ratio)<br />
One way to measure roadway congestion is with a roadway<br />
volume-to-capacity ratio (V/C ratio). Congestion levels are defined<br />
as follows:<br />
Severe Congestion: V/C Ratio Greater than 1 (0.56% <strong>of</strong> VMT in 2010)<br />
Heavy Congestion: V/C Ratio .75 to 1: (4.96% <strong>of</strong> VMT in 2010)<br />
Moderate Congestion: V/C Ratio .5 to .74: (21.05% <strong>of</strong> VMT in 2010)<br />
Low to No Congestion: V/C Ratio less than .5: (73.43% <strong>of</strong> VMT in 2010)<br />
In 2010, about 5.5 percent <strong>of</strong> total VMT in the region occurred<br />
under heavy to severe congestion conditions, up from 4.5 percent<br />
in 2005.<br />
Note: VMT traveled under heavy to severe congestion is considerably lower than what<br />
was estimated in some past reports, owing to a change in the way in which the V/C<br />
ratio is calculated. Earlier reports, such as the 2000 to 2005 System Performance Assessment,<br />
derived the V/C ratio by using an Average Daily Traffic method to measure<br />
traffic volume, an approach that tends to result in higher congestion level estimates.<br />
V/C ratio is now calculated by modeling peak period and non-peak period volumes<br />
proportional to total VMT, a method that yields a more accurate reflection <strong>of</strong> actual<br />
travel conditions.<br />
Percent<br />
80<br />
70<br />
60<br />
50<br />
40<br />
30<br />
20<br />
10<br />
0<br />
Roadway Congestion<br />
2005-2010<br />
Low to No<br />
Congestion<br />
Moderate<br />
Congestion<br />
2005<br />
2010<br />
Heavy<br />
Congestion<br />
Severe<br />
Congestion
Sandario Sandario Rd Rd<br />
Sandario Rd<br />
Cam. de Oeste Cam. de Oeste<br />
La Canada La Canada Dr Dr<br />
La Cholla La Blvd Cholla Blvd<br />
La Cañada La Dr Cañada Dr<br />
1st Ave<br />
Swan Rd<br />
Thornydale Thornydale Rd Rd<br />
Kolb Rd<br />
Houghton Houghton Rd Rd<br />
Kolb Rd<br />
Harrison Harrison Rd Rd<br />
Craycr<strong>of</strong>t Craycr<strong>of</strong>t Rd Rd<br />
Sandario Sandario Rd Rd<br />
Cam. de Oeste Cam. de Oeste<br />
La Canada La Canada Dr Dr<br />
La Cholla La Blvd Cholla Blvd<br />
La Cañada La Dr Cañada Dr<br />
1st Ave<br />
1st Ave<br />
Swan Rd<br />
Swan Rd<br />
Thornydale Thornydale Rd Rd<br />
Kolb Rd<br />
Houghton Houghton Rd Rd<br />
Kolb Rd<br />
Kolb Rd<br />
1st Ave<br />
Swan Rd<br />
Cam. de Oeste<br />
La Canada Dr<br />
La Cholla Blvd<br />
La Cañada Dr<br />
1st Ave<br />
Swan Rd<br />
Houghton Rd<br />
Kolb Rd<br />
Harrison Rd<br />
Harrison Harrison Rd Rd<br />
Craycr<strong>of</strong>t Rd<br />
Sandario Rd<br />
Thornydale Rd<br />
La Cañada Dr<br />
Craycr<strong>of</strong>t Craycr<strong>of</strong>t Rd Rd<br />
1st Ave<br />
Swan Rd<br />
Cam. de Oeste<br />
Thornydale Rd<br />
La Canada Dr<br />
La Cholla Blvd<br />
Houghton Rd<br />
Harrison Rd<br />
Craycr<strong>of</strong>t Rd<br />
Roadway Congestion<br />
2010 TUCSON METRO TRAFFIC CONGESTION (MORNING PEAK HOURS AND AFTERNOON PEAK)<br />
2010 TUCSON 2010 Max TUCSON METRO V/C Ratio METRO TRAFFIC - AM TRAFFIC Peak CONGESTION CONGESTION (MORNING (MORNING PEAK Max HOURS PEAK V/C HOURS Ratio AND - AFTERNOON PM AND Peak AFTERNOON PEAK) PEAK)<br />
Max V/C Max Ratio V/C - AM Ratio Peak - AM Peak<br />
Max V/C Max Ratio V/C - PM Ratio Peak - PM Peak<br />
Max V/C Ratio – Morning Peak Hours<br />
Max V/C Ratio – Afternoon Peak Hours<br />
2010 <strong>Tucson</strong> Metro Traffic Congestion Maps – Morning Peak Hours vs. Afternoon Peak Hours<br />
!a<br />
!a<br />
!a<br />
Avra Valley Rd<br />
Avra Valley Rd<br />
Twin Peaks Rd<br />
Tangerine Rd<br />
Tangerine Rd<br />
Avra Valley Rd<br />
Tangerine Rd<br />
?Ä<br />
?Ä ?Ä<br />
PINAL COUNTY<br />
PIMA COUNTY<br />
PINAL COUNTY PINAL COUNTY<br />
PIMA COUNTY PIMA COUNTY<br />
!a<br />
!a<br />
!a<br />
Avra Valley Rd<br />
Avra Valley Rd<br />
Twin Peaks Rd<br />
Tangerine Rd<br />
Tangerine Rd<br />
Avra Valley Rd<br />
Tangerine Rd<br />
?Ä<br />
?Ä ?Ä<br />
PINAL COUNTY<br />
PIMA COUNTY<br />
PINAL COUNTY PINAL COUNTY<br />
PIMA COUNTY PIMA COUNTY<br />
Twin Peaks Rd<br />
Twin Peaks Rd<br />
Ina Rd<br />
Twin Peaks Rd<br />
Twin Peaks Rd<br />
Ina Rd<br />
Ina Rd<br />
Sunrise Dr<br />
Ina Rd<br />
Ina Rd<br />
Sunrise Dr<br />
Ina Rd<br />
Ajo Hwy<br />
Ajo Hwy<br />
?Ï<br />
?Ï<br />
Ajo Hwy<br />
Valencia Rd<br />
Silverbell Rd<br />
Gates Pass Rd<br />
Gates Pass Rd<br />
Kinney Rd<br />
Valencia Rd<br />
Silverbell Rd<br />
Kinney Rd<br />
?Ï<br />
Mission Rd<br />
Mission Rd<br />
Irvington<br />
Irvington<br />
Valencia Rd<br />
Silverbell Rd<br />
Gates Pass Rd<br />
Kinney Rd<br />
Rd<br />
Rd<br />
!d<br />
!d<br />
Mission Rd<br />
Irvington<br />
Nogales Nogales Hwy Hwy<br />
Rd<br />
Alvernon Alvernon Way Way<br />
!d<br />
Grant Rd<br />
Wilmot Rd Wilmot Rd<br />
Sunrise Dr Sunrise Dr<br />
River Rd<br />
Grant Rd<br />
Nogales Hwy<br />
River Rd<br />
Alvernon Way<br />
Wilmot Rd<br />
Sahuarita Rd<br />
Tanque Verde Rd<br />
River Rd<br />
Grant Rd<br />
Tanque Verde Rd Tanque Verde Rd<br />
Sahuarita Rd Sahuarita Rd<br />
Speedway Blvd Speedway Blvd<br />
22nd St<br />
Irvington Rd<br />
Speedway Blvd<br />
Broadway Blvd<br />
Golf Links Rd<br />
Broadway Blvd Broadway Blvd<br />
Escalante<br />
22nd St<br />
Rd<br />
22nd St<br />
Golf Links Rd<br />
Golf Links Rd<br />
Escalante Rd Escalante Rd<br />
Irvington Rd Irvington Rd<br />
!a<br />
!a !a<br />
Ajo Hwy<br />
Ajo Hwy<br />
?Ï<br />
?Ï<br />
Ajo Hwy<br />
Valencia Rd<br />
Silverbell Rd<br />
Gates Pass Rd<br />
Gates Pass Rd<br />
Kinney Rd<br />
Valencia Rd<br />
Silverbell Rd<br />
Kinney Rd<br />
?Ï<br />
Mission Rd<br />
Mission Rd<br />
Irvington<br />
Irvington<br />
Valencia Rd<br />
Silverbell Rd<br />
Gates Pass Rd<br />
Kinney Rd<br />
Rd<br />
Rd<br />
!d<br />
!d<br />
Mission Rd<br />
Irvington<br />
Nogales Nogales Hwy Hwy<br />
Rd<br />
Alvernon Alvernon Way Way<br />
!d<br />
Grant Rd<br />
Wilmot Rd Wilmot Rd<br />
Sunrise Dr Sunrise Dr<br />
River Rd<br />
Grant Rd<br />
Nogales Hwy<br />
River Rd<br />
Alvernon Way<br />
Wilmot Rd<br />
Sahuarita Rd<br />
Tanque Verde Rd<br />
River Rd<br />
Grant Rd<br />
Tanque Verde Rd Tanque Verde Rd<br />
Sahuarita Rd Sahuarita Rd<br />
Speedway Blvd Speedway Blvd<br />
22nd St<br />
Irvington Rd<br />
Speedway Blvd<br />
Broadway Blvd<br />
Golf Links Rd<br />
Broadway Blvd Broadway Blvd<br />
Escalante<br />
22nd St<br />
Rd<br />
22nd St<br />
Golf Links Rd<br />
Golf Links Rd<br />
Escalante Rd Escalante Rd<br />
Irvington Rd Irvington Rd<br />
!a<br />
!a !a<br />
Average V/C ratio: 0.36<br />
Maximum V/C ratio: 1.87<br />
Average V/C ratio: Average V/C 0.36ratio: 0.36<br />
Maximum V/C Maximum ratio: 1.87 V/C ratio: 1.87<br />
p<br />
V/C (Volume/Capacity) is the ratio <strong>of</strong> travel<br />
demand during a certain time period<br />
V/C (volume) (Volume/Capacity) to the V/C number (Volume/Capacity) is <strong>of</strong> the vehicles ratio <strong>of</strong> the is travel the ratio <strong>of</strong> travel<br />
street demand can during hold demand (capacity). a certain during time a period certain time period<br />
(volume) to the (volume) number to <strong>of</strong> the vehicles number the <strong>of</strong> vehicles the<br />
street can hold street (capacity). can hold (capacity).<br />
Vehicle Miles Traveled (VMT)<br />
The above maps show AM (6:30 to 8:30 a.m.) and PM (4:00 to<br />
6:00 p.m.) peak hour congestion levels on major and minor arterial<br />
roads and collector streets for eastern <strong>Pima</strong> County.<br />
Between 2005 and 2010, the region increased roadway capac-<br />
p<br />
?Ë<br />
?Ë<br />
0 5 10<br />
0 Miles 50 105 10<br />
Heavy (0.76 - 1.00) Low (0.00 - 0.50)<br />
Severe (1.01 - 2.00) Severe (1.01 Moderate - 2.00) (0.51 Moderate - 0.75) (0.51 - 0.75)<br />
Miles<br />
?Ë<br />
Miles<br />
Average V/C ratio: 0.38<br />
Maximum V/C ratio: 1.76<br />
Average V/C ratio: Average V/C 0.38ratio: 0.38<br />
Maximum V/C Maximum ratio: 1.76 V/C ratio: 1.76<br />
Severe (1.01 - 2.00)<br />
Moderate (0.51 - 0.75)<br />
Heavy (0.76 - 1.00) Heavy (0.76 Low - 1.00) (0.00 - 0.50) Low (0.00 - 0.50)<br />
ity by 3.2 percent, adding roughly 145 miles <strong>of</strong> new travel lanes.<br />
However, roadway demand, which is measured in VMT, increased<br />
by 13.5 percent during the same period, leading to a slight increase<br />
in congestion levels.<br />
?Ë<br />
?Ë<br />
?Ë<br />
Pavement Condition<br />
The International Roughness Index (IRI) is a measure used to<br />
assess the ride quality, or pavement condition, <strong>of</strong> the roadway.<br />
IRI is recorded using the Automated Road Analyzer (ARAN) van,<br />
which is driven along the region’s roads capturing a data point<br />
every 26.4 feet. The ARAN van is operated on behalf <strong>of</strong> the PAG<br />
region by agreement between PAG and the City <strong>of</strong> <strong>Tucson</strong>. The<br />
chart to the right represents the roadway pavement condition<br />
for combined data points recorded from 2008 to 2010.<br />
IRI Pavement Condition<br />
for the <strong>Tucson</strong> Region<br />
21.57%<br />
Good<br />
Pavement condition<br />
IRI Pavement Condition for the <strong>Tucson</strong> Region<br />
52.40%<br />
Poor<br />
4.54%<br />
Excellent<br />
21.49%<br />
Fair
Performance<br />
PAG evaluates intersection performance by traffic delay and<br />
traffic volume. Delay per vehicle (sec/veh) measures the average<br />
amount <strong>of</strong> time it takes for a vehicle to move through an intersection,<br />
while traffic volume is a measurement <strong>of</strong> the total number<br />
<strong>of</strong> vehicles that move through an intersection during combined<br />
morning and evening peaks hours. The chart below shows the 15<br />
most congested intersections based on vehicle delay.<br />
Traffic volumes can fluctuate significantly from year-to-year<br />
Congested Intersections<br />
Busiest Intersection Based on Weighted Average<br />
Peak Hour Delay/Vehicle (Seconds/Vehicle)<br />
Intersection Average Weighted Vehicle Delay Volume<br />
Ajo Way/Alvernon Way 199.18 12459<br />
Ina Rd/SR77 115.78 14740<br />
Irvington/Kolb Rd 115.73 9480<br />
Valencia Rd/Kolb Rd 112.22 10621<br />
Orange Grove Rd/Camino de La Tierra 99.05 7112<br />
Cortaro Farms Rd/Shannon Rd 98.85 5054<br />
Golf Links/Wilmot Rd 97.36 12417<br />
River Rd/La Cañada Dr 90.15 10126<br />
Golf Links/Swan Rd 89.10 13723<br />
Sunrise Dr/Kolb Rd 88.37 5306<br />
Tanque Verde/Grant Rd 83.54 15988<br />
River Rd/Craycr<strong>of</strong>t Rd 80.73 6303<br />
Tanque Verde/Sabino Canyon Rd 74.38 12617<br />
Wetmore Rd/La Cañada Dr 72.32 9632<br />
Broadway Blvd/Pantano Rd 66.18 11792<br />
depending on the exact time intersections are counted. These<br />
counts represent a sample from December 2011.<br />
Some high-volume intersections do not result in long delays<br />
(ex. 22nd/Kolb) because they have improved lane capacity and<br />
configuration, as well as good signal timing. Conversely, intersections<br />
showing high average vehicle delay with relatively low<br />
traffic volumes (ex. Sunrise/Kolb) <strong>of</strong>ten have poor left turn and<br />
through capacity.<br />
Busiest Intersection Based on<br />
AM-PM Peak Hour Volume<br />
Intersection – Volume<br />
Intersection Average Weighted Vehicle Delay Volume<br />
Tanque Verde/Grant Rd 83.54 15988<br />
Broadway Blvd/Kolb Rd 59.94 15738<br />
Speedway Blvd/Wilmot Rd 45.61 15070<br />
Ina Rd/SR77 115.78 14740<br />
22nd St/Kolb Rd 32.73 14590<br />
Golf Links/Kolb Rd 42.04 14444<br />
Speedway Blvd/Kolb Rd 46.43 14248<br />
Broadway Blvd/Wilmot Rd 56.09 14139<br />
Congress/I-10 EB Frontage Rd 26.07 13960<br />
22nd St/Wilmot Rd 45.57 13897<br />
Broadway Blvd/Craycr<strong>of</strong>t Rd 27.03 13803<br />
Golf Links/Swan Rd 89.10 13723<br />
Speedway Blvd/Campbell Ave 41.36 13557<br />
22nd St/Alvernon Way 35.30 13504<br />
22nd St/Craycr<strong>of</strong>t Rd 42.01 12864<br />
Improvements to Grant / Craycr<strong>of</strong>t were done as part <strong>of</strong> the<br />
RTA’s Intersection project category. The project included the<br />
addition <strong>of</strong> dual left turn bays and right turn bays in all directions<br />
as well as new traffic signal timing plans. The results have<br />
shown notable improvements to the operation <strong>of</strong> the intersection<br />
with significant reductions in overall delay and vehicle<br />
stops. The project resulted in a delay reduction <strong>of</strong> 24 percent<br />
for the morning rush hour with 19 percent fewer stops. The<br />
evening rush hour resulted in a delay reduction <strong>of</strong> 36 percent<br />
with 31 percent fewer stops.<br />
Grant and Craycr<strong>of</strong>t Intersection Performance<br />
Before RTA After RTA Percent<br />
Improvements Improvements Reduction<br />
Total AM Peak Hour Delay 15.7 hours 11.7 hours 25.48%<br />
AM Stops 868 703 19.01%<br />
Total PM Peak Hour Delay 21.1 hours 13.4 hours 36.49%<br />
PM Stops 1262 868 31.22%
Transit, Bike and Pedestrian Performance<br />
Transit<br />
Transit ridership on Sun Tran increased by 25 percent from 2005<br />
to 2010 far outpacing the region’s population growth. Much<br />
<strong>of</strong> the growth in ridership was due to additional service hours<br />
made possible with RTA funding. Additionally, Sun Shuttle, a<br />
neighborhood circulator service that connects to Sun Tran, was<br />
launched in 2009 greatly expanding transit services in more rural<br />
areas and outlying neighborhoods.<br />
Transit 2005-2010 comparison<br />
2005 2010<br />
Annual revenue miles* 9,485,954 11,208,607<br />
Average weekday ridership* 56,389 70,652<br />
Sun Tran annual ridership* 16,620,475 20,847,575<br />
Sun Tran on-time performance<br />
(monthly avg.) 87%<br />
Annual operating expenses* $48,734,815 $63,815,959<br />
Vehicles operated at<br />
maximum service* 249 318<br />
Neighborhood circulator<br />
annual ridership** 80,698 197,337<br />
Neighborhood circulator<br />
revenue miles** 393,015 1,025,782<br />
Percent <strong>of</strong> population living<br />
within 1/4 mile <strong>of</strong> a transit stop N/A 48%<br />
*Includes Sun Tran fixed-route bus service as well as Sun Van paratransit service<br />
**Neighborhood circulator service expanded and renamed Sun Shuttle in 2009<br />
Source: National Transit Database and Sun Tran and Sun Shuttle Monthly Reports<br />
Job access<br />
An important goal for any transit system is to provide access to<br />
employment opportunities. Employment access also can serve<br />
as a proxy measure for transit access to many goods, services<br />
and destinations. Within the PAG region roughly 79 percent <strong>of</strong><br />
employers are located within ¼ mile <strong>of</strong> a bus stop.<br />
Employers Accessible to Transit<br />
by Number <strong>of</strong> Employees<br />
1 - 9<br />
10 - 49<br />
50 - 99<br />
100 - 499<br />
500 +<br />
Bike and Pedestrian<br />
The <strong>Tucson</strong> region is widely recognized as one <strong>of</strong> the leading<br />
bike-friendly communities in the country, currently holding a<br />
gold designation from the League <strong>of</strong> American Bicyclists. Since<br />
2000, the region has more than doubled the number <strong>of</strong> bike<br />
facility lane miles.<br />
Total Miles <strong>of</strong> Bike Facilities 2000-2010 comparison<br />
2000 2010<br />
Total miles <strong>of</strong> bike facilities 439 966<br />
Miles per 100,000 residents 52 98<br />
Regional Bike and Pedestrian Count<br />
Each year in October, <strong>Pima</strong> <strong>Association</strong> <strong>of</strong> <strong>Governments</strong> conducts<br />
a bike and pedestrian count at selected intersections across the<br />
region. The count consists <strong>of</strong> PAG staff and volunteers counting<br />
bike activity for two hours during morning and evening peak<br />
travel times.<br />
In 2010, 20,896 cyclists and 14,248 pedestrians were counted at<br />
98 locations. The busiest bike and pedestrian areas are located in<br />
high-activity areas around the University <strong>of</strong> Arizona and downtown<br />
1 <strong>Tucson</strong>. - 9<br />
The same 39 core locations have been counted every year since<br />
2008 and average 6,533 bikes per year combined for all locations.<br />
8,000<br />
7,000<br />
6,000<br />
5,000<br />
4,000<br />
3,000<br />
2,000<br />
Bike Count <strong>of</strong> Core Locations<br />
2008 2009 2010 2011<br />
Pedestrian Infrastructure<br />
In 2012, PAG and the City <strong>of</strong> <strong>Tucson</strong> released the ADA Sidewalk<br />
Inventory Study Report, which examined pedestrian accessibility<br />
along the region’s arterial and collector roads. The inventory<br />
identified approximately 3,670 miles <strong>of</strong> roadway in the region<br />
with sidewalks on both sides <strong>of</strong> the road. However, <strong>of</strong> the<br />
sidewalk segments studied, many were found to contain physical<br />
barriers, such as missing sidewalks or ramps, that left them<br />
totally or partially inaccessible to many users. The most inaccessible<br />
parts <strong>of</strong> the sidewalk network were concentrated primarily<br />
in older areas developed before the 1980s or in parts <strong>of</strong> the<br />
region with a more rural character.<br />
The RTA has addressed some <strong>of</strong> these gaps by funding more<br />
than 100 miles <strong>of</strong> new sidewalks with another 170 miles in design<br />
or under construction.
Environment<br />
Air Quality<br />
In 2011, cars, buses and trucks emitted about 318 U.S. tons <strong>of</strong><br />
pollutants per day in eastern <strong>Pima</strong> County (CO, NOx, and VOC<br />
emissions). According to a 2008 report from the U.S. Environmental<br />
Protection Agency, on-road emissions account for<br />
roughly 40 percent <strong>of</strong> the region’s total emissions.<br />
PAG’s On-Road Mobile Emissions Inventory for<br />
<strong>Pima</strong> County (2008)<br />
environmental impacts. While total CO2e emissions in <strong>Pima</strong><br />
County have increased since 1990, per capita emissions have<br />
fallen around 3.8 percent to 16.7 U.S. tons per person. This was<br />
slightly lower than the United States as a whole, which emitted<br />
19.6 U.S. tons per person.<br />
On-road sources contribute roughly one third <strong>of</strong> all CO2e emissions<br />
in eastern <strong>Pima</strong> County. Since 1990, per capita on-road<br />
emissions have fallen by more than 10.5 percent due largely to<br />
the improved fuel economy <strong>of</strong> all classes <strong>of</strong> vehicles.<br />
on-Road Mobile Only (U.S. tons)<br />
Carbon Monoxide (CO) 132,700<br />
Oxides <strong>of</strong> Nitrogen (NOx) 22,883<br />
Volatile Organic Compounds (VOC) 11,766<br />
Total on-road emissions 167,349<br />
In 2010, eastern <strong>Pima</strong> County emitted around 15.8 million U.S.<br />
tons <strong>of</strong> greenhouse gases from all sources. Measured in terms <strong>of</strong><br />
carbon dioxide equivalents (CO2e), excessive emissions <strong>of</strong> greenhouse<br />
gases are widely considered to have harmful long-term<br />
Millions<br />
6<br />
4<br />
2<br />
0<br />
On-Road CO 2 e Emissions<br />
1990 - 2010<br />
1990 2000 2005 2010<br />
Total on-road CO 2 e emissions (U.S. tons)<br />
On-road CO 2 e emissions per capita (U.S. tons)<br />
5<br />
3<br />
1<br />
3-Year Average <strong>of</strong> the 4th Highest 8-Hour Ozone Concentration<br />
0.10<br />
0.08<br />
0.06<br />
Fairgrounds<br />
Tangerine<br />
22nd St./Craycr<strong>of</strong>t<br />
Saguaro Nat’l Park East<br />
Pre-2008 Ozone Standard<br />
Current Ozone Standard<br />
2000 2002 2004 2006 2008 2010<br />
Ozone is a naturally occurring gas that forms in the upper atmosphere.<br />
However, at ground level, ozone is a harmful respiratory<br />
irritant, particularly to children and the elderly, and can damage<br />
local plants. Ozone is formed when volatile organic compounds<br />
(VOC) and oxides <strong>of</strong> nitrogen (NOx) emitted from tailpipes and<br />
stationary sources react in the presence <strong>of</strong> sunlight. Ozone concentrations<br />
in <strong>Pima</strong> County have remained relatively stable over<br />
the last 10 years and are currently at 90 percent <strong>of</strong> the 0.075ppm<br />
federal standard. In 2013, the EPA is expected to propose new<br />
ozone standards which may be lower than the current standard.<br />
Lowering the ozone standard could potentially place <strong>Pima</strong><br />
County in violation and result in environmental and monetary<br />
sanctions.<br />
Pollution Control Measures<br />
Clean Cities<br />
The Clean Cities program is a voluntary national effort to increase<br />
clean fuel vehicle usage. The <strong>Tucson</strong> region received its<br />
initial Clean Cities designation in 1999. Since 2002, the number<br />
<strong>of</strong> clean fuel vehicles on the road has increased by an estimated<br />
238 percent. In 2010 alone these vehicles were largely responsible<br />
for displacing 12.1 million gasoline gallon-equivalents with<br />
other fuel sources.<br />
Travel Reduction Program<br />
<strong>Pima</strong> <strong>Association</strong> <strong>of</strong> <strong>Governments</strong>’ Travel Reduction Program<br />
is mandatory for employers that have more than 100 full-time<br />
equivalent employees at a single or contiguous worksite, and<br />
voluntary for those with fewer employees. The purpose <strong>of</strong> the<br />
program is to improve air quality in the region by encouraging<br />
employees to take alternative modes <strong>of</strong> transportation to work.<br />
There are currently 290 employers enrolled in the program, representing<br />
128,690 employees.<br />
In 2011, TRP employers helped improve the environment by saving<br />
an estimated:<br />
83.8<br />
$46.1<br />
million<br />
vehicle miles<br />
million savings<br />
(due to reduction in fuel use and maintenance costs)<br />
U.S. tons <strong>of</strong> onroad<br />
emissions 3.7 gallons<br />
million<br />
(CO, NOx, VOC) <strong>of</strong> gasoline<br />
1,200<br />
46,307 tons <strong>of</strong> C0 2 e
Safety<br />
Mirroring national trends, <strong>Pima</strong> County’s traffic accident, injury<br />
and fatality rates decreased dramatically from 2005 to 2010.<br />
The fatality rate in particular – measured in fatalities per<br />
100 million VMT – fell by 26 percent during the period.<br />
Across the country, driving on our roads and highways has never<br />
been safer, with the nation achieving a historically low national<br />
traffic fatality rate <strong>of</strong> 1.11 per 100 million VMT in 2010.<br />
Vehicle crashes by type <strong>Pima</strong> County<br />
25,000<br />
20,000<br />
15,000<br />
10,000<br />
5,000<br />
0<br />
2005 2006 2007 2008 2009 2010<br />
Fatalities per 100 million VMT<br />
<strong>Pima</strong> County and Arizona<br />
2.50 <br />
2.00 <br />
1.50 <br />
1.00 <br />
0.50 <br />
0<br />
2005 2008 2010<br />
0.00 <br />
2005 2008 2010 <br />
Total Crashes<br />
Crashes with<br />
property<br />
damage only<br />
Total Injuries<br />
Crashes with<br />
injuries<br />
<strong>Pima</strong> County <br />
Arizona <br />
Each year bicyclists and pedestrians represent a disproportionate<br />
share <strong>of</strong> the region’s total traffic fatalities, <strong>of</strong>ten accounting<br />
for 15 percent to 25 percent <strong>of</strong> those who lose their lives in<br />
accidents.<br />
Vehicle-Pedestrian Crashes by Type 2005-2010<br />
2005 2006 2007 2008 2009 2010<br />
Total pedestrian<br />
Crashes 262 262 280 299 288 261<br />
Injury or Possible Injury 220 225 242 265 246 218<br />
Fatalities 28 20 24 13 19 19<br />
Vehicle-Bicycle Crashes by Type 2005-2010<br />
2005 2006 2007 2008 2009 2010<br />
Total Bicycle Crashes 319 328 360 359 352 309<br />
Injury or Possible Injury 276 282 310 314 287 271<br />
Fatalities 6 6 2 7 4 0*<br />
All data comes from Arizona statewide crash database. It is estimated<br />
that there were 4 bicycle fatalities in 2010, which are not<br />
represented in the data.<br />
Crashes per 100 million VMT <strong>Pima</strong> County and Arizona<br />
300.00 <br />
250.00 <br />
200.00 <br />
150.00 <br />
100.00 <br />
50.00 <br />
0.000<br />
<br />
2005 2008 2010<br />
<br />
<strong>Pima</strong> County <br />
Arizona <br />
High-intensity Activated Crosswalks<br />
To date, the RTA has funded 42 high-intensity activated crosswalk<br />
(HAWK) projects as a way to improve pedestrian safety in<br />
the region, a measure that was pioneered in <strong>Tucson</strong> and is now<br />
being used in cities nationwide.<br />
In order to quantify the effectiveness <strong>of</strong> HAWK installations, the<br />
Federal Highway Administration conducted a three-year study<br />
<strong>of</strong> a sample <strong>of</strong> HAWK crossings in the <strong>Tucson</strong> region. The study<br />
found that those crossings with HAWK treatments experienced<br />
a 29 percent reduction in total crashes, a 15 percent reduction in<br />
severe crashes and a 69 percent reduction in pedestrian crashes.
Regional Comparison<br />
The following chart shows how the <strong>Tucson</strong> region compares to<br />
other similarly sized or western metropolitan regions in terms<br />
<strong>of</strong> transportation system performance. The <strong>Tucson</strong> region has a<br />
higher number <strong>of</strong> bike, pedestrian and transit commuters than<br />
many other communities. Commute time is about average, and<br />
<strong>Pima</strong> County has the 3rd highest traffic fatality rate as compared<br />
to other communities in this set. Note: Data refer to a variety <strong>of</strong><br />
geographic scales and should be used for comparative purposes<br />
only.<br />
Regional Comparison<br />
Population Drive to Work Public Travel Time Travel Time Freeway Daily Transit Traffic<br />
City MSA* Alone♎ Carpool♎ Transportation♎ Walk♎ Bike♎ to Work☨ Index# Miles# Ridership♈ Fatalities♓<br />
<strong>Tucson</strong>, AZ 980,263 75.74% 10.97% 2.51% 2.67% 1.32% 23.9 1.11 253 57,117 10.81<br />
Fresno, CA 930,450 76.31% 12.64% 1.47% 2.17% 0.60% 21.5 1.07 303 48,844 12.04<br />
Albuquerque, NM 887,077 78.47% 11.53% 1.66% 1.80% 0.88% 23.6 1.10 338 34,579 7.40<br />
Rochester, NY 1,054,323 81.52% 8.41% 2.05% 3.49% 0.42% 20.4 1.05 550 47,229 6.58<br />
Oklahoma City, OK 1,252,987 88.26% 11.74% 0.55% 1.66% 0.30% 21.4 1.10 778 7,687 11.20<br />
Tulsa, Ok 937,478 81.61% 11.25% 0.52% 1.46% 0.14% 20.9 1.08 758 7,446 9.45<br />
El Paso, TX 800,647 79.45% 11.01% 1.85% 2.13% 0.13% 22.4 1.16 449 41,028 6.87<br />
Austin, TX 1,716,289 75.14% 12.02% 2.61% 1.69% 0.62% 25.3 1.28 836 98,245 7.62<br />
Portland, OR 2,226,009 71.43% 10.13% 6.17% 3.28% 2.01% 24.8 1.25 793 285,978 4.22<br />
McAllen, TX 774,769 76.63% 13.69% 0.34% 1.39% 0.16% 21.0 1.10 306 294 9.03<br />
Salt Lake City, UT 1,124,197 75.97% 12.10% 3.24% 2.28% 0.80% 22.2 1.11 576 105,106 5.44<br />
Las Vegas, NV 1,951,269 78.17% 11.54% 3.64% 1.81% 0.46% 24.3 1.24 566 157,299 7.40<br />
Phoenix, AZ 4,192,887 75.83% 12.75% 2.21% 1.70% 0.73% 26.2 1.21 1,594 160,577 8.17<br />
Notes:<br />
*Source: Source: U.S. Census Bureau, 2010 Census for Metropolitan<br />
Statistical Areas<br />
♎Source: U.S. Census Bureau, 2006-2010 American Community<br />
Survey, Table B08301 Means <strong>of</strong> Transportation to Work for<br />
Metropolitan Statistical Areas<br />
☨Source: U.S. Census Bureau, 2006-2010 American Community<br />
Survey, Table DP03 Selected Economic Characteristics for<br />
Metropolitan Statistical Areas<br />
#Source: Texas Transportation Institute, 2011 Annual Urban Mobility<br />
Report Summary Tables. Urban Area Data Only (note: Urban<br />
Area refers only to locations exceeding a density <strong>of</strong> 1,000 people<br />
per square mile) Travel Time Index (TTI) is a congestion measure<br />
developed by the Texas Transportation Institute that measures the<br />
ratio <strong>of</strong> travel time during peak-period to travel time during free<br />
flow conditions.<br />
♈Source: Federal Transit Administration, National Transit Database<br />
♓(Traffic Fatalities per 100,000 Population) source: National<br />
Highway Traffic Safety Administration, Fatality Analysis Reporting<br />
System. Fatality rate based on county level data <strong>of</strong> principle county<br />
within the Metropolitan Statistical Area.
Safety<br />
Conclusion<br />
As a result <strong>of</strong> the national recession, population estimates were<br />
highly unpredictable during the second half <strong>of</strong> the last decade,<br />
resulting in downward revisions to traffic estimates following the<br />
release <strong>of</strong> the 2010 Census numbers.<br />
• The region grew much faster in suburban areas than in the<br />
urban core, and the vast majority <strong>of</strong> new housing units were<br />
single-family detached homes.<br />
Between 2005 and 2010, growth in the number <strong>of</strong> vehicle miles<br />
traveled once again outpaced the rate at which the region<br />
increased roadway capacity, demonstrating that, even in a sluggish<br />
economy with lower-than-expected population growth, it<br />
is very difficult, if not impossible, to manage congestion through<br />
road building alone.<br />
• Pavement maintenance continues to be a challenge in the<br />
region, with over 50 percent <strong>of</strong> recorded ARAN data points<br />
in poor condition.<br />
• 15 percent <strong>of</strong> intersections at morning peak hour and 19<br />
percent <strong>of</strong> intersections at evening peak hour experience<br />
traffic movements with an F level <strong>of</strong> service, meaning vehicles<br />
are delayed 80 seconds or more.<br />
• 5.5 percent <strong>of</strong> the total vehicle miles traveled in the region<br />
are under severe or heavy congestion, a slight increase over<br />
2005.<br />
• Traffic accident and fatality rates have decreased since 2005,<br />
falling at a faster rate than the state as a whole.<br />
The $2.1 billion RTA plan, approved by voters in 2006 has <strong>of</strong>fered<br />
a balanced solution to the region’s transportation challenges by<br />
funding 420 regional projects in the first five-year period <strong>of</strong> the<br />
RTA plan. The plan includes a mix <strong>of</strong> bike and pedestrian, safety,<br />
environmental, transit, intersection and roadway projects. The<br />
investment has resulted in both improvements in safety and<br />
growth in alternative modes usage.<br />
• Transit services have been expanded in the region to provide<br />
more express routes, neighborhood circulators and<br />
increased frequency. Transit ridership grew substantially<br />
between 2005 and 2010, and nearly 50 percent <strong>of</strong> <strong>Pima</strong><br />
County’s residents now live within ¼ mile <strong>of</strong> a bus stop.<br />
• Pedestrian and bike activity continues to be heaviest in<br />
areas with high concentrations <strong>of</strong> jobs and housing, such<br />
as around the University <strong>of</strong> Arizona and near downtown<br />
<strong>Tucson</strong>. The RTA has funded a number <strong>of</strong> infrastructure<br />
improvements for pedestrians and cyclists.<br />
• Transportation accounts for roughly 40 percent <strong>of</strong> all air<br />
pollutants emitted in the region. Per capita greenhouse gas<br />
emissions fell slightly between 1990 and 2010, but overall<br />
emissions are up. Ozone concentrations will continue to be<br />
a concern in the future as the federal government considers<br />
enacting more stringent standards.<br />
• The <strong>Tucson</strong> region compares favorably to peer communities<br />
in several priority areas. Fewer residents commute to<br />
work alone as compared to many other regions. The <strong>Tucson</strong><br />
region also has a relatively high number <strong>of</strong> bike, pedestrian<br />
and transit commuters. On the other hand, even though<br />
accident rates have been falling, the <strong>Tucson</strong> region still has a<br />
relatively high fatality rate per 100,000 residents, as compared<br />
to similarly sized regions.
notes<br />
notes
t<br />
t<br />
l<br />
r<br />
d<br />
Tortolita<br />
Mountain<br />
Park<br />
P I N A L C O U N T Y<br />
P I M A C O U N T Y<br />
C<br />
N<br />
C e n t r a l A<br />
r i z o n a<br />
arana<br />
orthwest<br />
egional<br />
irport<br />
P r o j e c<br />
t C a n a l<br />
Avra Valley Rd<br />
Marana<br />
Twin Peaks Rd<br />
S a n<br />
Tangerine Rd<br />
t a<br />
C r u z<br />
R i v e r<br />
10<br />
Thornydale Rd<br />
Arthur<br />
Pack<br />
Regional<br />
Park<br />
La Cholla<br />
Airpark<br />
C a ñ a d a d e l<br />
O<br />
r o<br />
Oro<br />
Valley<br />
La Canada Dr<br />
Oracle Rd<br />
P i m a<br />
W a s h<br />
e<br />
C a ñ a d a<br />
l<br />
O<br />
r o<br />
Catalina<br />
State Park<br />
C e n t r a l A r i z o n a<br />
Saguaro<br />
National Park<br />
(West Unit)<br />
P r o<br />
<strong>Tucson</strong><br />
Mountain<br />
Park<br />
j e c<br />
C a n a l<br />
Ryan<br />
Airfield<br />
Ajo Hwy<br />
86<br />
10<br />
Silverbell Rd<br />
Ina Rd<br />
C r u z R i v e<br />
77<br />
Oracle Rd<br />
South<br />
<strong>Tucson</strong><br />
19<br />
77<br />
1st Ave<br />
River Rd<br />
Prince Rd<br />
6th Ave<br />
Rillito<br />
Cr<br />
6th St<br />
<strong>Tucson</strong><br />
BSN<br />
19<br />
Campbell Ave<br />
Valencia Rd<br />
10<br />
Alvernon Wy<br />
Swan Rd<br />
Grant Rd<br />
Speedway Blvd<br />
Kolb Rd<br />
Pantano<br />
Davis-Monthan<br />
Air Force<br />
Base<br />
Irvington Rd<br />
Wash<br />
22nd St<br />
S a b<br />
Sabino Cyn Rd<br />
S a b i n o C r<br />
Golf Links Rd<br />
i n o<br />
T a n q u e<br />
C r<br />
Bear Cyn Rd<br />
Ve r d e<br />
C<br />
r<br />
B e a r<br />
C<br />
Snyde<br />
Catalina<br />
Broadway Blvd<br />
Harrison Rd<br />
Pascua Yaqui<br />
Tribe<br />
t<br />
W e s<br />
B<br />
t a<br />
r a n c h S a n<br />
<strong>Tucson</strong><br />
International<br />
Airport<br />
Valencia Rd<br />
Sandario Rd<br />
San Xavier District<br />
<strong>of</strong> the Tohono O’odham<br />
Nation<br />
C e n<br />
r a l A r i z o n a P r o j e c t C a n a<br />
Mission Rd<br />
19<br />
S a n t a<br />
C r u z R i v e r<br />
10<br />
Southeas<br />
Regiona<br />
Park<br />
BSN<br />
19<br />
stern <strong>Pima</strong> County<br />
MILES<br />
3 4 5 6 7 8 9 10<br />
Duval Mine Rd<br />
Sahuarita<br />
BSN<br />
19<br />
177 N. Church Ave., Suite 405<br />
<strong>Tucson</strong>, AZ 85701<br />
(520) 792-1093 [tel] Santa Rita<br />
(520) 620-6981 Experimental<br />
[fax]<br />
Range<br />
PAGregion.com<br />
Old <strong>Tucson</strong>-Nogales Hwy<br />
Whitehouse Canyon Rd