C:\Annual Report 1998\AR1998 fo - Peace Palace Library
C:\Annual Report 1998\AR1998 fo - Peace Palace Library
C:\Annual Report 1998\AR1998 fo - Peace Palace Library

You also want an ePaper? Increase the reach of your titles
YUMPU automatically turns print PDFs into web optimized ePapers that Google loves.
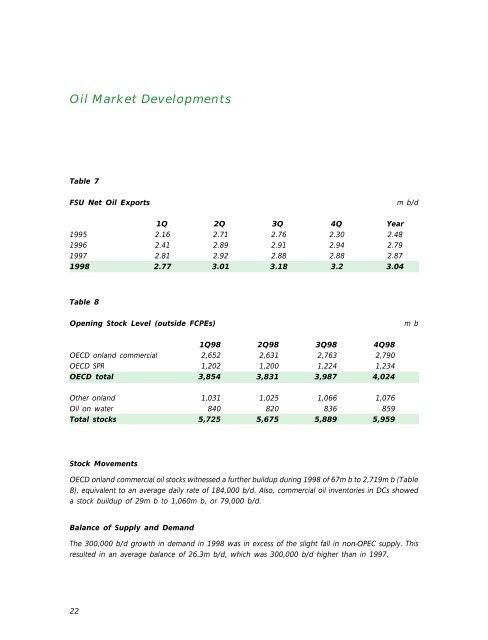
Oil Market Developments<br />
Table 7<br />
FSU Net Oil Exports<br />
m b/d<br />
1Q 2Q 3Q 4Q Year<br />
1995 2.16 2.71 2.76 2.30 2.48<br />
1996 2.41 2.89 2.91 2.94 2.79<br />
1997 2.81 2.92 2.88 2.88 2.87<br />
1998 2.77 3.01 3.18 3.2 3.04<br />
Table 8<br />
Opening Stock Level (outside FCPEs)<br />
m b<br />
1Q98 2Q98 3Q98 4Q98<br />
OECD onland commercial 2,652 2,631 2,763 2,790<br />
OECD SPR 1,202 1,200 1,224 1,234<br />
OECD total 3,854 3,831 3,987 4,024<br />
Other onland 1,031 1,025 1,066 1,076<br />
Oil on water 840 820 836 859<br />
Total stocks 5,725 5,675 5,889 5,959<br />
Stock Movements<br />
OECD onland commercial oil stocks witnessed a further buildup during 1998 of 67m b to 2,719m b (Table<br />
8), equivalent to an average daily rate of 184,000 b/d. Also, commercial oil inventories in DCs showed<br />
a stock buildup of 29m b to 1,060m b, or 79,000 b/d.<br />
Balance of Supply and Demand<br />
The 300,000 b/d growth in demand in 1998 was in excess of the slight fall in non-OPEC supply. This<br />
resulted in an average balance of 26.3m b/d, which was 300,000 b/d higher than in 1997.<br />
22