C:\Annual Report 1998\AR1998 fo - Peace Palace Library
C:\Annual Report 1998\AR1998 fo - Peace Palace Library
C:\Annual Report 1998\AR1998 fo - Peace Palace Library
You also want an ePaper? Increase the reach of your titles
YUMPU automatically turns print PDFs into web optimized ePapers that Google loves.
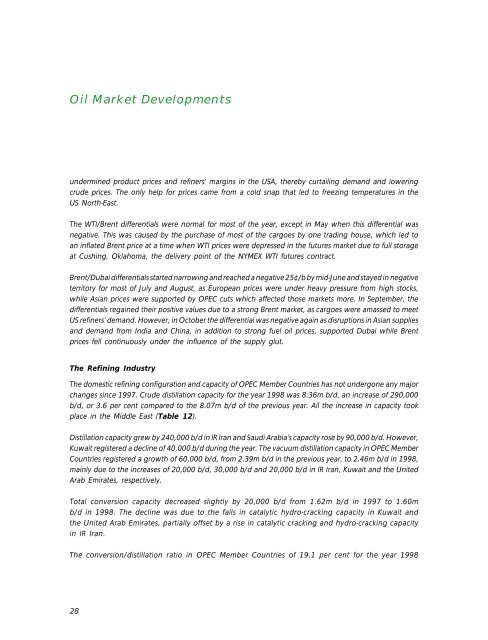
Oil Market Developments<br />
undermined product prices and refiners‘ margins in the USA, thereby curtailing demand and lowering<br />
crude prices. The only help <strong>fo</strong>r prices came from a cold snap that led to freezing temperatures in the<br />
US North-East.<br />
The WTI/Brent differentials were normal <strong>fo</strong>r most of the year, except in May when this differential was<br />
negative. This was caused by the purchase of most of the cargoes by one trading house, which led to<br />
an inflated Brent price at a time when WTI prices were depressed in the futures market due to full storage<br />
at Cushing, Oklahoma, the delivery point of the NYMEX WTI futures contract.<br />
Brent/Dubai differentials started narrowing and reached a negative 25¢/b by mid-June and stayed in negative<br />
territory <strong>fo</strong>r most of July and August, as European prices were under heavy pressure from high stocks,<br />
while Asian prices were supported by OPEC cuts which affected those markets more. In September, the<br />
differentials regained their positive values due to a strong Brent market, as cargoes were amassed to meet<br />
US refiners’ demand. However, in October the differential was negative again as disruptions in Asian supplies<br />
and demand from India and China, in addition to strong fuel oil prices, supported Dubai while Brent<br />
prices fell continuously under the influence of the supply glut.<br />
The Refining Industry<br />
The domestic refining configuration and capacity of OPEC Member Countries has not undergone any major<br />
changes since 1997. Crude distillation capacity <strong>fo</strong>r the year 1998 was 8.36m b/d, an increase of 290,000<br />
b/d, or 3.6 per cent compared to the 8.07m b/d of the previous year. All the increase in capacity took<br />
place in the Middle East (Table 12).<br />
Distillation capacity grew by 240,000 b/d in IR Iran and Saudi Arabia’s capacity rose by 90,000 b/d. However,<br />
Kuwait registered a decline of 40,000 b/d during the year. The vacuum distillation capacity in OPEC Member<br />
Countries registered a growth of 60,000 b/d, from 2.39m b/d in the previous year, to 2.46m b/d in 1998,<br />
mainly due to the increases of 20,000 b/d, 30,000 b/d and 20,000 b/d in IR Iran, Kuwait and the United<br />
Arab Emirates, respectively.<br />
Total conversion capacity decreased slightly by 20,000 b/d from 1.62m b/d in 1997 to 1.60m<br />
b/d in 1998. The decline was due to the falls in catalytic hydro-cracking capacity in Kuwait and<br />
the United Arab Emirates, partially offset by a rise in catalytic cracking and hydro-cracking capacity<br />
in IR Iran.<br />
The conversion/distillation ratio in OPEC Member Countries of 19.1 per cent <strong>fo</strong>r the year 1998<br />
28


