C:\Annual Report 1998\AR1998 fo - Peace Palace Library
C:\Annual Report 1998\AR1998 fo - Peace Palace Library
C:\Annual Report 1998\AR1998 fo - Peace Palace Library

You also want an ePaper? Increase the reach of your titles
YUMPU automatically turns print PDFs into web optimized ePapers that Google loves.
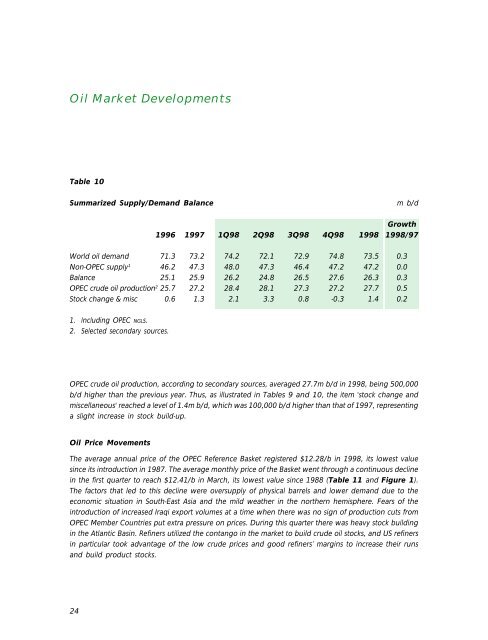
Oil Market Developments<br />
Table 10<br />
Summarized Supply/Demand Balance<br />
m b/d<br />
Growth<br />
1996 1997 1Q98 2Q98 3Q98 4Q98 1998 1998/97<br />
World oil demand 71.3 73.2 74.2 72.1 72.9 74.8 73.5 0.3<br />
Non-OPEC supply 1 46.2 47.3 48.0 47.3 46.4 47.2 47.2 0.0<br />
Balance 25.1 25.9 26.2 24.8 26.5 27.6 26.3 0.3<br />
OPEC crude oil production 2 25.7 27.2 28.4 28.1 27.3 27.2 27.7 0.5<br />
Stock change & misc 0.6 1.3 2.1 3.3 0.8 -0.3 1.4 0.2<br />
1. Including OPEC NGLs.<br />
2. Selected secondary sources.<br />
OPEC crude oil production, according to secondary sources, averaged 27.7m b/d in 1998, being 500,000<br />
b/d higher than the previous year. Thus, as illustrated in Tables 9 and 10, the item 'stock change and<br />
miscellaneous' reached a level of 1.4m b/d, which was 100,000 b/d higher than that of 1997, representing<br />
a slight increase in stock build-up.<br />
Oil Price Movements<br />
The average annual price of the OPEC Reference Basket registered $12.28/b in 1998, its lowest value<br />
since its introduction in 1987. The average monthly price of the Basket went through a continuous decline<br />
in the first quarter to reach $12.41/b in March, its lowest value since 1988 (Table 11 and Figure 1).<br />
The factors that led to this decline were oversupply of physical barrels and lower demand due to the<br />
economic situation in South-East Asia and the mild weather in the northern hemisphere. Fears of the<br />
introduction of increased Iraqi export volumes at a time when there was no sign of production cuts from<br />
OPEC Member Countries put extra pressure on prices. During this quarter there was heavy stock building<br />
in the Atlantic Basin. Refiners utilized the contango in the market to build crude oil stocks, and US refiners<br />
in particular took advantage of the low crude prices and good refiners’ margins to increase their runs<br />
and build product stocks.<br />
24