Workflows for In-depth High Content Analysis - PerkinElmer
Workflows for In-depth High Content Analysis - PerkinElmer
Workflows for In-depth High Content Analysis - PerkinElmer

You also want an ePaper? Increase the reach of your titles
YUMPU automatically turns print PDFs into web optimized ePapers that Google loves.
Advanced analysis and visualization with the<br />
Volocity software<br />
The Volocity 3D Image <strong>Analysis</strong> Software provides users<br />
with the tools needed to visualize and analyze fluorescence<br />
images from a wide range of confocal microscopes,<br />
widefield and high content screening systems. The 3D<br />
visualization capabilities allow users to explore, rotate and<br />
fly through samples in real time and in detail. The Volocity<br />
software also has a wide range of features to identify,<br />
measure, track and chart objects, and includes algorithms<br />
<strong>for</strong> image deconvolution to eliminate noise and blur.<br />
By combining Volocity software into an assay workflow with<br />
our <strong>High</strong> <strong>Content</strong> Imaging systems, users can gain valuable<br />
in<strong>for</strong>mation like 3D visualizations of complex samples or<br />
single-cell time-resolved data, as demonstrated in the two<br />
applications examples that follow.<br />
Automated cell tracking<br />
The transcription factors of the NF-κB family play a pivotal<br />
role in all aspects of immunity and cellular response to<br />
pathogens. Upon induction of the NF-κB signaling pathway,<br />
NF-κB translocates from the cytoplasm to the nucleus. The<br />
activation of a negative feedback mechanism that can result<br />
in oscillations in the NF-κB localization has been described<br />
previously [Ashall, et. al., 2009; Sung, et. al., 2009]. On a<br />
population basis, such oscillations cannot be detected since<br />
they are masked by the individual cellular responses that<br />
are prone to cell-to-cell variability. There<strong>for</strong>e, we used cell<br />
tracking to generate time-resolved single-cell data.<br />
Live HEK293 cells stably expressing the NF-κB family<br />
member p65 c-terminally tagged with HaloTag ® (Promega)<br />
were stained with Hoechst 33342 (1.62 μM) and HaloTag ®<br />
TMR Ligand (5 μM) <strong>for</strong> 15 min. Cells were stimulated with<br />
10 ng/ml tumor necrosis factor α (TNFα) and imaged every<br />
5.3 min <strong>for</strong> 4.5 hr using the Operetta system equipped with<br />
a LWD 40X objective and a live cell chamber (set to 37 °C<br />
and 5% CO 2). Using the plate montage function of the<br />
Harmony ® <strong>High</strong> <strong>Content</strong> Imaging and <strong>Analysis</strong> Software, we<br />
selected fields suited <strong>for</strong> single-cell tracking.<br />
Operetta System<br />
Data Structure<br />
Operetta Database (ODA)<br />
• Experimental settings<br />
• Image metadata<br />
• Image analysis sequences<br />
• Image analysis results<br />
• Plate layouts<br />
• Image files<br />
Opera System Data Structure<br />
Opera Database (Opera PC)<br />
• Experimental settings<br />
• Image metadata<br />
• Image analysis sequences<br />
and scripts<br />
• Image analysis results<br />
• Plate layouts<br />
CIA Server<br />
• Image files<br />
(FLEX files)<br />
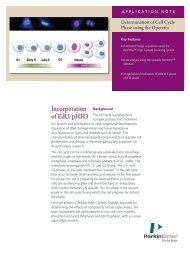
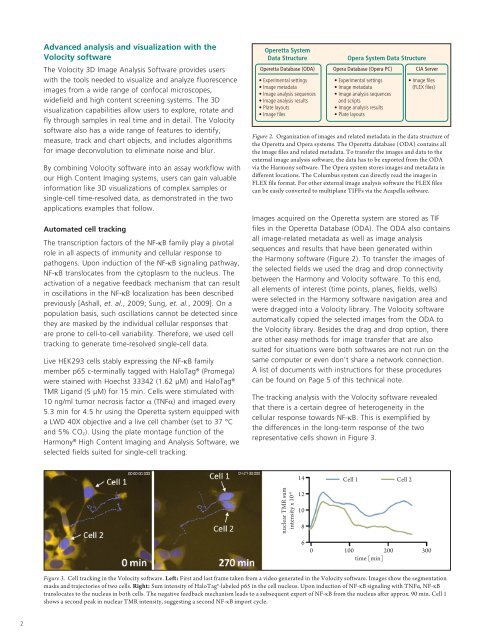
Figure 2. Organization of images and related metadata in the data structure of<br />
the Operetta and Opera systems. The Operetta database (ODA) contains all<br />
the image files and related metadata. To transfer the images and data to the<br />
external image analysis software, the data has to be exported from the ODA<br />
via the Harmony software. The Opera system stores images and metadata in<br />
different locations. The Columbus system can directly read the images in<br />
FLEX file <strong>for</strong>mat. For other external image analysis software the FLEX files<br />
can be easily converted to multiplane TIFFs via the Acapella software.<br />
Images acquired on the Operetta system are stored as TIF<br />
files in the Operetta Database (ODA). The ODA also contains<br />
all image-related metadata as well as image analysis<br />
sequences and results that have been generated within<br />
the Harmony software (Figure 2). To transfer the images of<br />
the selected fields we used the drag and drop connectivity<br />
between the Harmony and Volocity software. To this end,<br />
all elements of interest (time points, planes, fields, wells)<br />
were selected in the Harmony software navigation area and<br />
were dragged into a Volocity library. The Volocity software<br />
automatically copied the selected images from the ODA to<br />
the Volocity library. Besides the drag and drop option, there<br />
are other easy methods <strong>for</strong> image transfer that are also<br />
suited <strong>for</strong> situations were both softwares are not run on the<br />
same computer or even don’t share a network connection.<br />
A list of documents with instructions <strong>for</strong> these procedures<br />
can be found on Page 5 of this technical note.<br />
The tracking analysis with the Volocity software revealed<br />
that there is a certain degree of heterogeneity in the<br />
cellular response towards NF-κB. This is exemplified by<br />
the differences in the long-term response of the two<br />
representative cells shown in Figure 3.<br />
14<br />
Cell 1 Cell 2<br />
nuclear TMR sum<br />
intensity x 10 -6<br />
12<br />
10<br />
8<br />
6<br />
0 100 200 300<br />
time [min]<br />
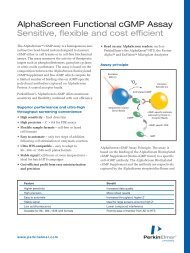
Figure 3. Cell tracking in the Volocity software. Left: First and last frame taken from a video generated in the Volocity software. Images show the segmentation<br />
masks and trajectories of two cells. Right: Sum intensity of HaloTag®-labeled p65 in the cell nucleus. Upon induction of NF-κB signaling with TNFα, NF-κB<br />
translocates to the nucleus in both cells. The negative feedback mechanism leads to a subsequent export of NF-κB from the nucleus after approx. 90 min. Cell 1<br />
shows a second peak in nuclear TMR intensity, suggesting a second NF-κB import cycle.<br />
2