Workflows for In-depth High Content Analysis - PerkinElmer
Workflows for In-depth High Content Analysis - PerkinElmer
Workflows for In-depth High Content Analysis - PerkinElmer

Create successful ePaper yourself
Turn your PDF publications into a flip-book with our unique Google optimized e-Paper software.
TECHNICAL NOTE<br />
<strong>Workflows</strong> <strong>for</strong> <strong>In</strong>-<strong>depth</strong><br />
<strong>High</strong> <strong>Content</strong> <strong>Analysis</strong><br />
Cellular Imaging and <strong>Analysis</strong><br />
Key Features<br />
• Three-dimensional visualization of<br />
cancer microtissues<br />
• Single cell tracking and analysis<br />
<strong>for</strong> studying NF-κB translocation<br />
• Secondary analysis to support<br />
decision making and quality control<br />
Background<br />
<strong>High</strong> content screening (HCS) is a rapid and flexible tool<br />
<strong>for</strong> studying biological processes in great detail at a high<br />
throughput. As a consequence, HCS campaigns generate<br />
large amounts of data that need to be analyzed. The initial<br />
analysis of acquired images can include object segmentation,<br />
calculation of object properties and object classification into<br />
different populations. Screening campaigns typically contain<br />
between 10 and a few hundred microplates with individual<br />
treatment conditions distributed among the different plates.<br />
There<strong>for</strong>e, the identification of parameters with suitable<br />
Z’ scores and the analysis of plate-to-plate variability are<br />
mandatory steps in the analysis of screening data. These<br />
analysis steps are per<strong>for</strong>med during secondary analysis.<br />
Once a compound treatment generates a cellular reaction,<br />
the images from the selected hit wells can be analyzed<br />
in more detail. This could include the calculation of 3D<br />
representations from acquired image stacks, the generation<br />
of movies from time lapse experiments or the preparation of<br />
images <strong>for</strong> publication, e.g. after image deconvolution.<br />
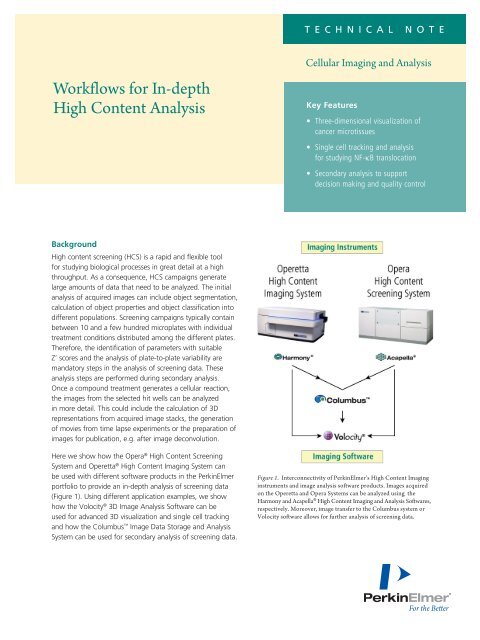
Here we show how the Opera ® <strong>High</strong> <strong>Content</strong> Screening<br />
System and Operetta ® <strong>High</strong> <strong>Content</strong> Imaging System can<br />
be used with different software products in the <strong>PerkinElmer</strong><br />
portfolio to provide an in-<strong>depth</strong> analysis of screening data<br />
(Figure 1). Using different application examples, we show<br />
how the Volocity ® 3D Image <strong>Analysis</strong> Software can be<br />
used <strong>for</strong> advanced 3D visualization and single cell tracking<br />
and how the Columbus Image Data Storage and <strong>Analysis</strong><br />
System can be used <strong>for</strong> secondary analysis of screening data.<br />
Figure 1. <strong>In</strong>terconnectivity of <strong>PerkinElmer</strong>’s <strong>High</strong> <strong>Content</strong> Imaging<br />
instruments and image analysis software products. Images acquired<br />
on the Operetta and Opera Systems can be analyzed using the<br />
Harmony and Acapella ® <strong>High</strong> <strong>Content</strong> Imaging and <strong>Analysis</strong> Softwares,<br />
respectively. Moreover, image transfer to the Columbus system or<br />
Volocity software allows <strong>for</strong> further analysis of screening data.
Advanced analysis and visualization with the<br />
Volocity software<br />
The Volocity 3D Image <strong>Analysis</strong> Software provides users<br />
with the tools needed to visualize and analyze fluorescence<br />
images from a wide range of confocal microscopes,<br />
widefield and high content screening systems. The 3D<br />
visualization capabilities allow users to explore, rotate and<br />
fly through samples in real time and in detail. The Volocity<br />
software also has a wide range of features to identify,<br />
measure, track and chart objects, and includes algorithms<br />
<strong>for</strong> image deconvolution to eliminate noise and blur.<br />
By combining Volocity software into an assay workflow with<br />
our <strong>High</strong> <strong>Content</strong> Imaging systems, users can gain valuable<br />
in<strong>for</strong>mation like 3D visualizations of complex samples or<br />
single-cell time-resolved data, as demonstrated in the two<br />
applications examples that follow.<br />
Automated cell tracking<br />
The transcription factors of the NF-κB family play a pivotal<br />
role in all aspects of immunity and cellular response to<br />
pathogens. Upon induction of the NF-κB signaling pathway,<br />
NF-κB translocates from the cytoplasm to the nucleus. The<br />
activation of a negative feedback mechanism that can result<br />
in oscillations in the NF-κB localization has been described<br />
previously [Ashall, et. al., 2009; Sung, et. al., 2009]. On a<br />
population basis, such oscillations cannot be detected since<br />
they are masked by the individual cellular responses that<br />
are prone to cell-to-cell variability. There<strong>for</strong>e, we used cell<br />
tracking to generate time-resolved single-cell data.<br />
Live HEK293 cells stably expressing the NF-κB family<br />
member p65 c-terminally tagged with HaloTag ® (Promega)<br />
were stained with Hoechst 33342 (1.62 μM) and HaloTag ®<br />
TMR Ligand (5 μM) <strong>for</strong> 15 min. Cells were stimulated with<br />
10 ng/ml tumor necrosis factor α (TNFα) and imaged every<br />
5.3 min <strong>for</strong> 4.5 hr using the Operetta system equipped with<br />
a LWD 40X objective and a live cell chamber (set to 37 °C<br />
and 5% CO 2). Using the plate montage function of the<br />
Harmony ® <strong>High</strong> <strong>Content</strong> Imaging and <strong>Analysis</strong> Software, we<br />
selected fields suited <strong>for</strong> single-cell tracking.<br />
Operetta System<br />
Data Structure<br />
Operetta Database (ODA)<br />
• Experimental settings<br />
• Image metadata<br />
• Image analysis sequences<br />
• Image analysis results<br />
• Plate layouts<br />
• Image files<br />
Opera System Data Structure<br />
Opera Database (Opera PC)<br />
• Experimental settings<br />
• Image metadata<br />
• Image analysis sequences<br />
and scripts<br />
• Image analysis results<br />
• Plate layouts<br />
CIA Server<br />
• Image files<br />
(FLEX files)<br />
Figure 2. Organization of images and related metadata in the data structure of<br />
the Operetta and Opera systems. The Operetta database (ODA) contains all<br />
the image files and related metadata. To transfer the images and data to the<br />
external image analysis software, the data has to be exported from the ODA<br />
via the Harmony software. The Opera system stores images and metadata in<br />
different locations. The Columbus system can directly read the images in<br />
FLEX file <strong>for</strong>mat. For other external image analysis software the FLEX files<br />
can be easily converted to multiplane TIFFs via the Acapella software.<br />
Images acquired on the Operetta system are stored as TIF<br />
files in the Operetta Database (ODA). The ODA also contains<br />
all image-related metadata as well as image analysis<br />
sequences and results that have been generated within<br />
the Harmony software (Figure 2). To transfer the images of<br />
the selected fields we used the drag and drop connectivity<br />
between the Harmony and Volocity software. To this end,<br />
all elements of interest (time points, planes, fields, wells)<br />
were selected in the Harmony software navigation area and<br />
were dragged into a Volocity library. The Volocity software<br />
automatically copied the selected images from the ODA to<br />
the Volocity library. Besides the drag and drop option, there<br />
are other easy methods <strong>for</strong> image transfer that are also<br />
suited <strong>for</strong> situations were both softwares are not run on the<br />
same computer or even don’t share a network connection.<br />
A list of documents with instructions <strong>for</strong> these procedures<br />
can be found on Page 5 of this technical note.<br />
The tracking analysis with the Volocity software revealed<br />
that there is a certain degree of heterogeneity in the<br />
cellular response towards NF-κB. This is exemplified by<br />
the differences in the long-term response of the two<br />
representative cells shown in Figure 3.<br />
14<br />
Cell 1 Cell 2<br />
nuclear TMR sum<br />
intensity x 10 -6<br />
12<br />
10<br />
8<br />
6<br />
0 100 200 300<br />
time [min]<br />
Figure 3. Cell tracking in the Volocity software. Left: First and last frame taken from a video generated in the Volocity software. Images show the segmentation<br />
masks and trajectories of two cells. Right: Sum intensity of HaloTag®-labeled p65 in the cell nucleus. Upon induction of NF-κB signaling with TNFα, NF-κB<br />
translocates to the nucleus in both cells. The negative feedback mechanism leads to a subsequent export of NF-κB from the nucleus after approx. 90 min. Cell 1<br />
shows a second peak in nuclear TMR intensity, suggesting a second NF-κB import cycle.<br />
2
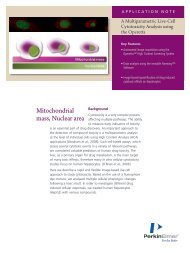
Visualization of 3D microtissues<br />
To obtain more physiologically relevant data, 3D cell<br />
culture methods that better mimic native tissues have been<br />
developed in the recent past. Microtissues are believed to<br />
provide a better drug prediction efficacy and serve as in<br />
vitro tumor models [Fayad, et. al., 2011; Hirschhaeuser, et.<br />
al., 2010]. <strong>PerkinElmer</strong> in vivo near infrared (NIR) agents are<br />
designed to monitor and quantify biological events such as<br />
cancer or inflammatory diseases in small animals. These dyes<br />
are also suited to imaging and characterizing tissue samples<br />
such as 3D microtissues. Here, we used the HypoxiSense ®<br />
680 Fluorescent Imaging Agent to visualize hypoxia inside a<br />
cancer microtissue.<br />
3D microtissues consisting of HT-29 colorectal<br />
adenocarcinoma cells (<strong>In</strong>Sphero ® , hCo-CCL02, Catalog No.:<br />
MT-01-004-01) were stained with 100 nM HypoxiSense 680<br />
agent (<strong>PerkinElmer</strong>, NEV11070) and 1.6 µM Hoechst 33342.<br />
The microtissues were imaged in a 384-well CellCarrier <br />
microtiter plate (<strong>PerkinElmer</strong>, 6007550) with the 20X water<br />
objective on an Opera system and a stack of 43 planes with<br />
a total height of 84 µm was acquired.<br />
The Opera system stores images in the FLEX file <strong>for</strong>mat<br />
on the Cell Image <strong>Analysis</strong> (CIA) server. <strong>In</strong> addition to<br />
the images, FLEX files also contain metadata such as well<br />
and field in<strong>for</strong>mation or image resolution. The images are<br />
organized by the Opera database. Image analysis results<br />
from the Acapella-based Remote Method Cell Analyzer<br />
(RMCA) Software of the Opera system are also saved in<br />
the database (Figure 2). To transfer images from an Opera<br />
system to the Volocity software the Opera FLEX files have<br />
to be converted into multiplane TIF files. To this end,<br />
the Acapella Script Collection contains the Volocity 3D<br />
Visualization script in the Tools section. The script requires<br />
the relevant FLEX files and the output folder as a userdefined<br />
input. After running the script, the generated<br />
TIF files can be imported into the Volocity library by drag<br />
and drop or by using the Import function of the Volocity<br />
software. A list of documents with detailed instructions on<br />
the image transfer from the Opera and also the Columbus<br />
system towards the Volocity software can be found on<br />
Page 5 of this technical note.<br />
<strong>In</strong> the 3D visualization the nuclei seem to <strong>for</strong>m half of a<br />
shell, which results from the low penetration of shortwavelength<br />
light into the tissue. <strong>In</strong> contrast, the far red<br />
signal of the HypoxiSense 680 is strongly visible within<br />
the microtissue even at higher z-planes. Due to the high<br />
resolution of the 20X water objective even the subcellular<br />
localization of the HypoxiSense staining at the plasma<br />
membrane is visible (Figure 4).<br />
Figure 4. 3D reconstruction of a microtissue in the Volocity software.<br />
The angle of view is depicted by the arrows (x:y:z = green:red:blue). The<br />
microtissues were stained with Hoechst (blue; Nuclei) and HypoxiSense 680<br />
(red; hypoxic regions).<br />
Secondary analysis of data using the Columbus<br />
system<br />
The Columbus system is a server-based central image<br />
analysis system <strong>for</strong> screening data which allows users to<br />
import, store and analyze images from a variety of imaging<br />
devices. It provides a web-enabled interface and does not<br />
require local software installation to visualize images and<br />
results. The easy-to-use building block-based interface<br />
<strong>for</strong> image analysis facilitates the numerical expression of<br />
differences between cell intensity, morphology and texture.<br />
The secondary analysis capabilities of the Columbus system<br />
allow <strong>for</strong> the comparison of different plates or batches <strong>for</strong><br />
quality control and <strong>for</strong> the calculation of dose-response<br />
curves and Z’ scores.<br />
When integrated into the assay workflow with our <strong>High</strong><br />
<strong>Content</strong> Imaging systems, the Columbus system enables<br />
users to extract summary statistics and validate the quality of<br />
their results gained using the Opera or Operetta system, as<br />
illustrated by the following application example.<br />
3
<strong>Analysis</strong> of plate-to-plate variability using the Operetta<br />
and Columbus Systems<br />
The analysis of plate-to-plate variability and data<br />
normalization are important steps in the analysis of high<br />
content screening data. When conducted thoroughly,<br />
these steps will ultimately yield maximal experimental<br />
and biological outputs while reducing technical artifacts<br />
or random noise [Haney, 2008, pp. 336-341]. Here, we<br />
analyzed the plate-to-plate variability resulting from one of<br />
our routine staining protocols.<br />
HeLa cells were seeded under identical conditions into 7<br />
different 384-well CellCarrier microtiter plates. The day after<br />
seeding, cells were treated with different concentrations of<br />
Cytochalasin D <strong>for</strong> 6 hr, fixed and stained with Hoechst and<br />
Rhodamine-Phalloidin. Cytochalasin D binds G-actin and<br />
prevents actin polymerization resulting in a breakdown of<br />
the cellular actin cytoskeleton. Phenotypically, this results<br />
in cell rounding, reduction in cell size, cell cycle arrest and<br />
ultimately cell death.<br />
To analyze plate-to-plate variability, images of all<br />
prepared microplates were acquired using the Operetta<br />
system equipped with a LWD 20X objective. Images were<br />
transferred to the Columbus system via the Columbus<br />
Transfer function in the Harmony software. This function<br />
exports all image-related metadata, analysis sequences,<br />
assay layouts and evaluation results and links to the image<br />
file locations on the ODA. After loading this export into the<br />
Columbus system, the Columbus system will automatically<br />
copy all the images directly from the ODA. Please find a<br />
list of detailed instructions on the image transfer from the<br />
Opera and Operetta systems towards the Columbus system<br />
on Page 5 of this technical note.<br />
On the Columbus system different cellular properties were<br />
calculated using a building block-based image analysis.<br />
Secondary analysis on the Columbus system is also based<br />
on simple building blocks and allows <strong>for</strong> in-<strong>depth</strong> analysis<br />
of the numerical data obtained from image analysis. For<br />
instance, the secondary analysis allows the calculation of the<br />
Z’ factor <strong>for</strong> every property and plate which facilitates the<br />
identification of properties with high statistical relevance.<br />
Using the Heatmap View in the Columbus software, the<br />
dose-dependent change in the cell area can be visualized<br />
<strong>for</strong> several plates at once (Figure 5A). The property with the<br />
highest statistical significance (STAR morphology property<br />
Cell Profile 2/5) was used to compare all plates of the batch<br />
(Figure 5B).<br />
Conclusion<br />
<strong>In</strong> this study, we elucidated the workflow <strong>for</strong> migration<br />
of imaging data from our Opera <strong>High</strong> <strong>Content</strong> Screening<br />
System and Operetta <strong>High</strong> <strong>Content</strong> Imaging System into<br />
the Volocity software and the Columbus system. By taking<br />
advantage of the integrated interfaces in the different<br />
software products, data transfer can be easily accomplished.<br />
Furthermore, we exemplified the benefits of data migration.<br />
The Volocity software provides sophisticated capabilities <strong>for</strong><br />
the analysis of 3D samples and cell tracking as shown by the<br />
visualization of cancer microtissues and the analysis of single<br />
cell NF-κB oscillations. The Columbus system has an easyto-use<br />
building block-based interface <strong>for</strong> image analysis and<br />
secondary analysis of screening data. <strong>In</strong> conjunction with<br />
high-end computational hardware, the Columbus system is<br />
the perfect tool <strong>for</strong> in-<strong>depth</strong> analysis of screening data.<br />
A<br />
B<br />
Plate No. 1 Plate No. 7 #1<br />
#2<br />
#3<br />
Plate<br />
#4<br />
#5<br />
Cytochalasin D<br />
concentration<br />
Cell Area [µm 2 ] Cell Area [µm 2 ]<br />
Cytochalasin D<br />
concentration<br />
#6<br />
#7<br />
0.00 0.25 0.50 0.75 1.00<br />
Z' factor<br />
Figure 5. Secondary analysis with the Columbus system. A) The property “Cell Area [µm²]” was selected <strong>for</strong> a heatmap visualization of two plates. The green<br />
arrow indicates the Cytochalasin D treated area of the plates. A dose-dependent decrease in cell area with increasing Cytochalasin D concentrations (from left to<br />
right) is visible. B) Comparison of Z’ factor <strong>for</strong> 7 different plates using the STAR morphology property “Cell profile 2/5” that reflects the localization of the actin<br />
close to the nucleus. Plates with a Z’ factor below a certain threshold could be rejected in a screen.<br />
4
<strong>In</strong>structions <strong>for</strong> Data Transfer<br />
Data Transfer from Columbus to Volocity:<br />
http://cellularimaging.perkinelmer.com/pdfs/technotes/Data<br />
Transfer from Columbus to Volocity.pdf<br />
Data Transfer from Opera to Columbus:<br />
http://cellularimaging.perkinelmer.com/pdfs/technotes/Data<br />
Transfer from Opera to Columbus.pdf<br />
Data Transfer from Opera to Volocity:<br />
http://cellularimaging.perkinelmer.com/pdfs/technotes/Data<br />
Transfer from Opera to Volocity.pdf<br />
Data Transfer from Operetta to Columbus:<br />
http://cellularimaging.perkinelmer.com/pdfs/technotes/Data<br />
Transfer from Operetta to Columbus.pdf<br />
Data Transfer from Operetta to Volocity:<br />
http://cellularimaging.perkinelmer.com/pdfs/technotes/Data<br />
Transfer from Operetta to Volocity.pdf<br />
References<br />
Ashall, L., Horton, C.A., Nelson, D.E., Paszek, P., Harper, C.V.,<br />
Sillitoe, K., Ryan, S., Spiller, D.G., Unitt, J.F., Broomhead,<br />
D.S., Kell, D.B., Rand, D.A., Sée, V. and White, M.R.H. (2009):<br />
Pulsatile stimulation determines timing and specificity of<br />
NF-kappaB-dependent transcription. Science, 324 (5924),<br />
242–246.<br />
Fayad, W., Rickardson, L., Haglund, C., Olofsson, M.H.,<br />
D’Arcy, P., Larsson, R., Linder, S. and Fryknäs, M. (2011):<br />
Identification of agents that induce apoptosis of multicellular<br />
tumour spheroids: enrichment <strong>for</strong> mitotic inhibitors with<br />
hydrophobic properties. Chemical biology and drug design,<br />
78 (4), 547–57.<br />
Haney, S.A. ed. (2008): <strong>High</strong> <strong>Content</strong> Screening: Science,<br />
Techniques and Applications. John Wiley and Sons, Hoboken, NJ.<br />
Hirschhaeuser, F., Menne, H., Dittfeld, C., West, J., Mueller-<br />
Klieser, W. and Kunz-Schughart, L.A. (2010): Multicellular<br />
tumor spheroids: an underestimated tool is catching up again.<br />
Journal of biotechnology, 148 (1), 3–15.<br />
Sung, M.-H., Salvatore, L., Lorenzi, R. De, <strong>In</strong>drawan, A.,<br />
Pasparakis, M., Hager, G.L., Bianchi, M.E. and Agresti, A.<br />
(2009): Sustained oscillations of NF-kappaB produce distinct<br />
genome scanning and gene expression profiles. PLoS One,<br />
4 (9), e7163.<br />
Authors<br />
Matthias Fassler<br />
Andrew Barlow<br />
Claire Stewart<br />
Karin Boettcher<br />
<strong>PerkinElmer</strong><br />
Cellular Technologies Germany GmbH<br />
Cellular Imaging and <strong>Analysis</strong><br />
Hamburg, DE<br />
<strong>PerkinElmer</strong>, <strong>In</strong>c.<br />
940 Winter Street<br />
Waltham, MA 02451 USA<br />
P: (800) 762-4000 or<br />
(+1) 203-925-4602<br />
www.perkinelmer.com<br />
For a complete listing of our global offices, visit www.perkinelmer.com/ContactUs<br />
Copyright ©2012, <strong>PerkinElmer</strong>, <strong>In</strong>c. All rights reserved. <strong>PerkinElmer</strong> ® is a registered trademark of <strong>PerkinElmer</strong>, <strong>In</strong>c. All other trademarks are the property of their respective owners.<br />
010577_01 Dec. 2012