Workflows for In-depth High Content Analysis - PerkinElmer
Workflows for In-depth High Content Analysis - PerkinElmer
Workflows for In-depth High Content Analysis - PerkinElmer

You also want an ePaper? Increase the reach of your titles
YUMPU automatically turns print PDFs into web optimized ePapers that Google loves.
<strong>Analysis</strong> of plate-to-plate variability using the Operetta<br />
and Columbus Systems<br />
The analysis of plate-to-plate variability and data<br />
normalization are important steps in the analysis of high<br />
content screening data. When conducted thoroughly,<br />
these steps will ultimately yield maximal experimental<br />
and biological outputs while reducing technical artifacts<br />
or random noise [Haney, 2008, pp. 336-341]. Here, we<br />
analyzed the plate-to-plate variability resulting from one of<br />
our routine staining protocols.<br />
HeLa cells were seeded under identical conditions into 7<br />
different 384-well CellCarrier microtiter plates. The day after<br />
seeding, cells were treated with different concentrations of<br />
Cytochalasin D <strong>for</strong> 6 hr, fixed and stained with Hoechst and<br />
Rhodamine-Phalloidin. Cytochalasin D binds G-actin and<br />
prevents actin polymerization resulting in a breakdown of<br />
the cellular actin cytoskeleton. Phenotypically, this results<br />
in cell rounding, reduction in cell size, cell cycle arrest and<br />
ultimately cell death.<br />
To analyze plate-to-plate variability, images of all<br />
prepared microplates were acquired using the Operetta<br />
system equipped with a LWD 20X objective. Images were<br />
transferred to the Columbus system via the Columbus<br />
Transfer function in the Harmony software. This function<br />
exports all image-related metadata, analysis sequences,<br />
assay layouts and evaluation results and links to the image<br />
file locations on the ODA. After loading this export into the<br />
Columbus system, the Columbus system will automatically<br />
copy all the images directly from the ODA. Please find a<br />
list of detailed instructions on the image transfer from the<br />
Opera and Operetta systems towards the Columbus system<br />
on Page 5 of this technical note.<br />
On the Columbus system different cellular properties were<br />
calculated using a building block-based image analysis.<br />
Secondary analysis on the Columbus system is also based<br />
on simple building blocks and allows <strong>for</strong> in-<strong>depth</strong> analysis<br />
of the numerical data obtained from image analysis. For<br />
instance, the secondary analysis allows the calculation of the<br />
Z’ factor <strong>for</strong> every property and plate which facilitates the<br />
identification of properties with high statistical relevance.<br />
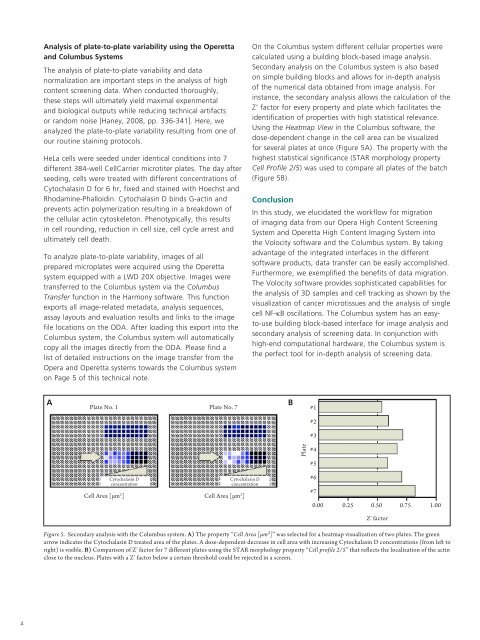
Using the Heatmap View in the Columbus software, the<br />
dose-dependent change in the cell area can be visualized<br />
<strong>for</strong> several plates at once (Figure 5A). The property with the<br />
highest statistical significance (STAR morphology property<br />
Cell Profile 2/5) was used to compare all plates of the batch<br />
(Figure 5B).<br />
Conclusion<br />
<strong>In</strong> this study, we elucidated the workflow <strong>for</strong> migration<br />
of imaging data from our Opera <strong>High</strong> <strong>Content</strong> Screening<br />
System and Operetta <strong>High</strong> <strong>Content</strong> Imaging System into<br />
the Volocity software and the Columbus system. By taking<br />
advantage of the integrated interfaces in the different<br />
software products, data transfer can be easily accomplished.<br />
Furthermore, we exemplified the benefits of data migration.<br />
The Volocity software provides sophisticated capabilities <strong>for</strong><br />
the analysis of 3D samples and cell tracking as shown by the<br />
visualization of cancer microtissues and the analysis of single<br />
cell NF-κB oscillations. The Columbus system has an easyto-use<br />
building block-based interface <strong>for</strong> image analysis and<br />
secondary analysis of screening data. <strong>In</strong> conjunction with<br />
high-end computational hardware, the Columbus system is<br />
the perfect tool <strong>for</strong> in-<strong>depth</strong> analysis of screening data.<br />
A<br />
B<br />
Plate No. 1 Plate No. 7 #1<br />
#2<br />
#3<br />
Plate<br />
#4<br />
#5<br />
Cytochalasin D<br />
concentration<br />
Cell Area [µm 2 ] Cell Area [µm 2 ]<br />
Cytochalasin D<br />
concentration<br />
#6<br />
#7<br />
0.00 0.25 0.50 0.75 1.00<br />
Z' factor<br />
Figure 5. Secondary analysis with the Columbus system. A) The property “Cell Area [µm²]” was selected <strong>for</strong> a heatmap visualization of two plates. The green<br />
arrow indicates the Cytochalasin D treated area of the plates. A dose-dependent decrease in cell area with increasing Cytochalasin D concentrations (from left to<br />
right) is visible. B) Comparison of Z’ factor <strong>for</strong> 7 different plates using the STAR morphology property “Cell profile 2/5” that reflects the localization of the actin<br />
close to the nucleus. Plates with a Z’ factor below a certain threshold could be rejected in a screen.<br />
4